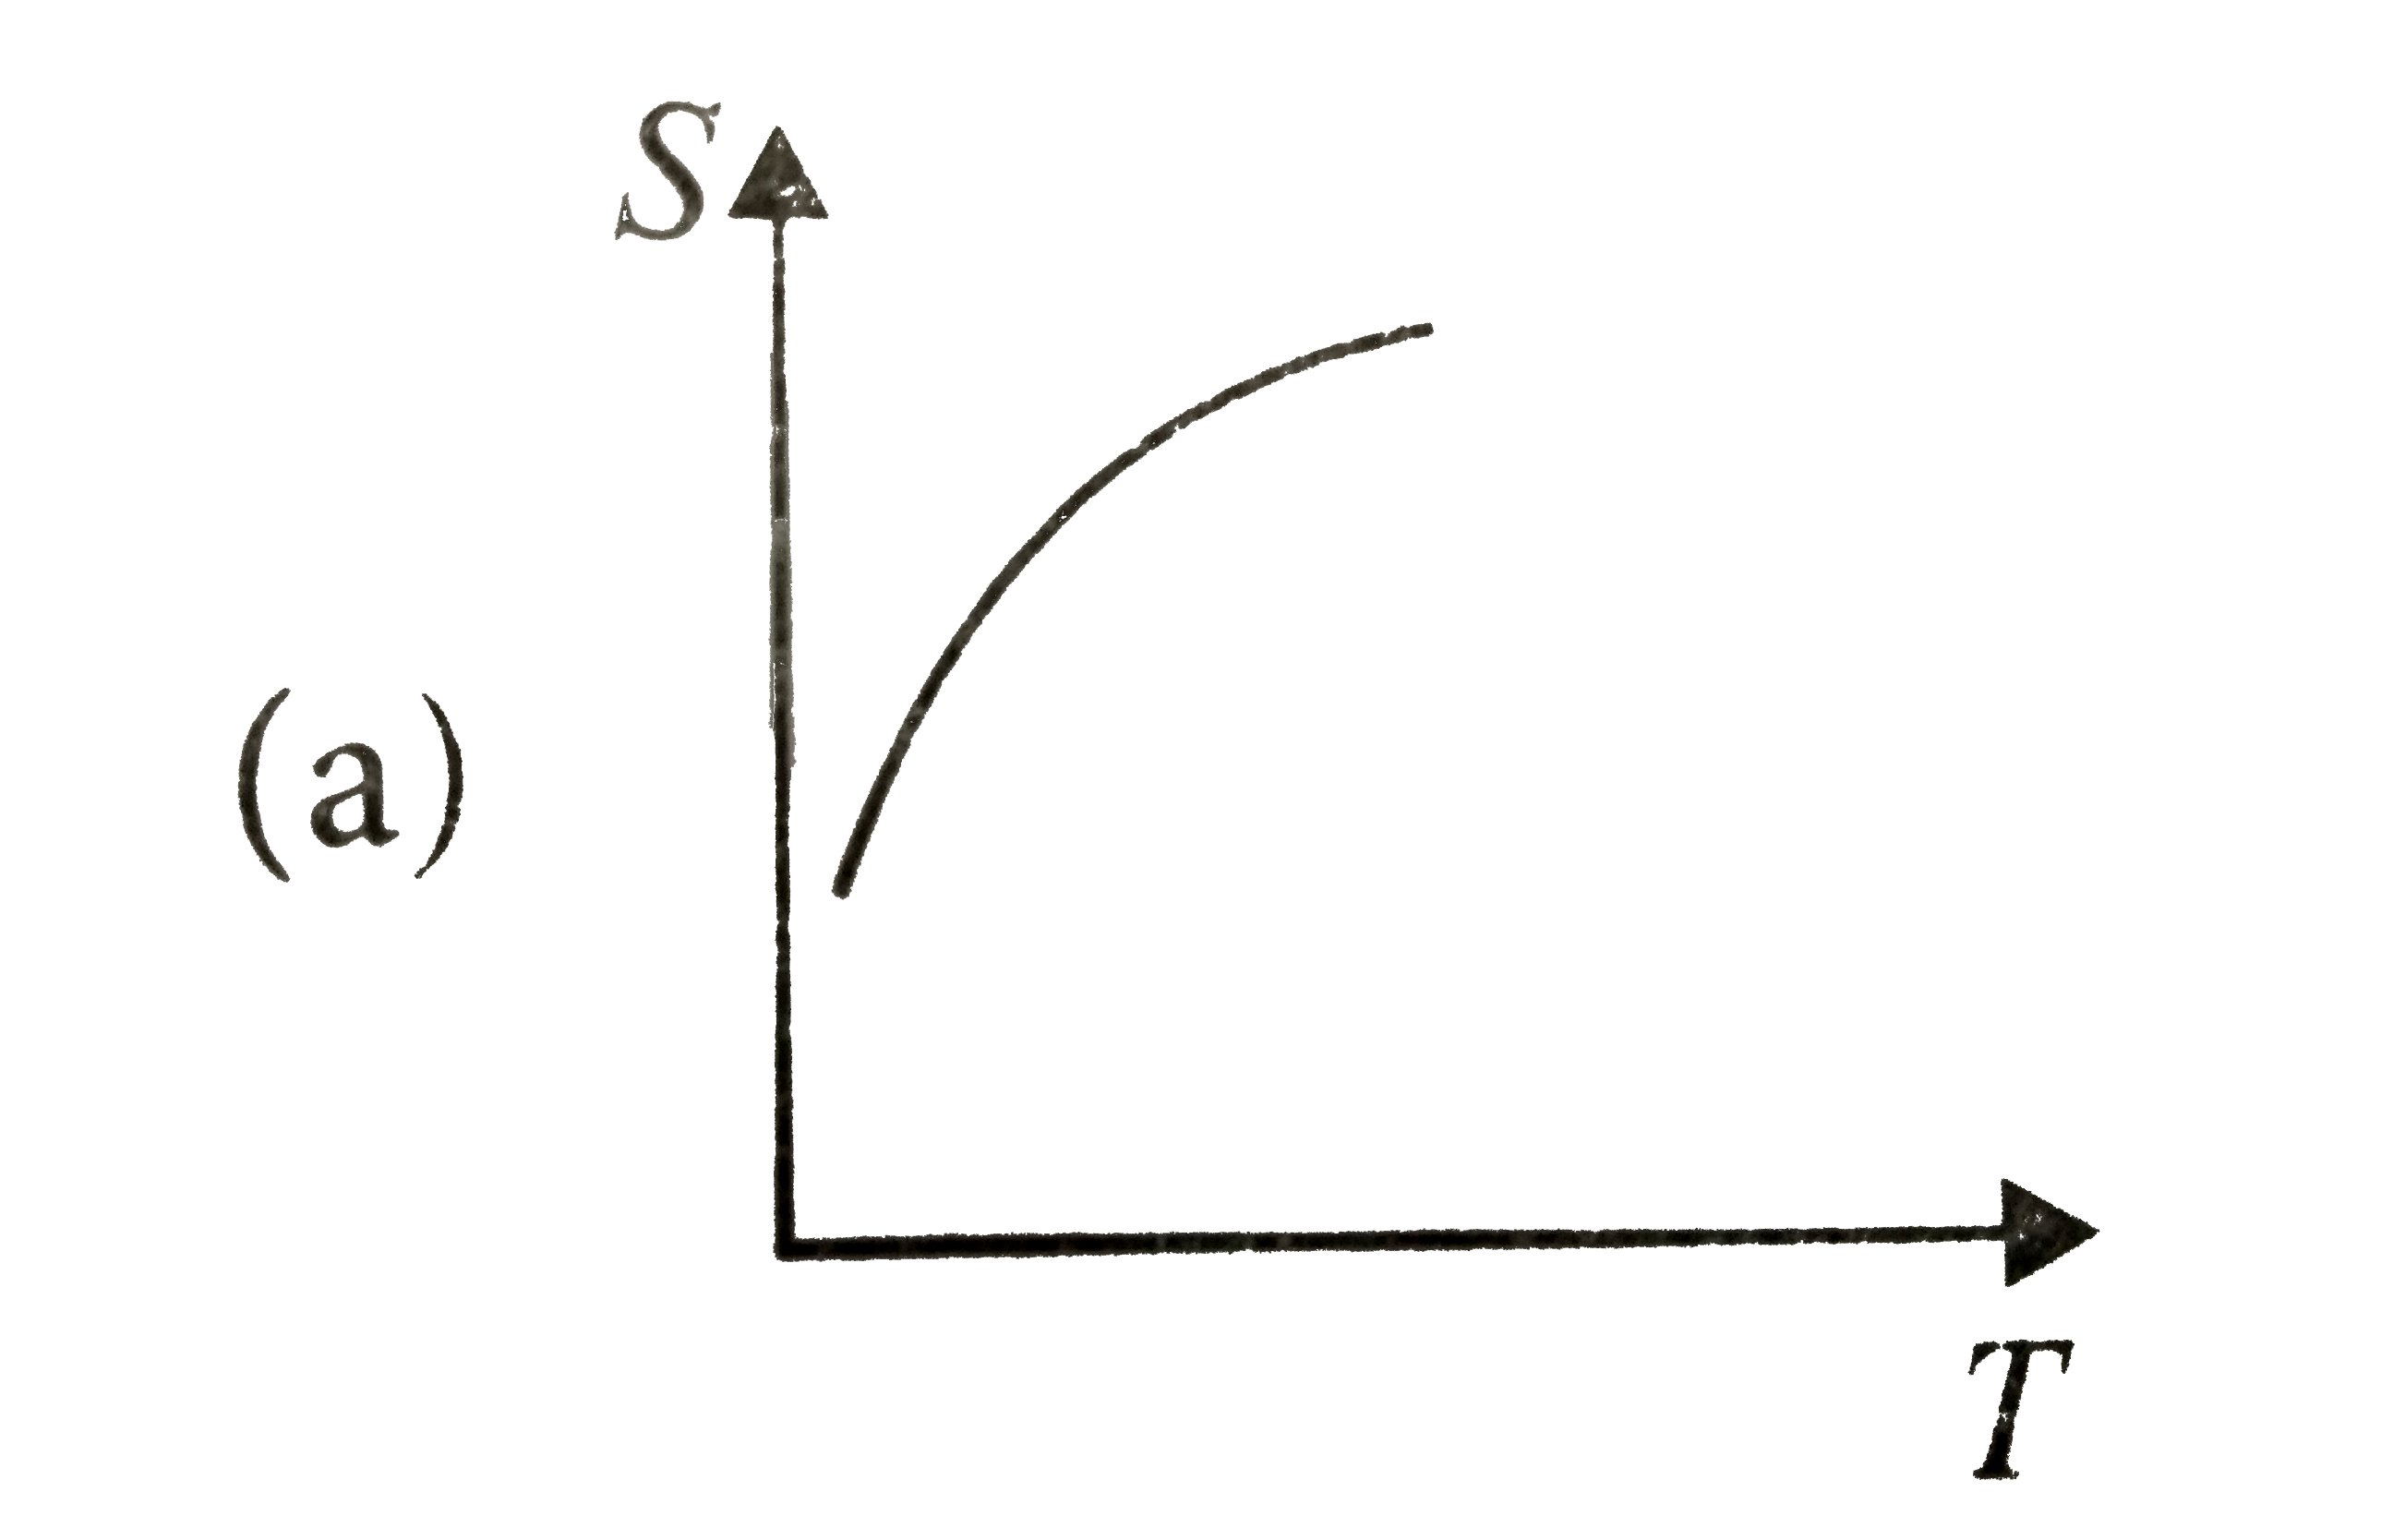
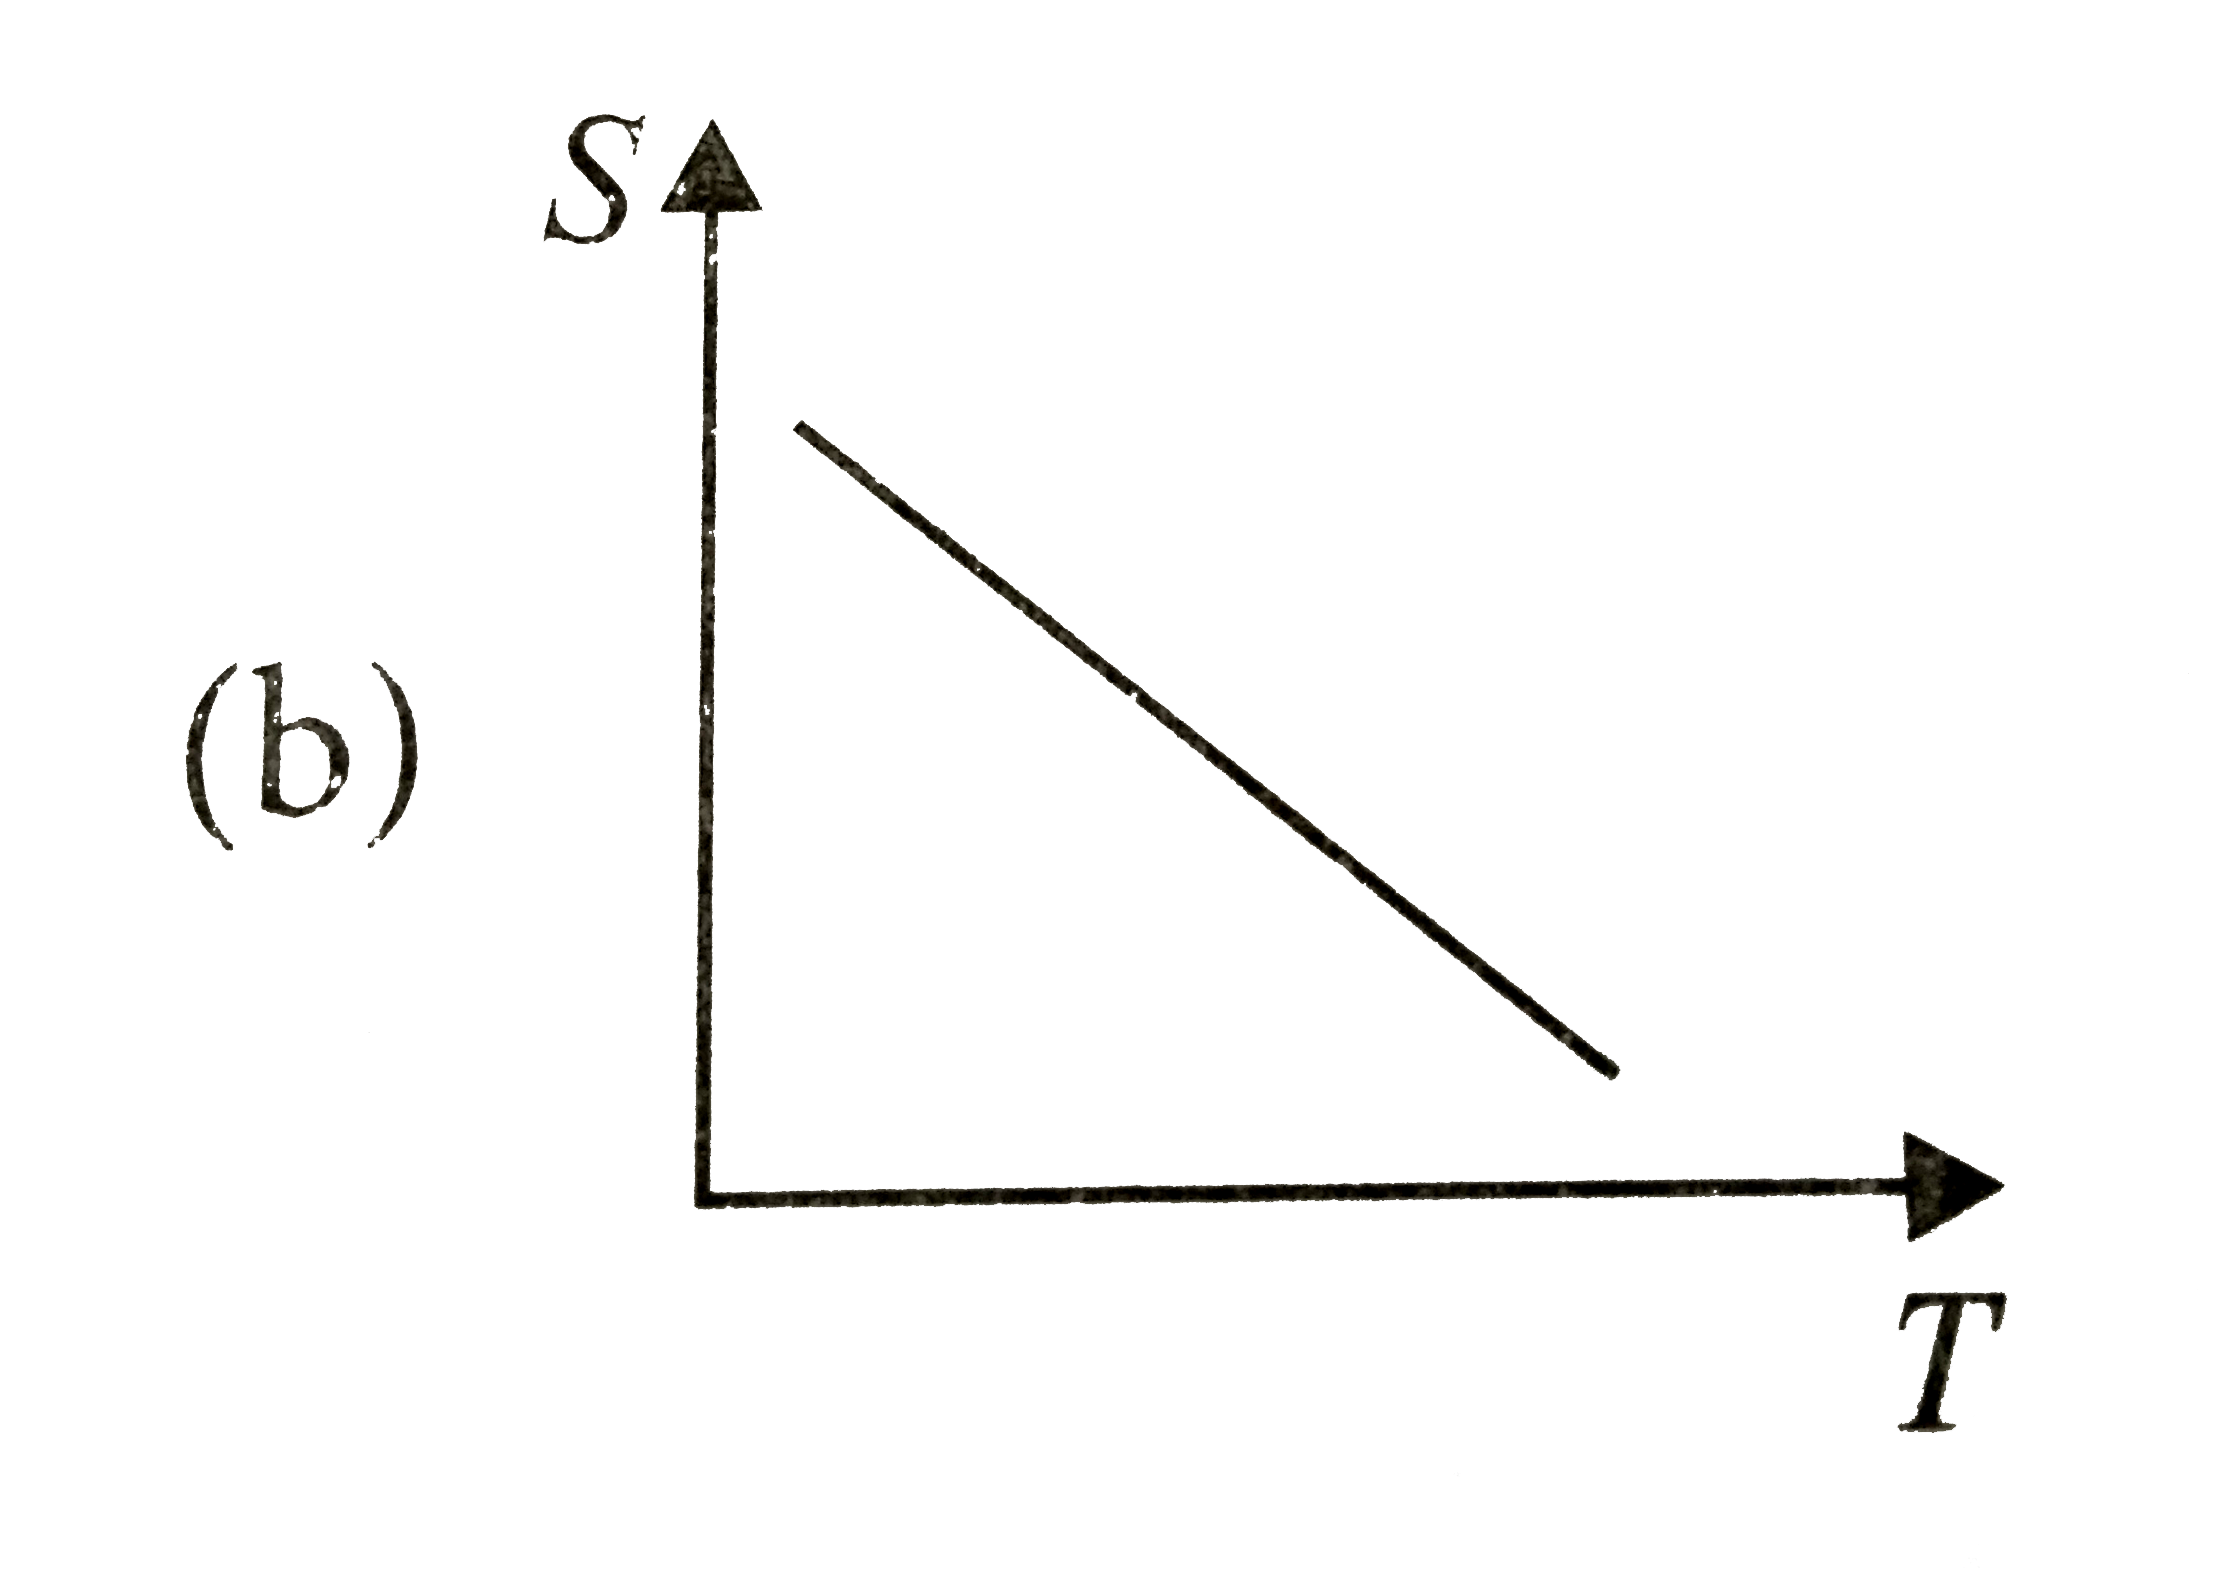
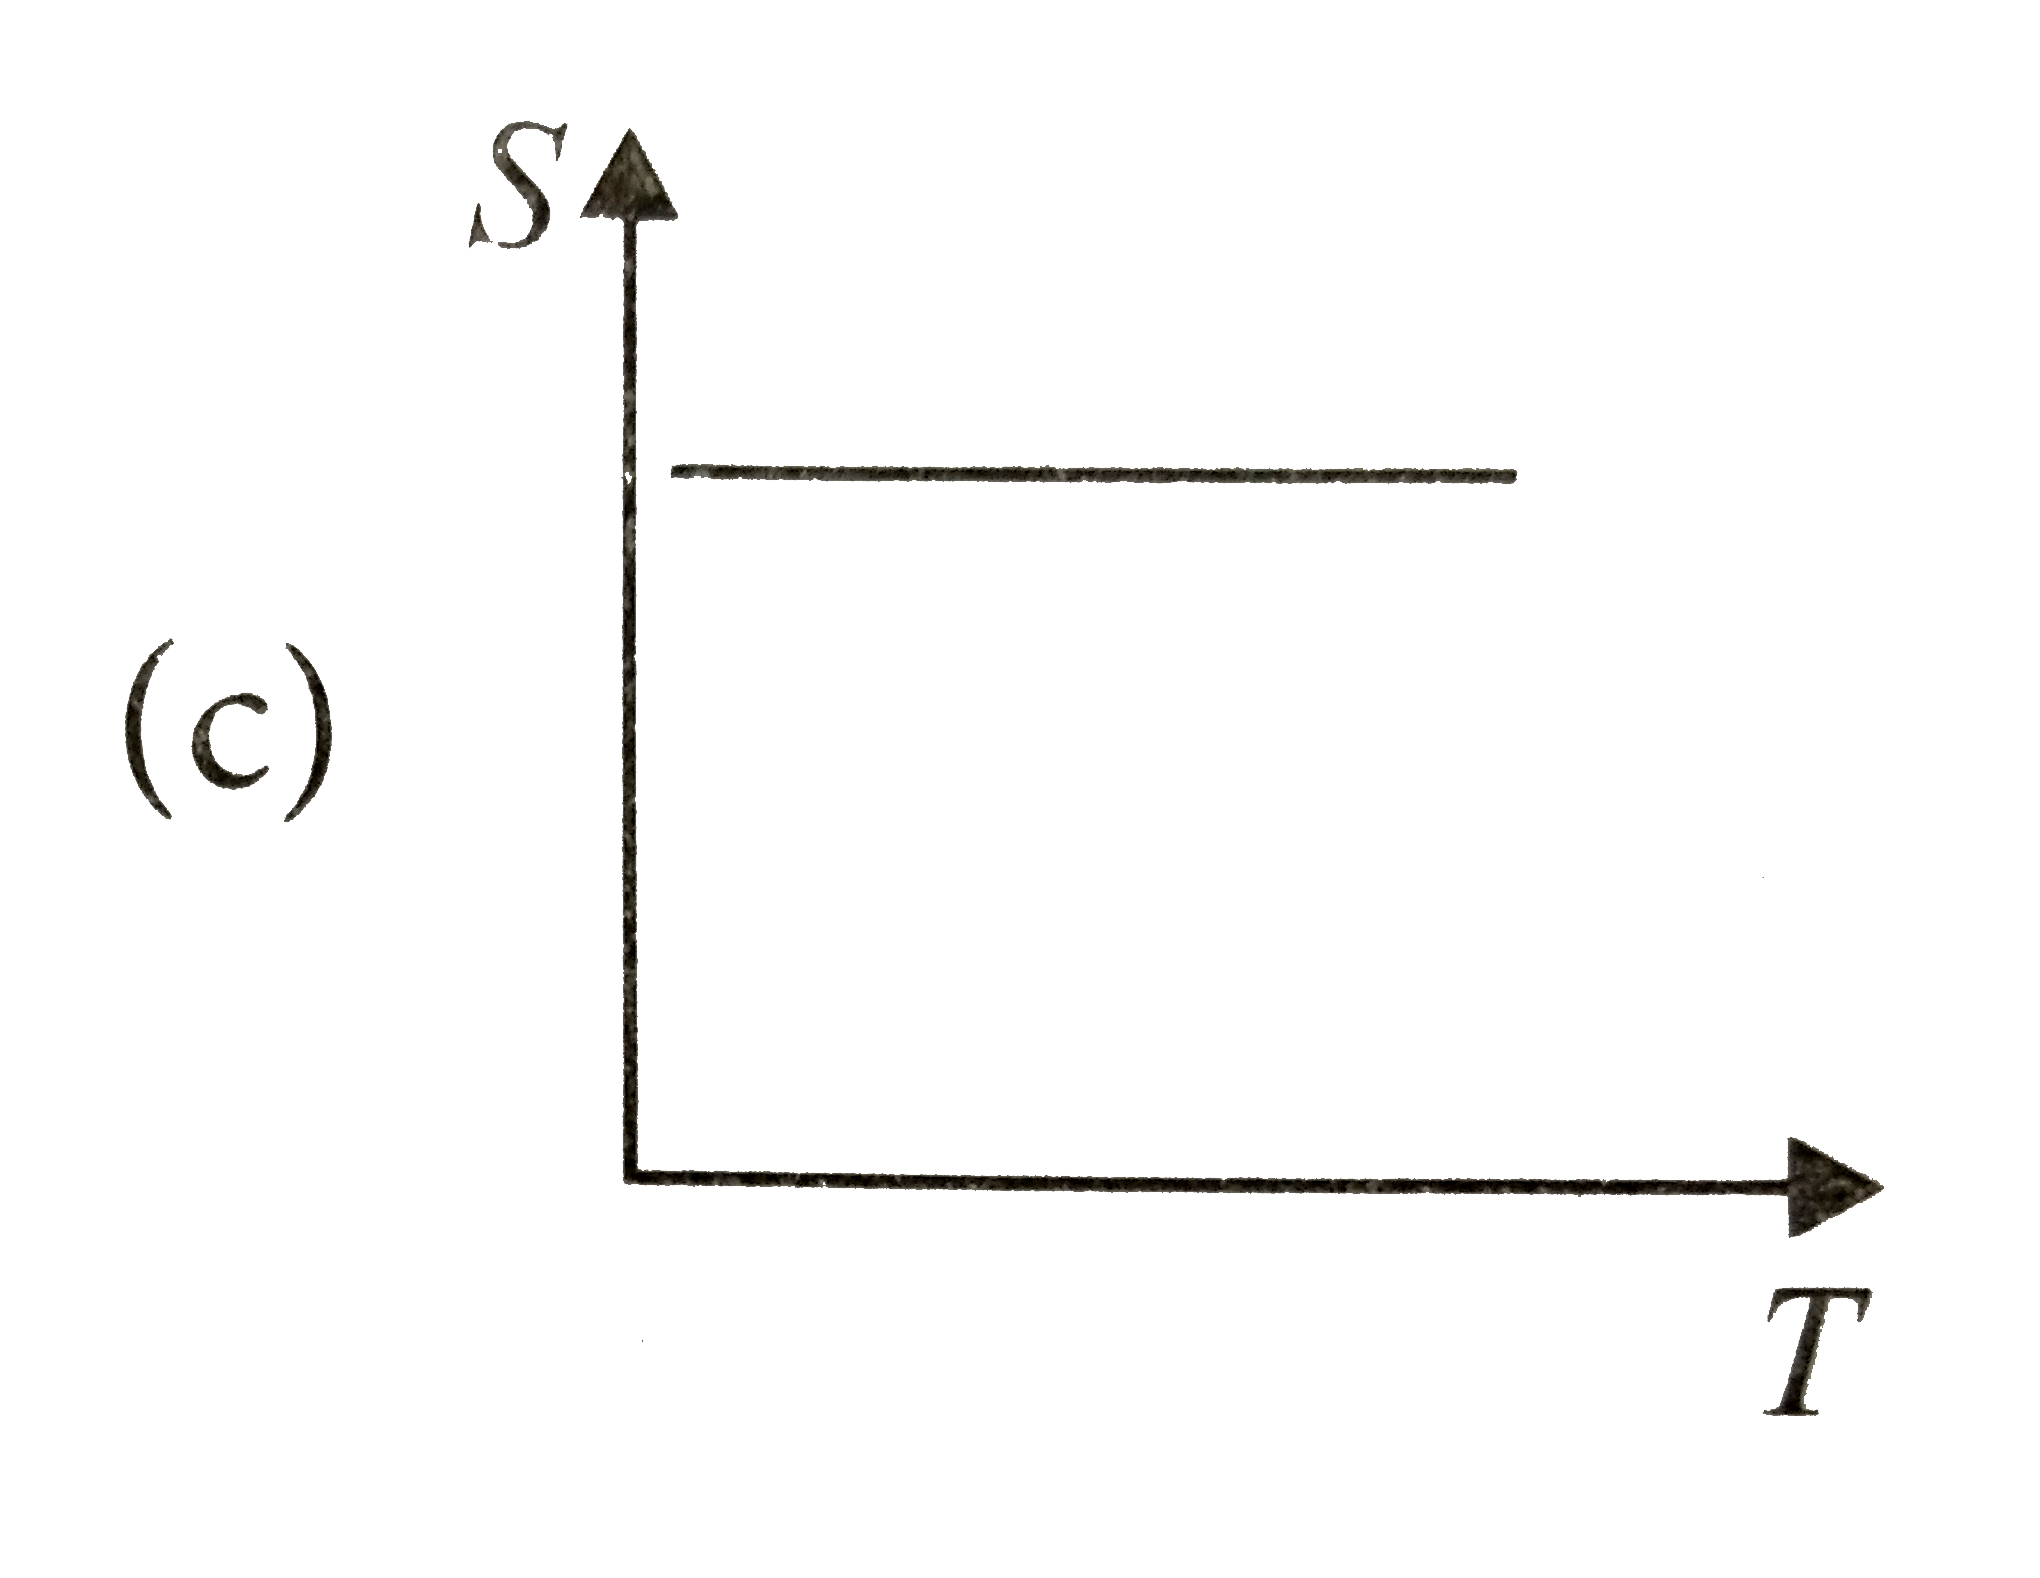
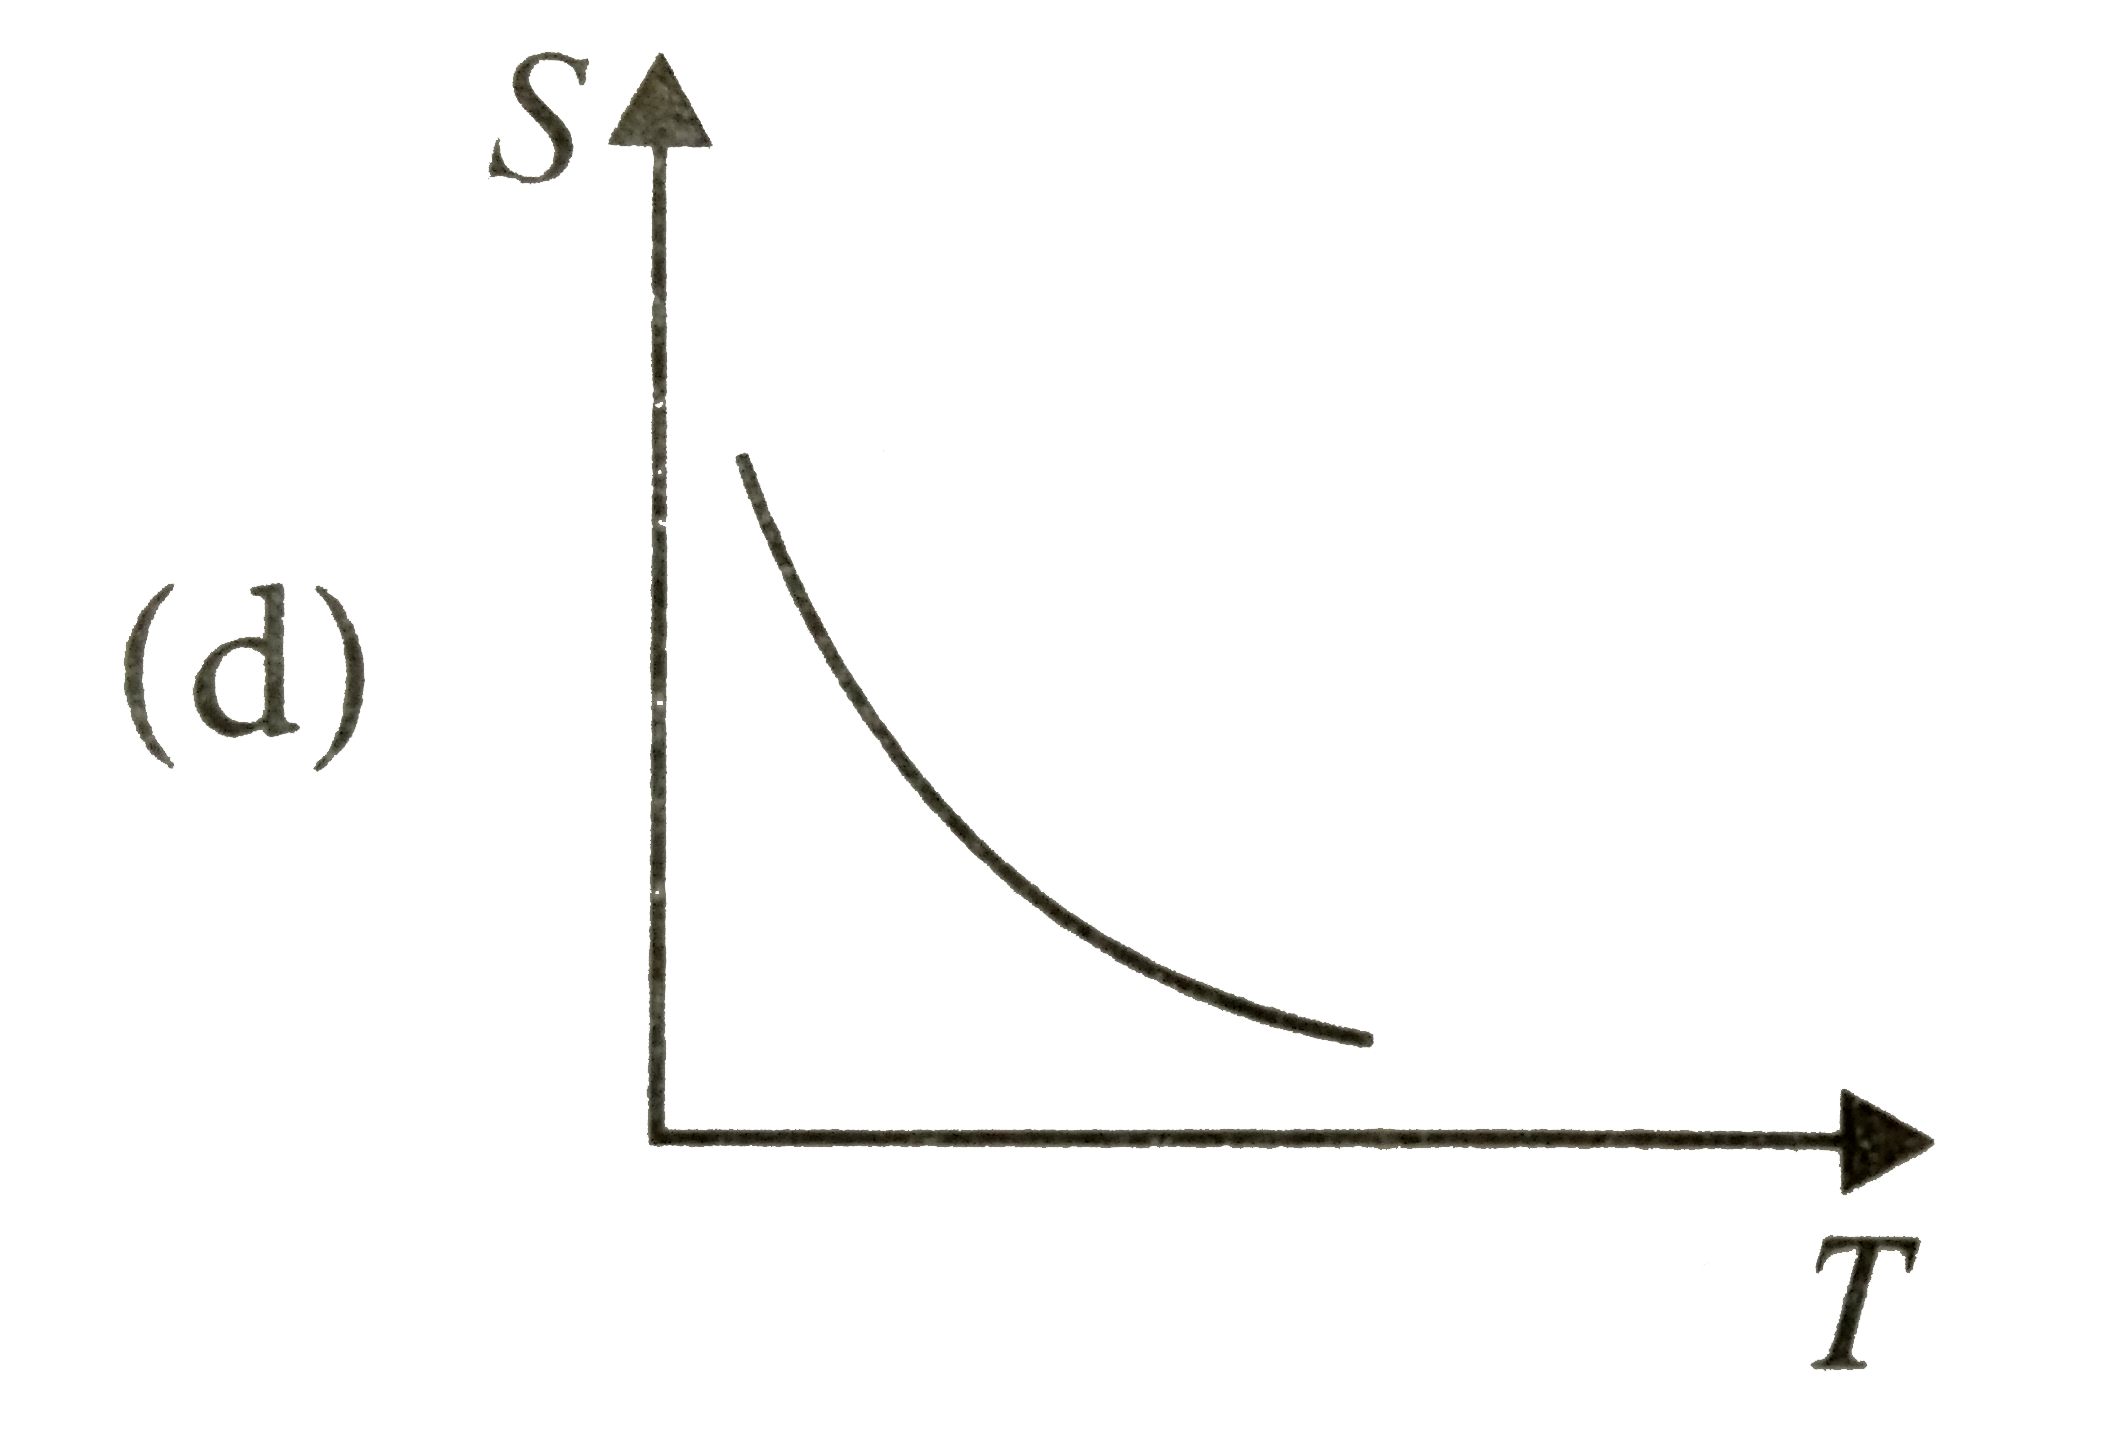
The graph between resistivity and temperature, for a limited range of temperature, is a straight line for a material like
A
copper
B
nichrome
C
silicon
D
mercury
Text Solution
The correct Answer is:B
For a limited range of temperature, the graph between resistivity and temperature is a straight line for a material like nichrome as shown in the figure.

|
Updated on:21/07/2023
Related Playlists
- BOOK - MTG GUIDECHAPTER - CURRENT ELECTRICITY EXERCISE - CHECK YOUR NEET VITALS16videos
CURRENT ELECTRICITY
- BOOK - MTG GUIDECHAPTER - CURRENT ELECTRICITY EXERCISE - MCQs AIPMT / NEET32videos
CURRENT ELECTRICITY
- BOOK - MTG GUIDECHAPTER - CURRENT ELECTRICITY EXERCISE - MCQs AIPMT / NEET32videos
CURRENT ELECTRICITY
- BOOK - MTG GUIDECHAPTER - ATOMS AND NUCLEIEXERCISE - AIPMT/NEET(MCQs)40videos
ATOMS AND NUCLEI
- BOOK - MTG GUIDECHAPTER - DUAL NATURE OF MATTER AND RADIATION EXERCISE - AIPMT/ NEET MCQs30videos
DUAL NATURE OF MATTER AND RADIATION
Similar Practice Problems
- Question 1 - Select One
The resistivity of a semiconductor at room temperature is in between
A1010 to 1012Ω cmB106 to 108Ω cmC10−3 to 106Ω cmD10−2 to 10−5Ω cm - Question 1 - Select One
Which graph represents the variation of surface tension with temperature over small temperature ranges for water?
A B
B C
C D
D
- Question 1 - Select One
The resistance of a wire at room temperature 30∘C is found to be 10Omnow to increase the resistance by 10% the temperature of the wire must be [the temperature coefficient of resistance of the material of the wire is 0.002 per ∘C]
A36∘CB83∘CC63∘CD33∘C - Question 1 - Select One
The resistance of a wire at room temperature 30∘C is found to be 10Omnow to increase the resistance by 10% the temperature of the wire must be [the temperature coefficient of resistance of the material of the wire is 0.002 per ∘C]
A36∘CB83∘CC63∘CD33∘C
Similar Questions
Show variation of resistivity of copper as a function of temperature in a graph.
View SolutionShow variation of resistivity of copper as a function of temperature in a graph.
View SolutionShow variation of resistivity of copper as a function of temperature in a graph.
View SolutionShow variation of resistivity of copper as a function of temperature in a graph.
View SolutionShow variation of resistivity of SI with temperature in a graph.
View SolutionWhich graph represents the variation of surface tension with temperature over small temperature ranges for water?
View Solution

