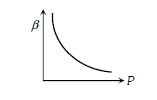
Which of the following graphs correctly represents the variation of β=−dV/dPV
with P for an ideal gas at constant temperature?


The correct Answer is:A
PV = constant
⇒PDV+VdP=0⇒PdV=VdP
β=−(1V)(dVdP)=1P⇒β×P=1
Graph is rectangular hyperbola.
Similar Questions
Which of the graphs shown below represents the variation of β=−1VdVdP with P for an ideal gas at constant temperature?
View SolutionWhich of the following graphs correctly represents the variation of β=−(dV/dP)/V with P for an ideal gas at constant temperature?
View SolutionWhich of the following graphs correctly represents the variation of Bη=−dv/dpv with P for n ideal gas at constant temperature ?
View SolutionWhich of the following graphs correctly represents the variation of β=−dV/dPV
with P for an ideal gas at constant temperature?
View SolutionWhich of the folowing graphs correctly represent the variation of beta = (dV/dP)/V with P for an ideal gas at constant temperature?
View SolutionWhich of the following graphs correctly represents the variation of β=−(dVdP)/V with P for an ideal gas at constant temperature
View SolutionWhich of the following graphs correctly represents the variation of beta=-(dV//dP)/V with P for an ideal gas at constant temperature?
View SolutionWhich of the following graphs correctly represents the variation of β=−(dVdP)/V with P for an ideal gas at constant temperature
View Solution