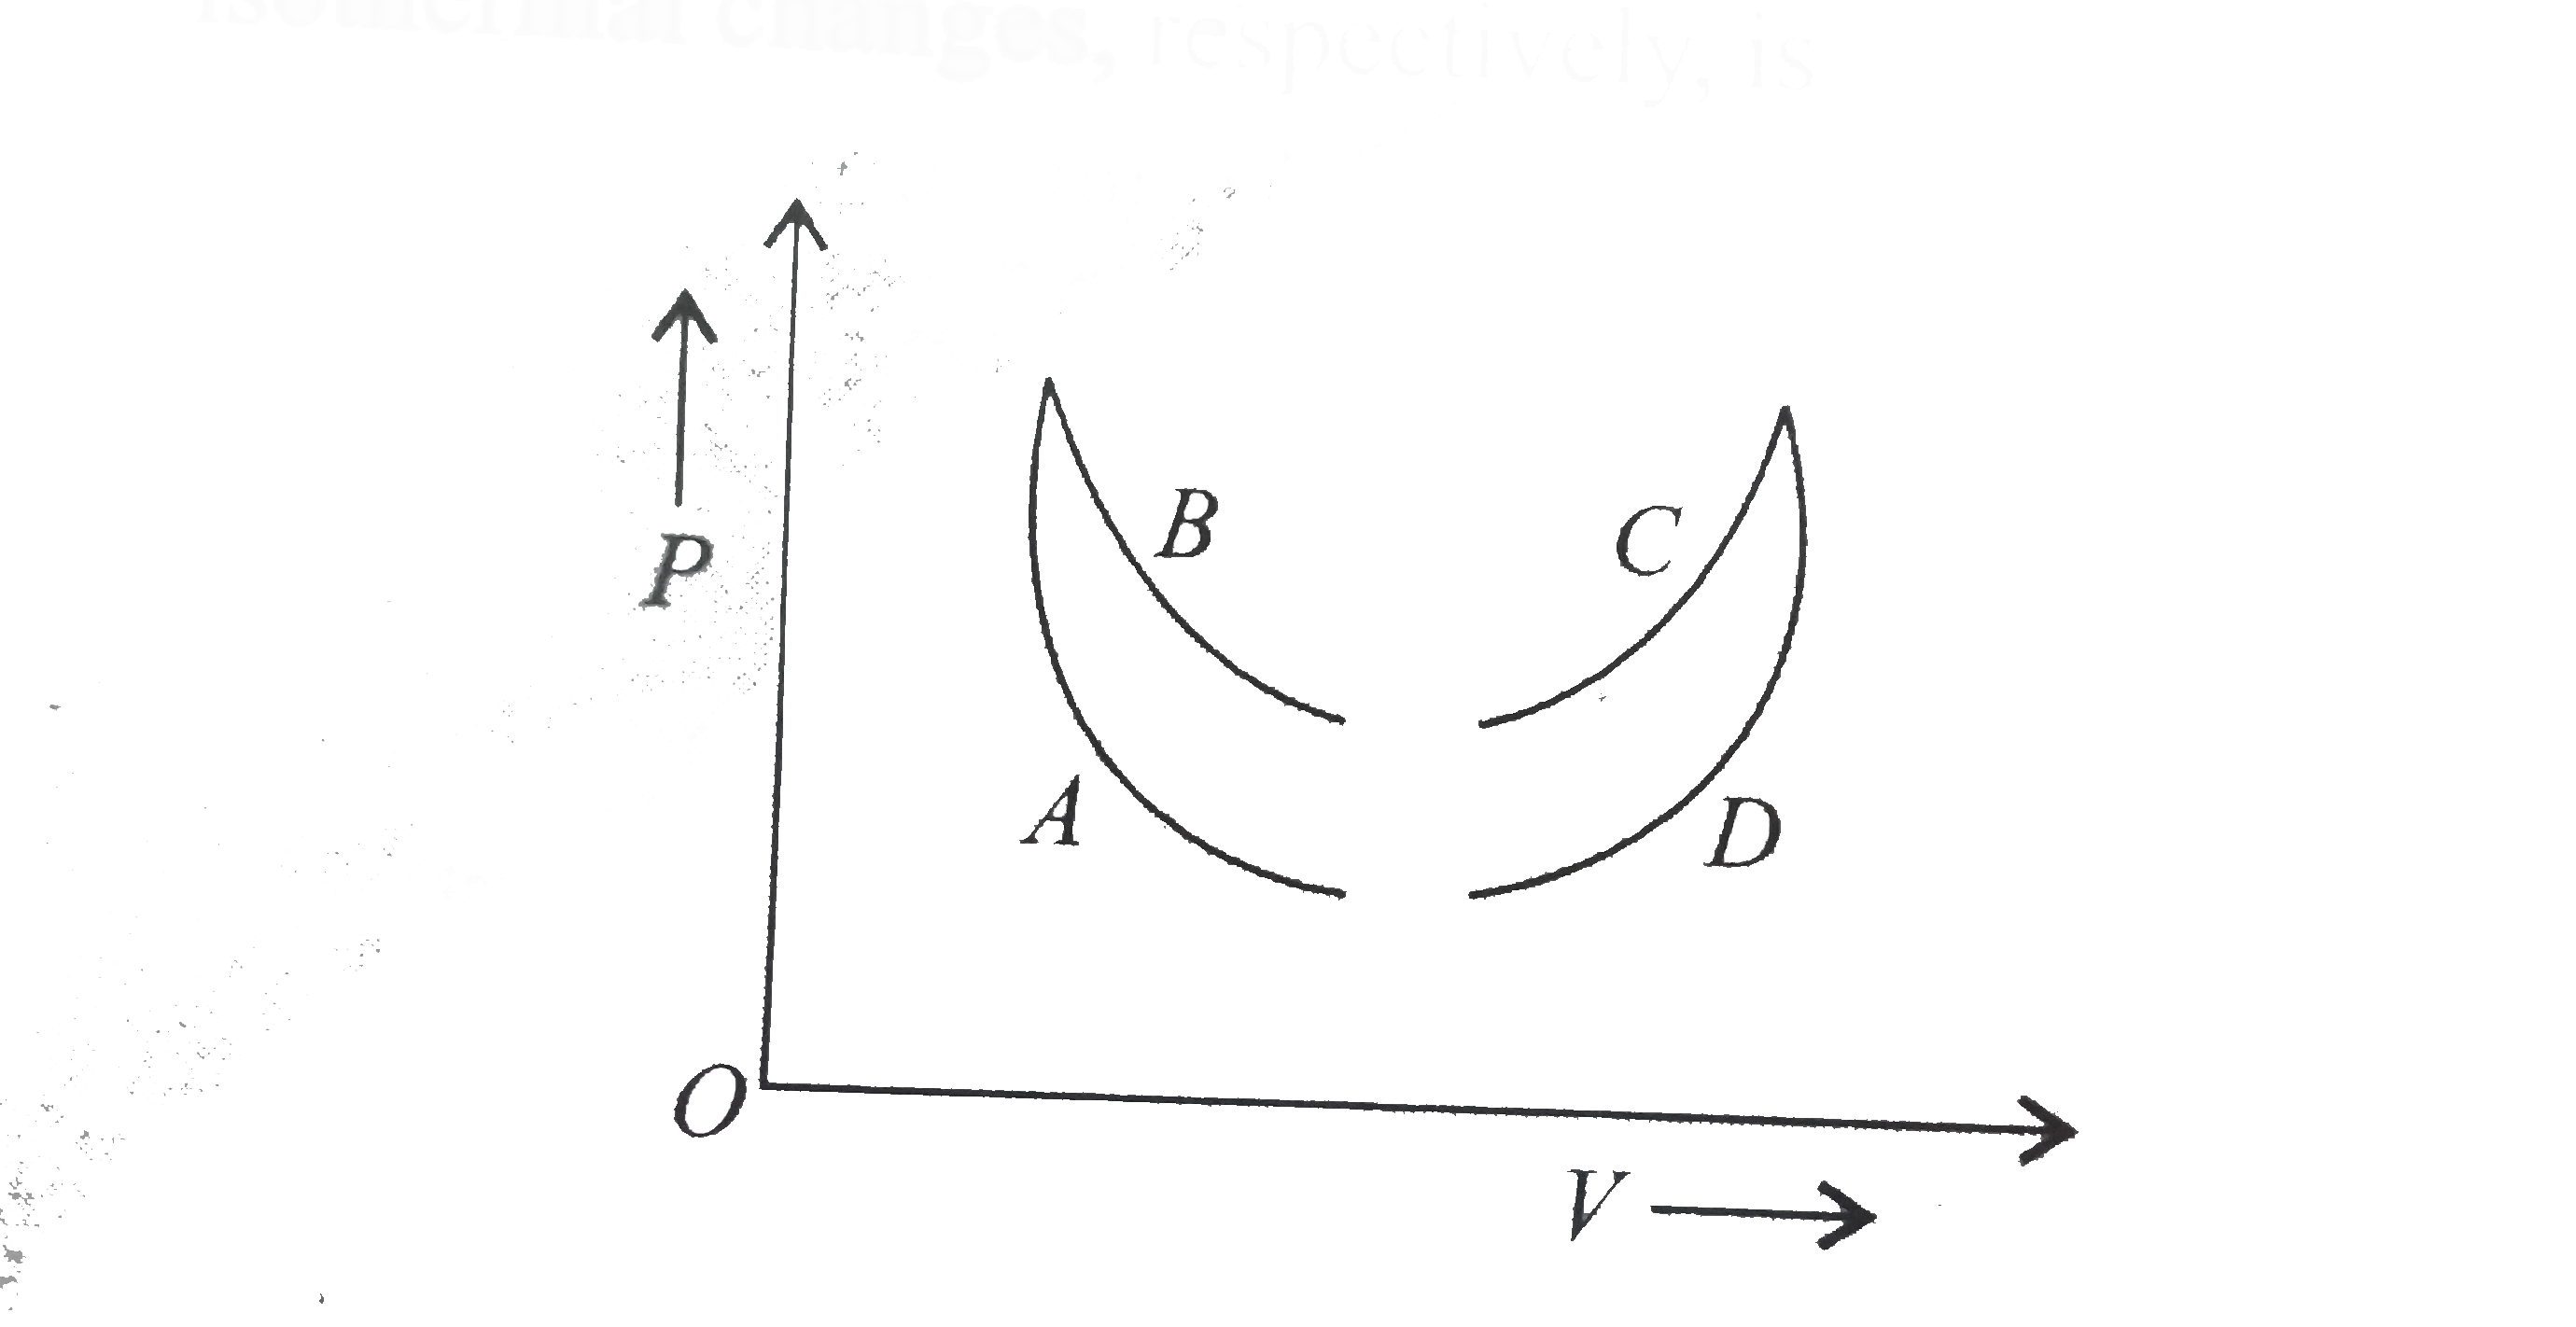
Four curves A,B,C and D are drawn in figure for a given amount of gas. The curve which represents adiabatic and isothermal changes, respectively, is

C and D respectively
D and C respectively
A and B respectively B
B and A respectively
The correct Answer is:C
Because (slope)adi>(slope)iso
Similar Questions
A gas may expand either adiabatically or isothermally. A number of p-V curves are drawn for the two process over different ranges of pressure and volume. It will be found that a) Two adiabatic curves do not intersect b) Two isothermal curves do not intersect c) An adiabatic curve and an isothermal curve may intersect d) The magnitude of the slope of an adiabatic curve is greater than the magnitude of the slope of an isothermal curve for the same values of pressure and volume
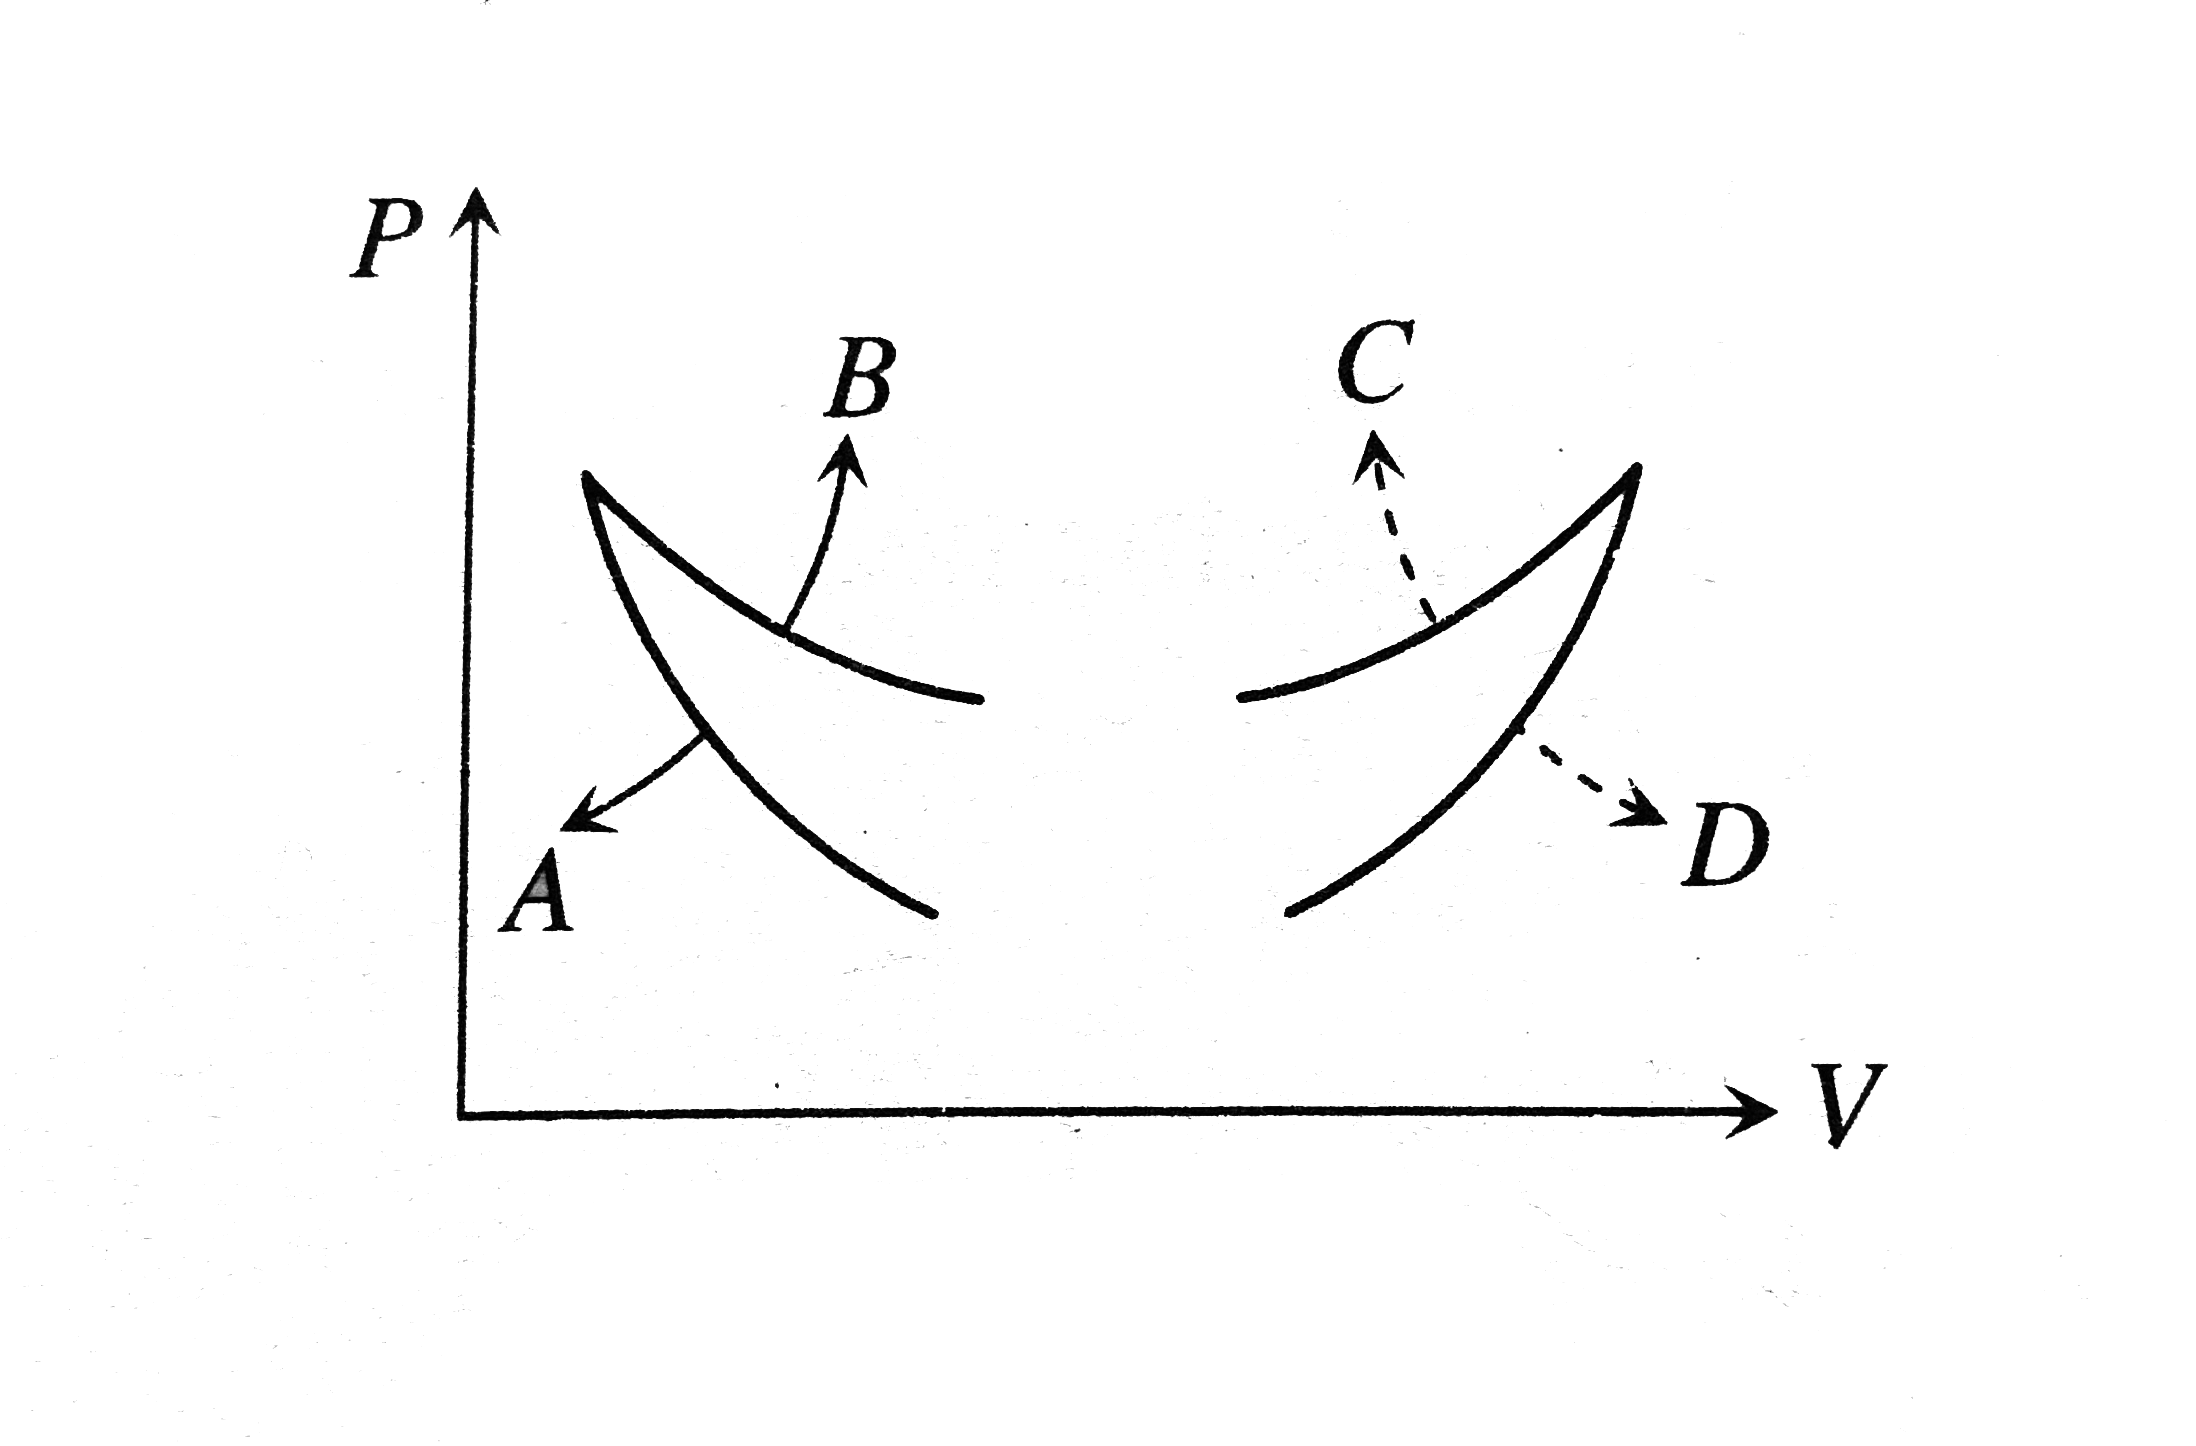
View SolutionFour curves A,B,C and D are drawn in Fig. for a given amount of gas. The curves which represent adabatic and isothermal changes

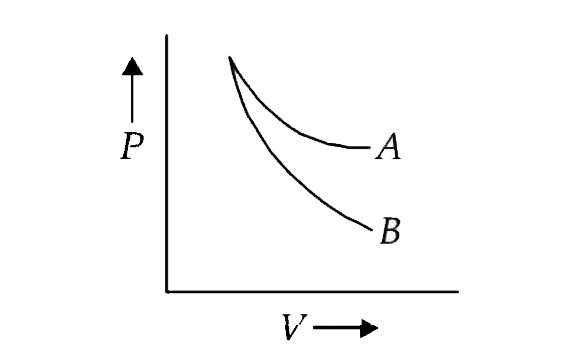
View SolutionThe curves A and B in the figure shown P-V graphs for an isothermal and an adiabatic process for an idea gas. The isothermal process is represented by the curve A.

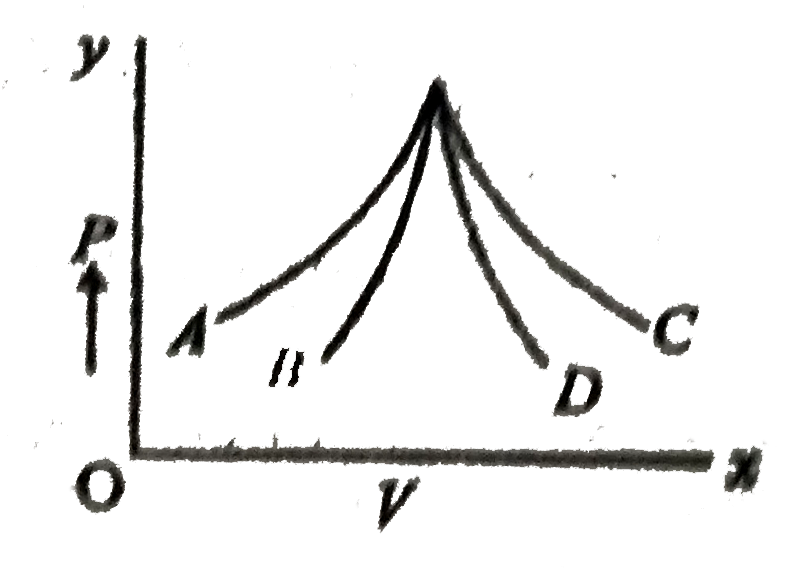
View SolutionFigure shows four PV diagrams. Which of these curves represent isothermal and adiabatic processes?

View SolutionFour curves A, B, C and D are drawn in Fig. for a given amount of gas. The curves which represent adiabatic and isothermal changes
View SolutionThe curves A and B in the figure shown P-V graphs for an isothermal and an adiabatic process for an idea gas. The isothermal process is represented by the curve A.

View SolutionWhich curve in figure represents the curve of ideal gas?

View SolutionFour curves A,B,C and D are drawn in Fig. for a given amount of gas. The curves which represent adiabatic and isothermal changes

View Solution
