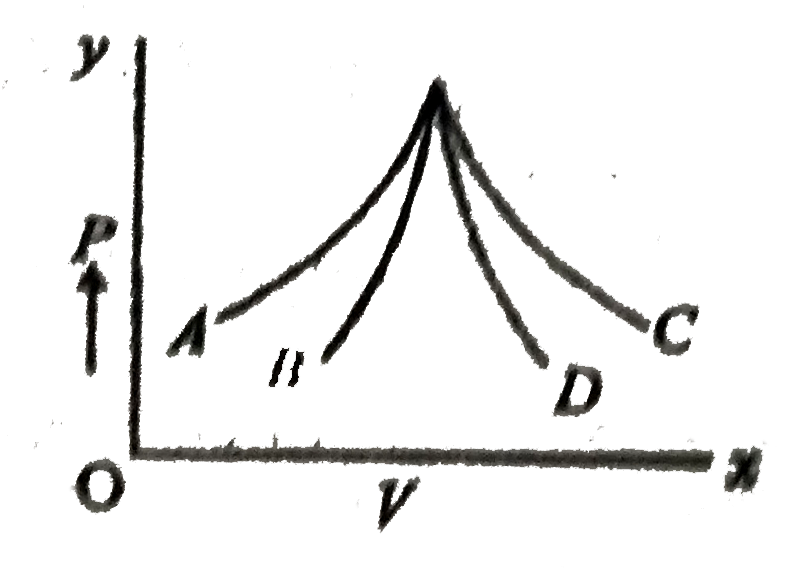
Figure shows four PV diagrams. Which of these curves represent isothermal and adiabatic processes?
A
C and D
B
A and C
C
A and B
D
B and D
Video Solution
Text Solution
The correct Answer is:A
During adiabatic & isothermal curve slope of P-V graph can -not be positive and slope of adiabatic curve is more than slope of isothermal curve.
|
Topper's Solved these Questions
Similar Questions
Knowledge Check
A cyclic process ABCD is shown in the figure P - V diagram. Which of the following curves represent the same process
 A
A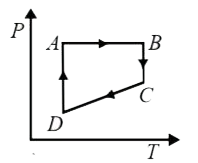 B
B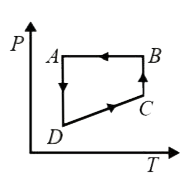 C
C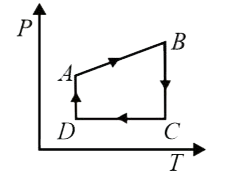 D
D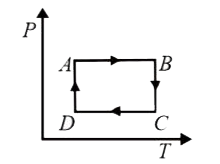
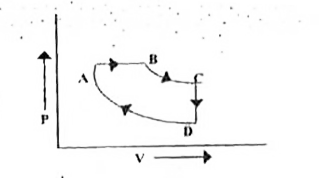
A cyclic process ABCD is shown in the figure P-V diagram. Which of the following curves represent the same process?
 A
A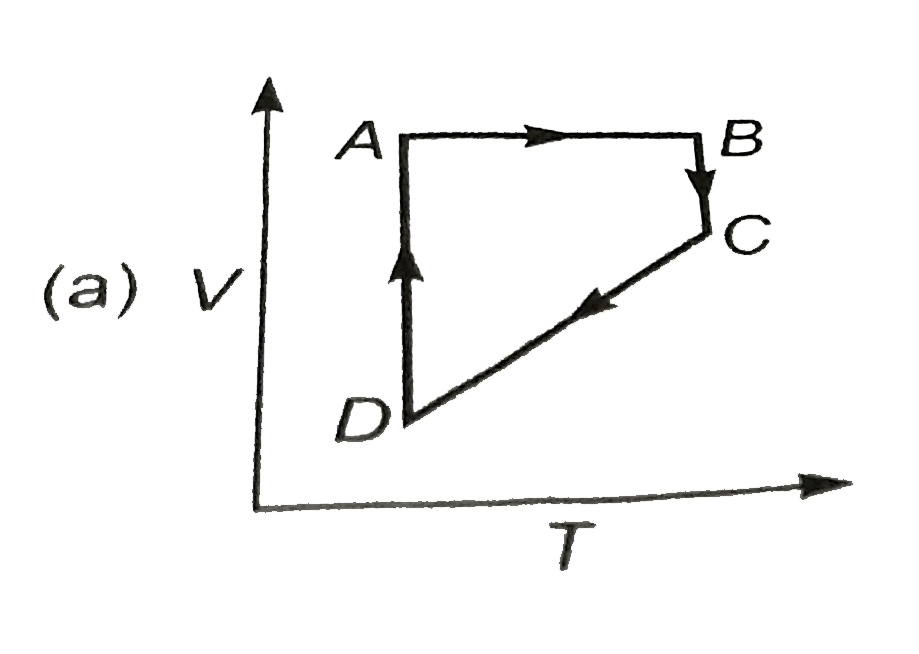 B
B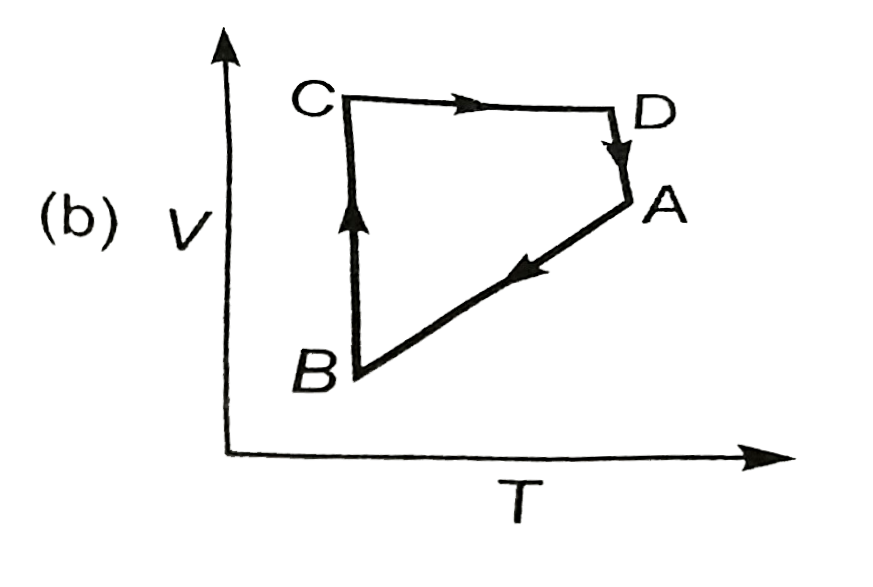 C
C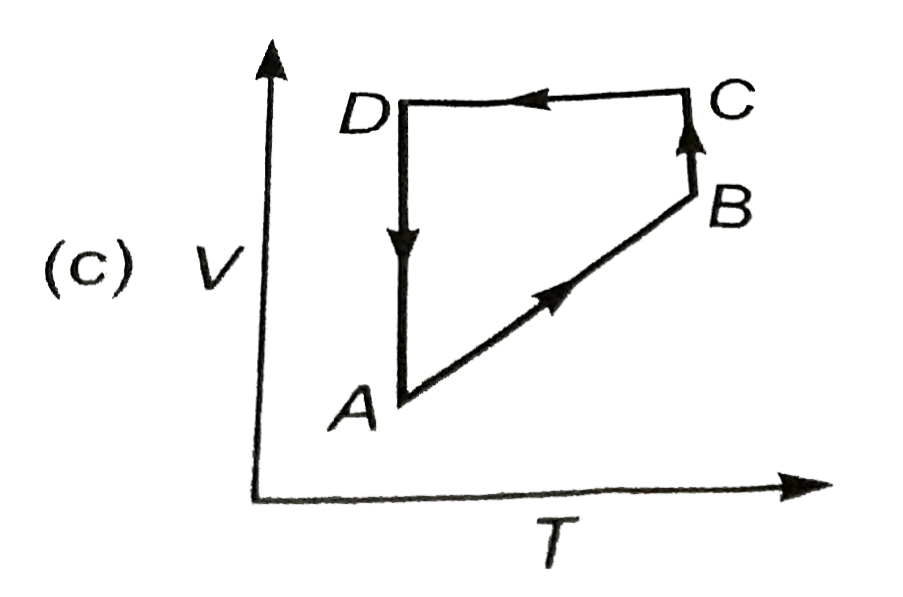 D
D
A cyclic process ABCD is shown in the figure P - V diagram. Which of the following curves represent the same process
 A
A B
B C
C D
D
Analysis OF Isothermal and Adiabatic Process
View SolutionIsothermal Process and Adiabatic Process.
View SolutionComparison Between Isothermal And Adiabatic Process
View SolutionIsothermal and adiabatic process are identical.
View SolutionWhich of the following P-V curve best represents. As isothermal process?
View Solution

