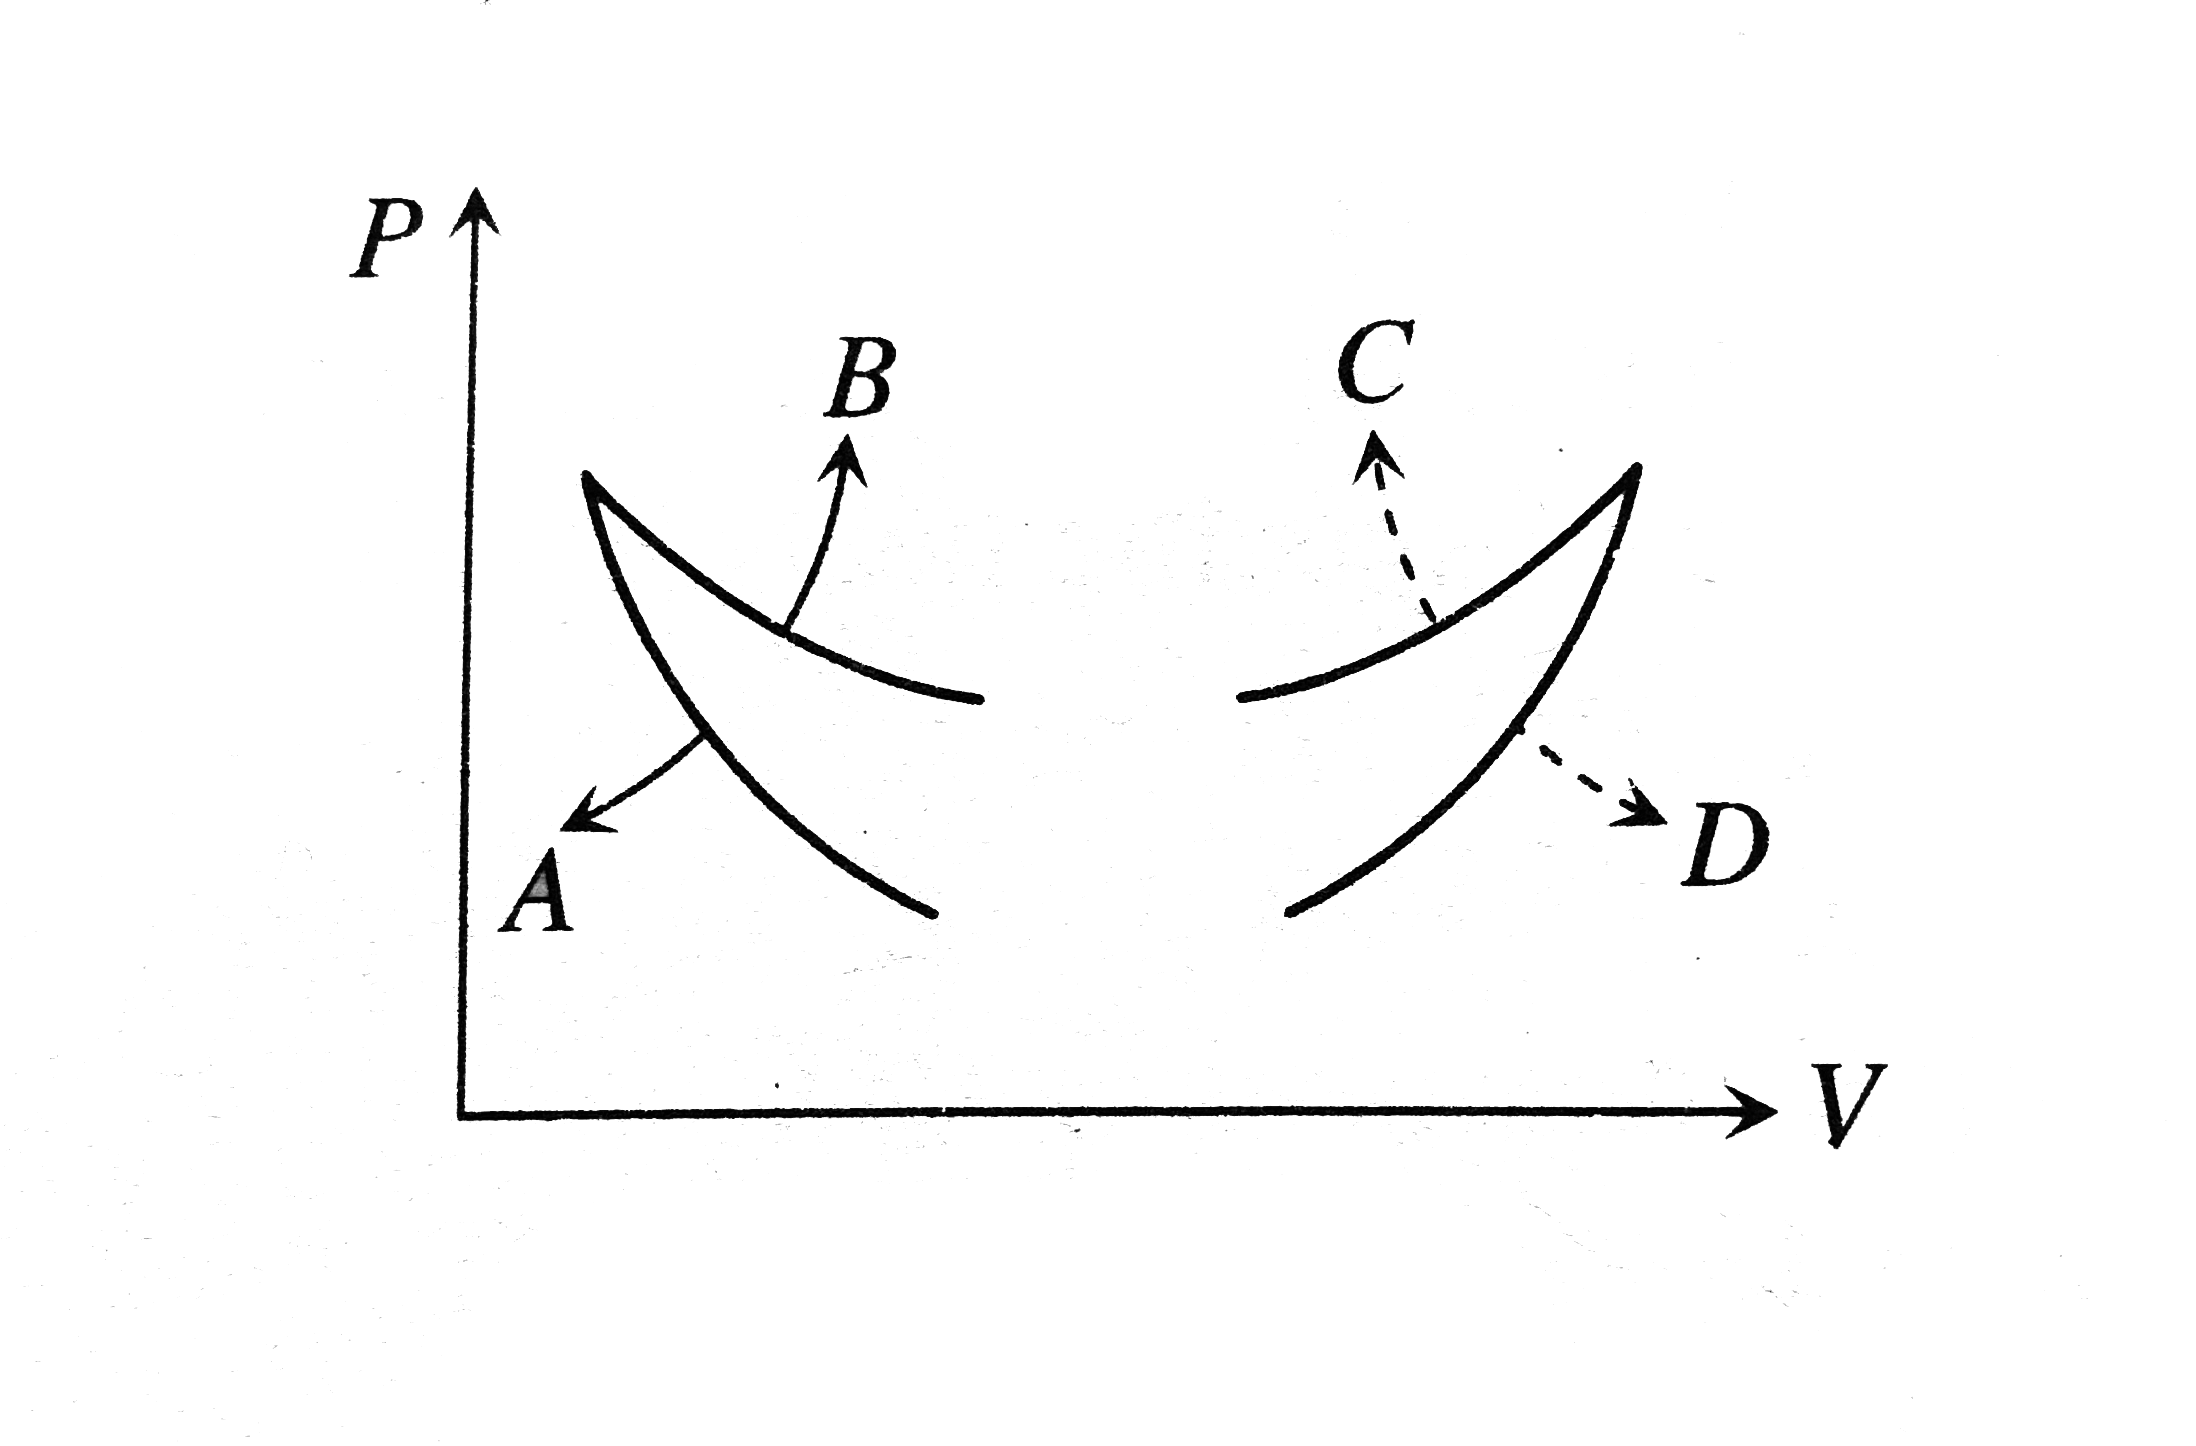
Four curves A,B,C and D are drawn in Fig. for a given amount of gas. The curves which represent adabatic and isothermal changes
C and D, respectively
D andC, respectively
A and B, respectively
B and A, respectively
The correct Answer is:C
c. As we know that slopesof isothermal and adiabatic curves are always negative and slopes of adiabatic curve is always greater than of isothermal curve, in the given graph curves A and B represent adiabatic and isothermal changes, resspectively.
Topper's Solved these Questions
- KINETIC THEORY OF GASES AND FIRST LAW OF THERMODYNAMICSBOOK - CENGAGE PHYSICS ENGLISHCHAPTER - KINETIC THEORY OF GASES AND FIRST LAW OF THERMODYNAMICSEXERCISE - Multiple Corrects
29 Videos
- KINETIC THEORY OF GASES AND FIRST LAW OF THERMODYNAMICSBOOK - CENGAGE PHYSICS ENGLISHCHAPTER - KINETIC THEORY OF GASES AND FIRST LAW OF THERMODYNAMICSEXERCISE - Assertion-Reasoning
6 Videos
- KINETIC THEORY OF GASES AND FIRST LAW OF THERMODYNAMICSBOOK - CENGAGE PHYSICS ENGLISHCHAPTER - KINETIC THEORY OF GASES AND FIRST LAW OF THERMODYNAMICSEXERCISE - Subjective
22 Videos
- KINETIC THEORY OF GASESBOOK - CENGAGE PHYSICS ENGLISHCHAPTER - KINETIC THEORY OF GASESEXERCISE - Compression
2 Videos
- LINEAR AND ANGULAR SIMPLE HARMONIC MOTIONBOOK - CENGAGE PHYSICS ENGLISHCHAPTER - LINEAR AND ANGULAR SIMPLE HARMONIC MOTIONEXERCISE - Single correct anwer type
14 Videos
Similar Questions
Four curves A,B,C and D are drawn in Fig. for a given amount of gas. The curves which represent adiabatic and isothermal changes

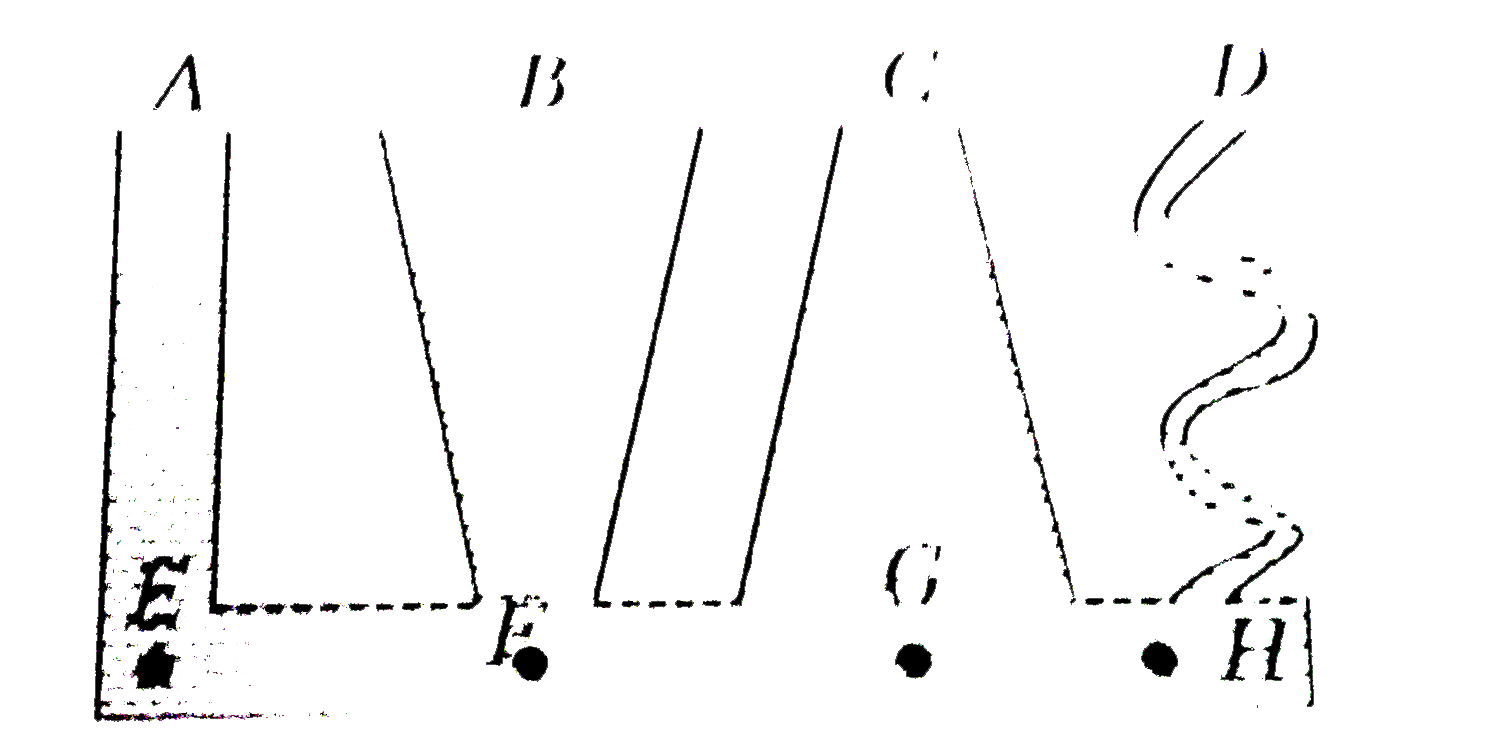
View SolutionFour vessels A, B, C and D have different shapes and hold different amount of water. Which of the following is correct.
View SolutionWhich curve in figure represents the curve of ideal gas ?
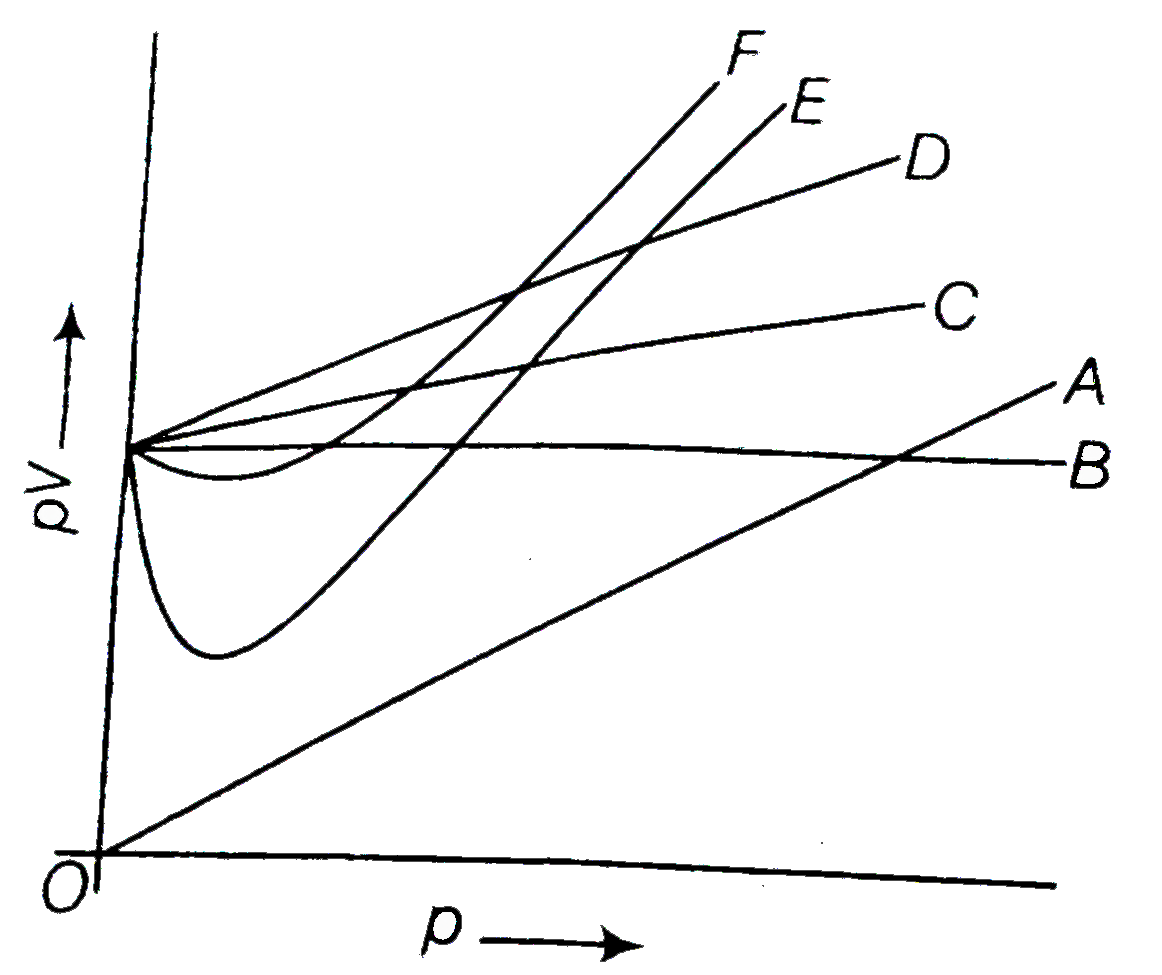
View SolutionWhich curve in figure represents the curve of ideal gas ?

View SolutionWhich of the following P-V curve best represents. As isothermal process?
View SolutionFigure shows four PV diagrams. Which of these curves represent isothermal and adiabatic processes?
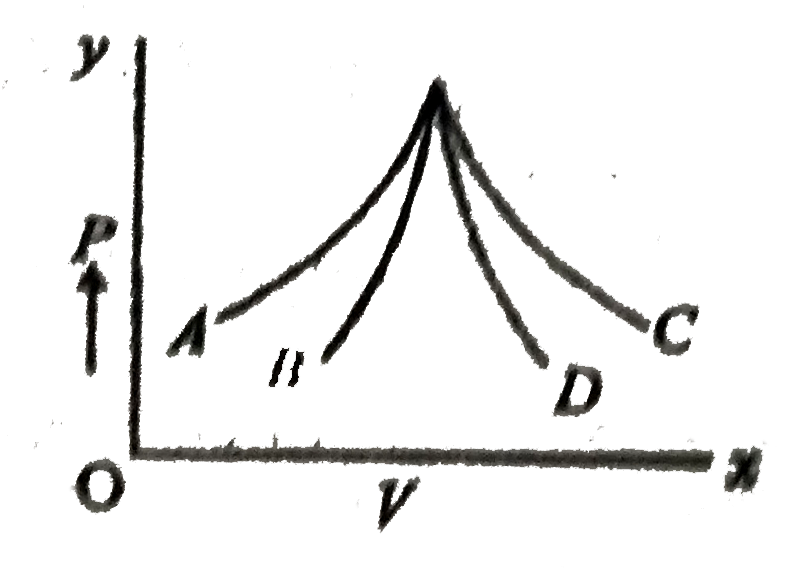
View SolutionThe curves A and B in the figure shown P-V graphs for an isothermal and an adiabatic process for an idea gas. The isothermal process is represented by the curve A.
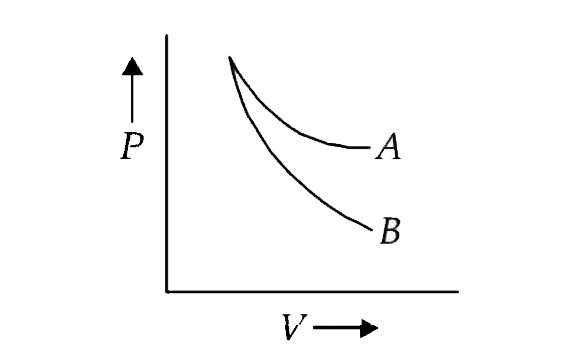
View SolutionThe curves A and B in the figure shown P-V graphs for an isothermal and an adiabatic process for an idea gas. The isothermal process is represented by the curve A.

View SolutionStatement-1: Temperature of a system can be increased without supplying heat.
Statement-2: If the initial volume of system is equal to final volume in a process then work done is necessarily zero.
Statement-3: If an adiabatic curve for a gas intersect with an isothermal curve for the same gas then at the point of intersection, the ratio of slope of the adiabatic and the isothermal curve is γ.
View SolutionWhich curve does not represent Boyl's law ?
View Solution
