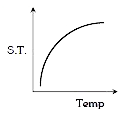
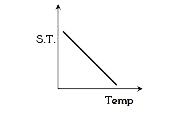
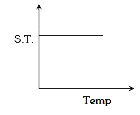
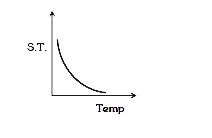
Which graph represents the variation of surface tension with temperature over small temperature ranges for water?


The correct Answer is:B
Sc=S0(1−αt)⇒t↑⏐S⏐↓
Similar Questions
The surface tension of water at critical temperature is …….
View SolutionThe correct graph between surface tension T and temperature q in low temperature range is
View SolutionWhich of the following graph shows the variation of surface tension with temperature over small temperature ranges for water?
View SolutionThe correct graph betweenn surface tension T and temperature theta is low temperature range is
View SolutionWhich graph represents the variation of surface tension with temperature over small temperature ranges for water?
View Solutionनिम्न में से कौन सा ग्राफ जल के लिए तापमान की छोटी परासों पर तापमान के साथ पृष्ठ तनाव में परिवर्तन (Variation) को दर्शाता है?
View SolutionThe graph which represents the variation of mean kinetic energy of moleules with temperature ∘C is ?
View SolutionDraw a graph to show the variation in density of water with temperature in the temperature range from 0^(@)C to 10^(@)C .
View Solution