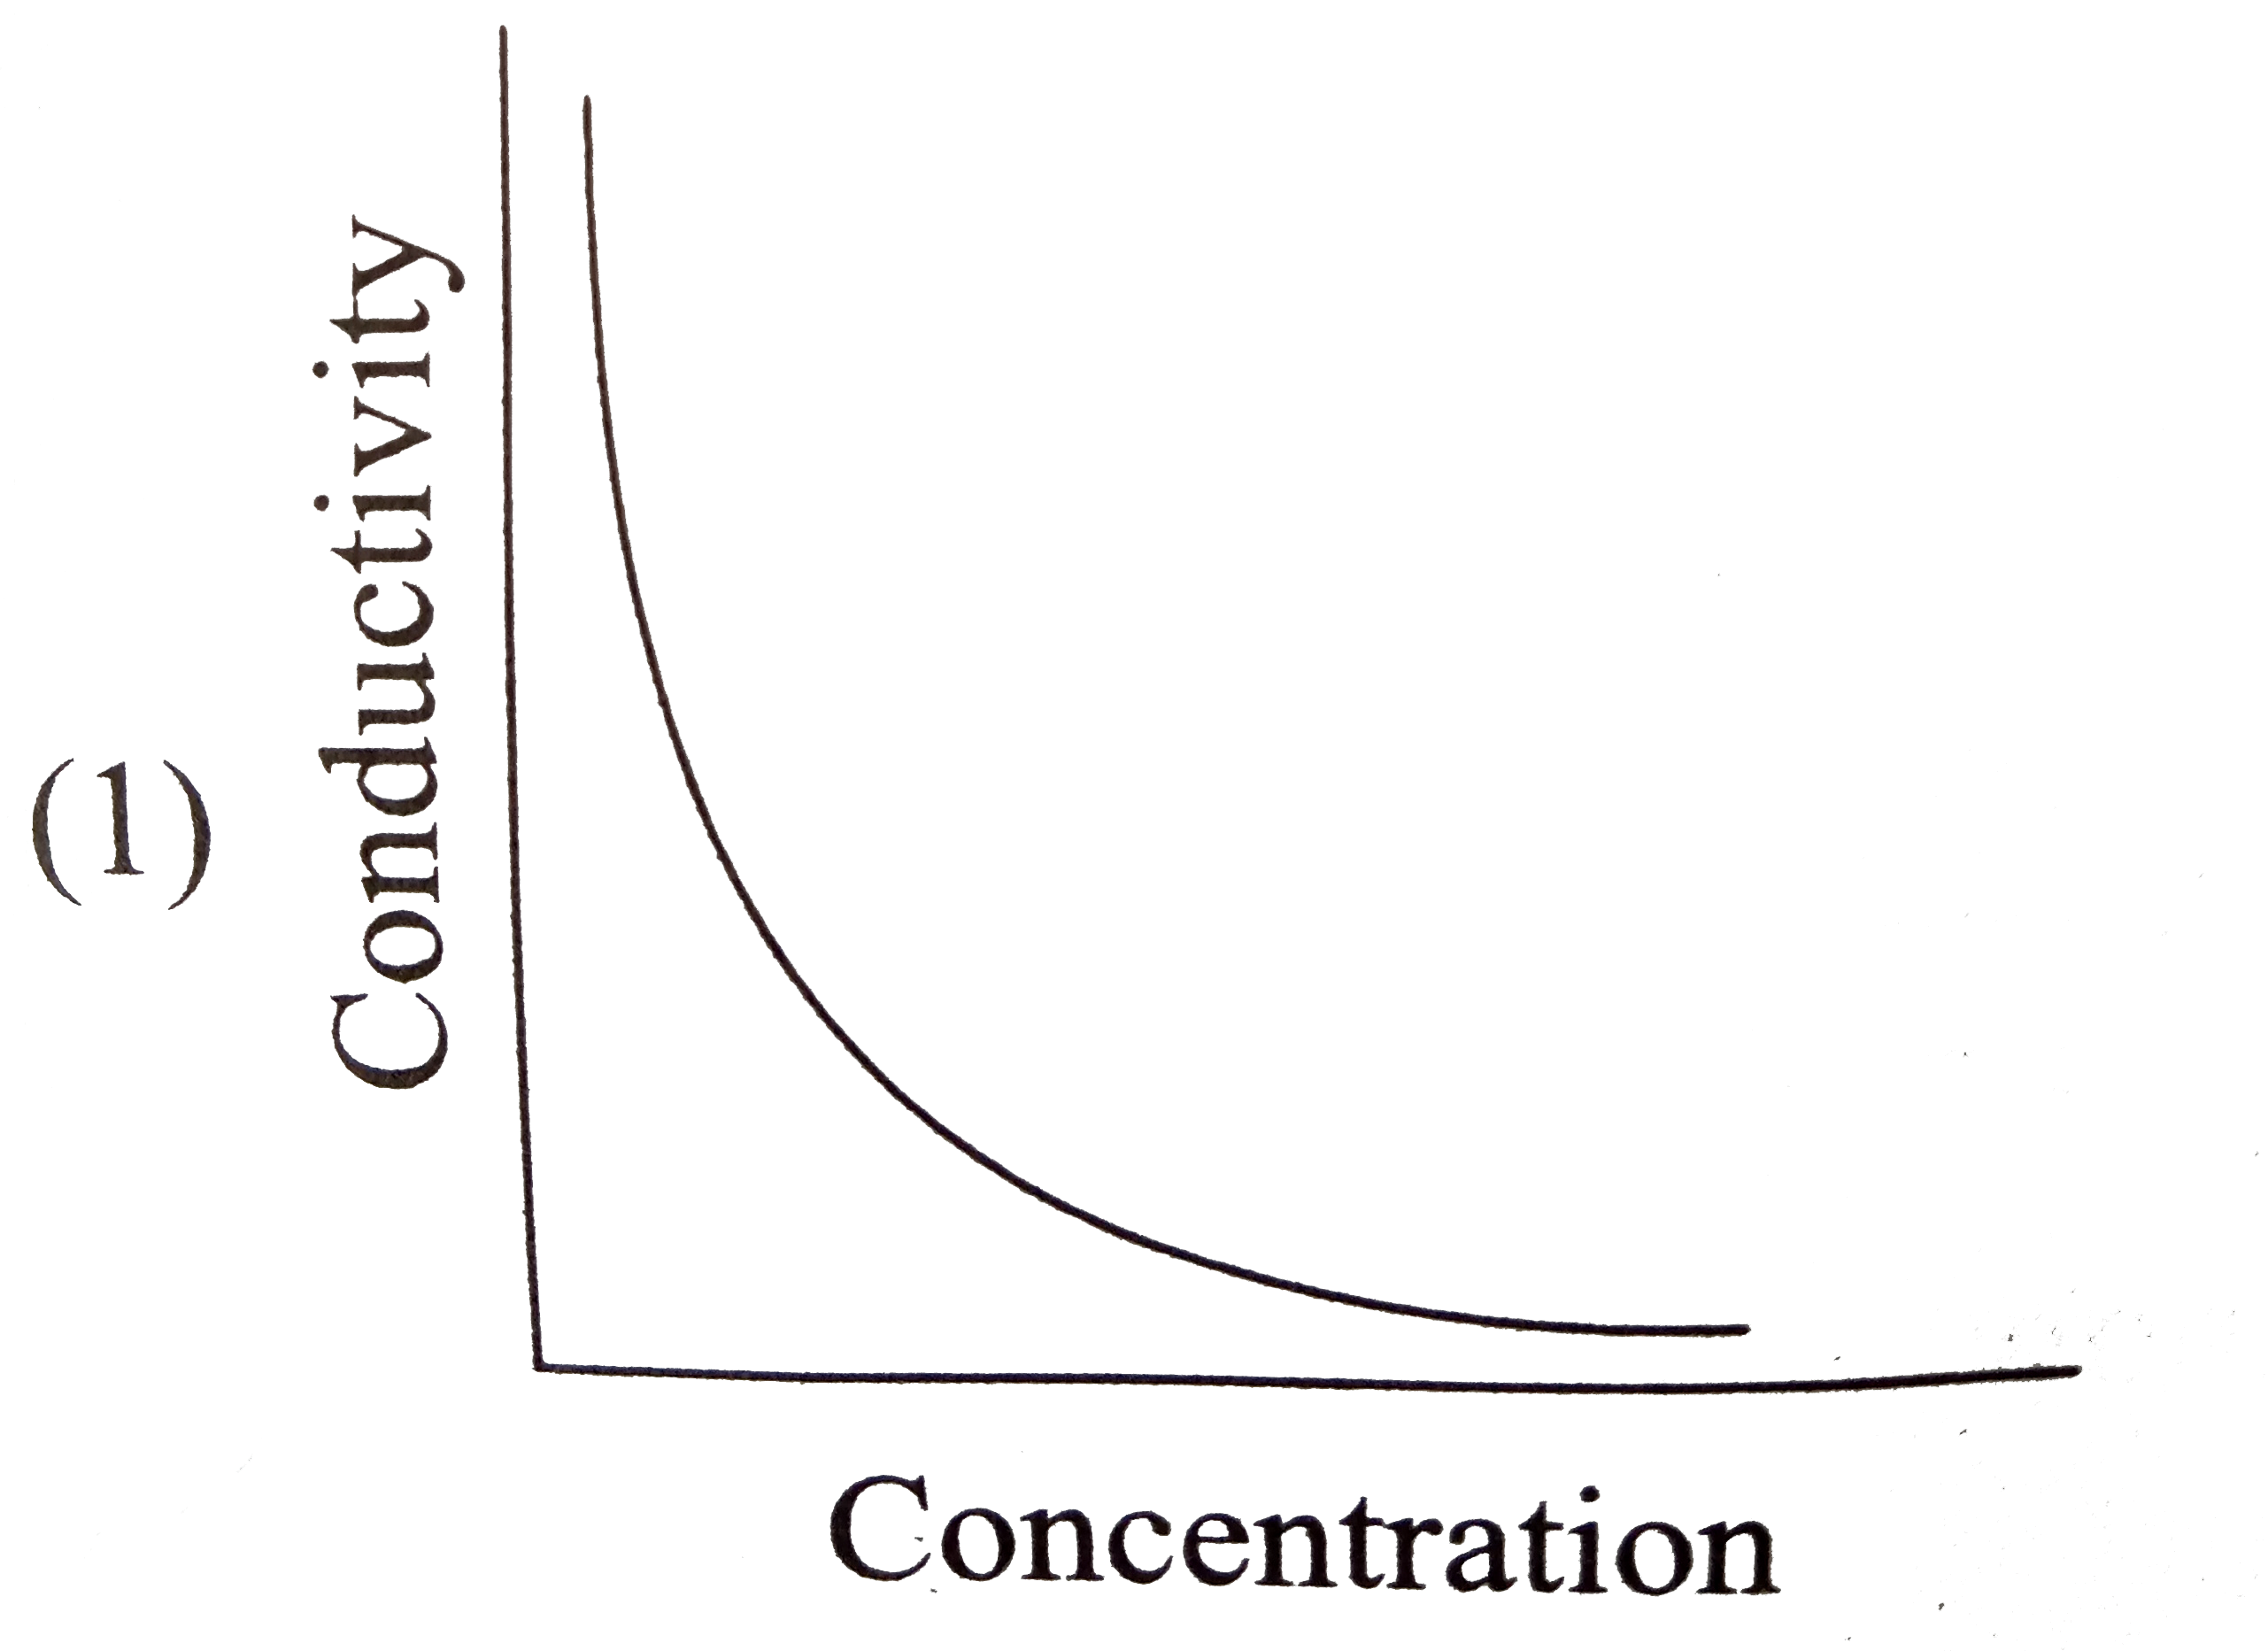
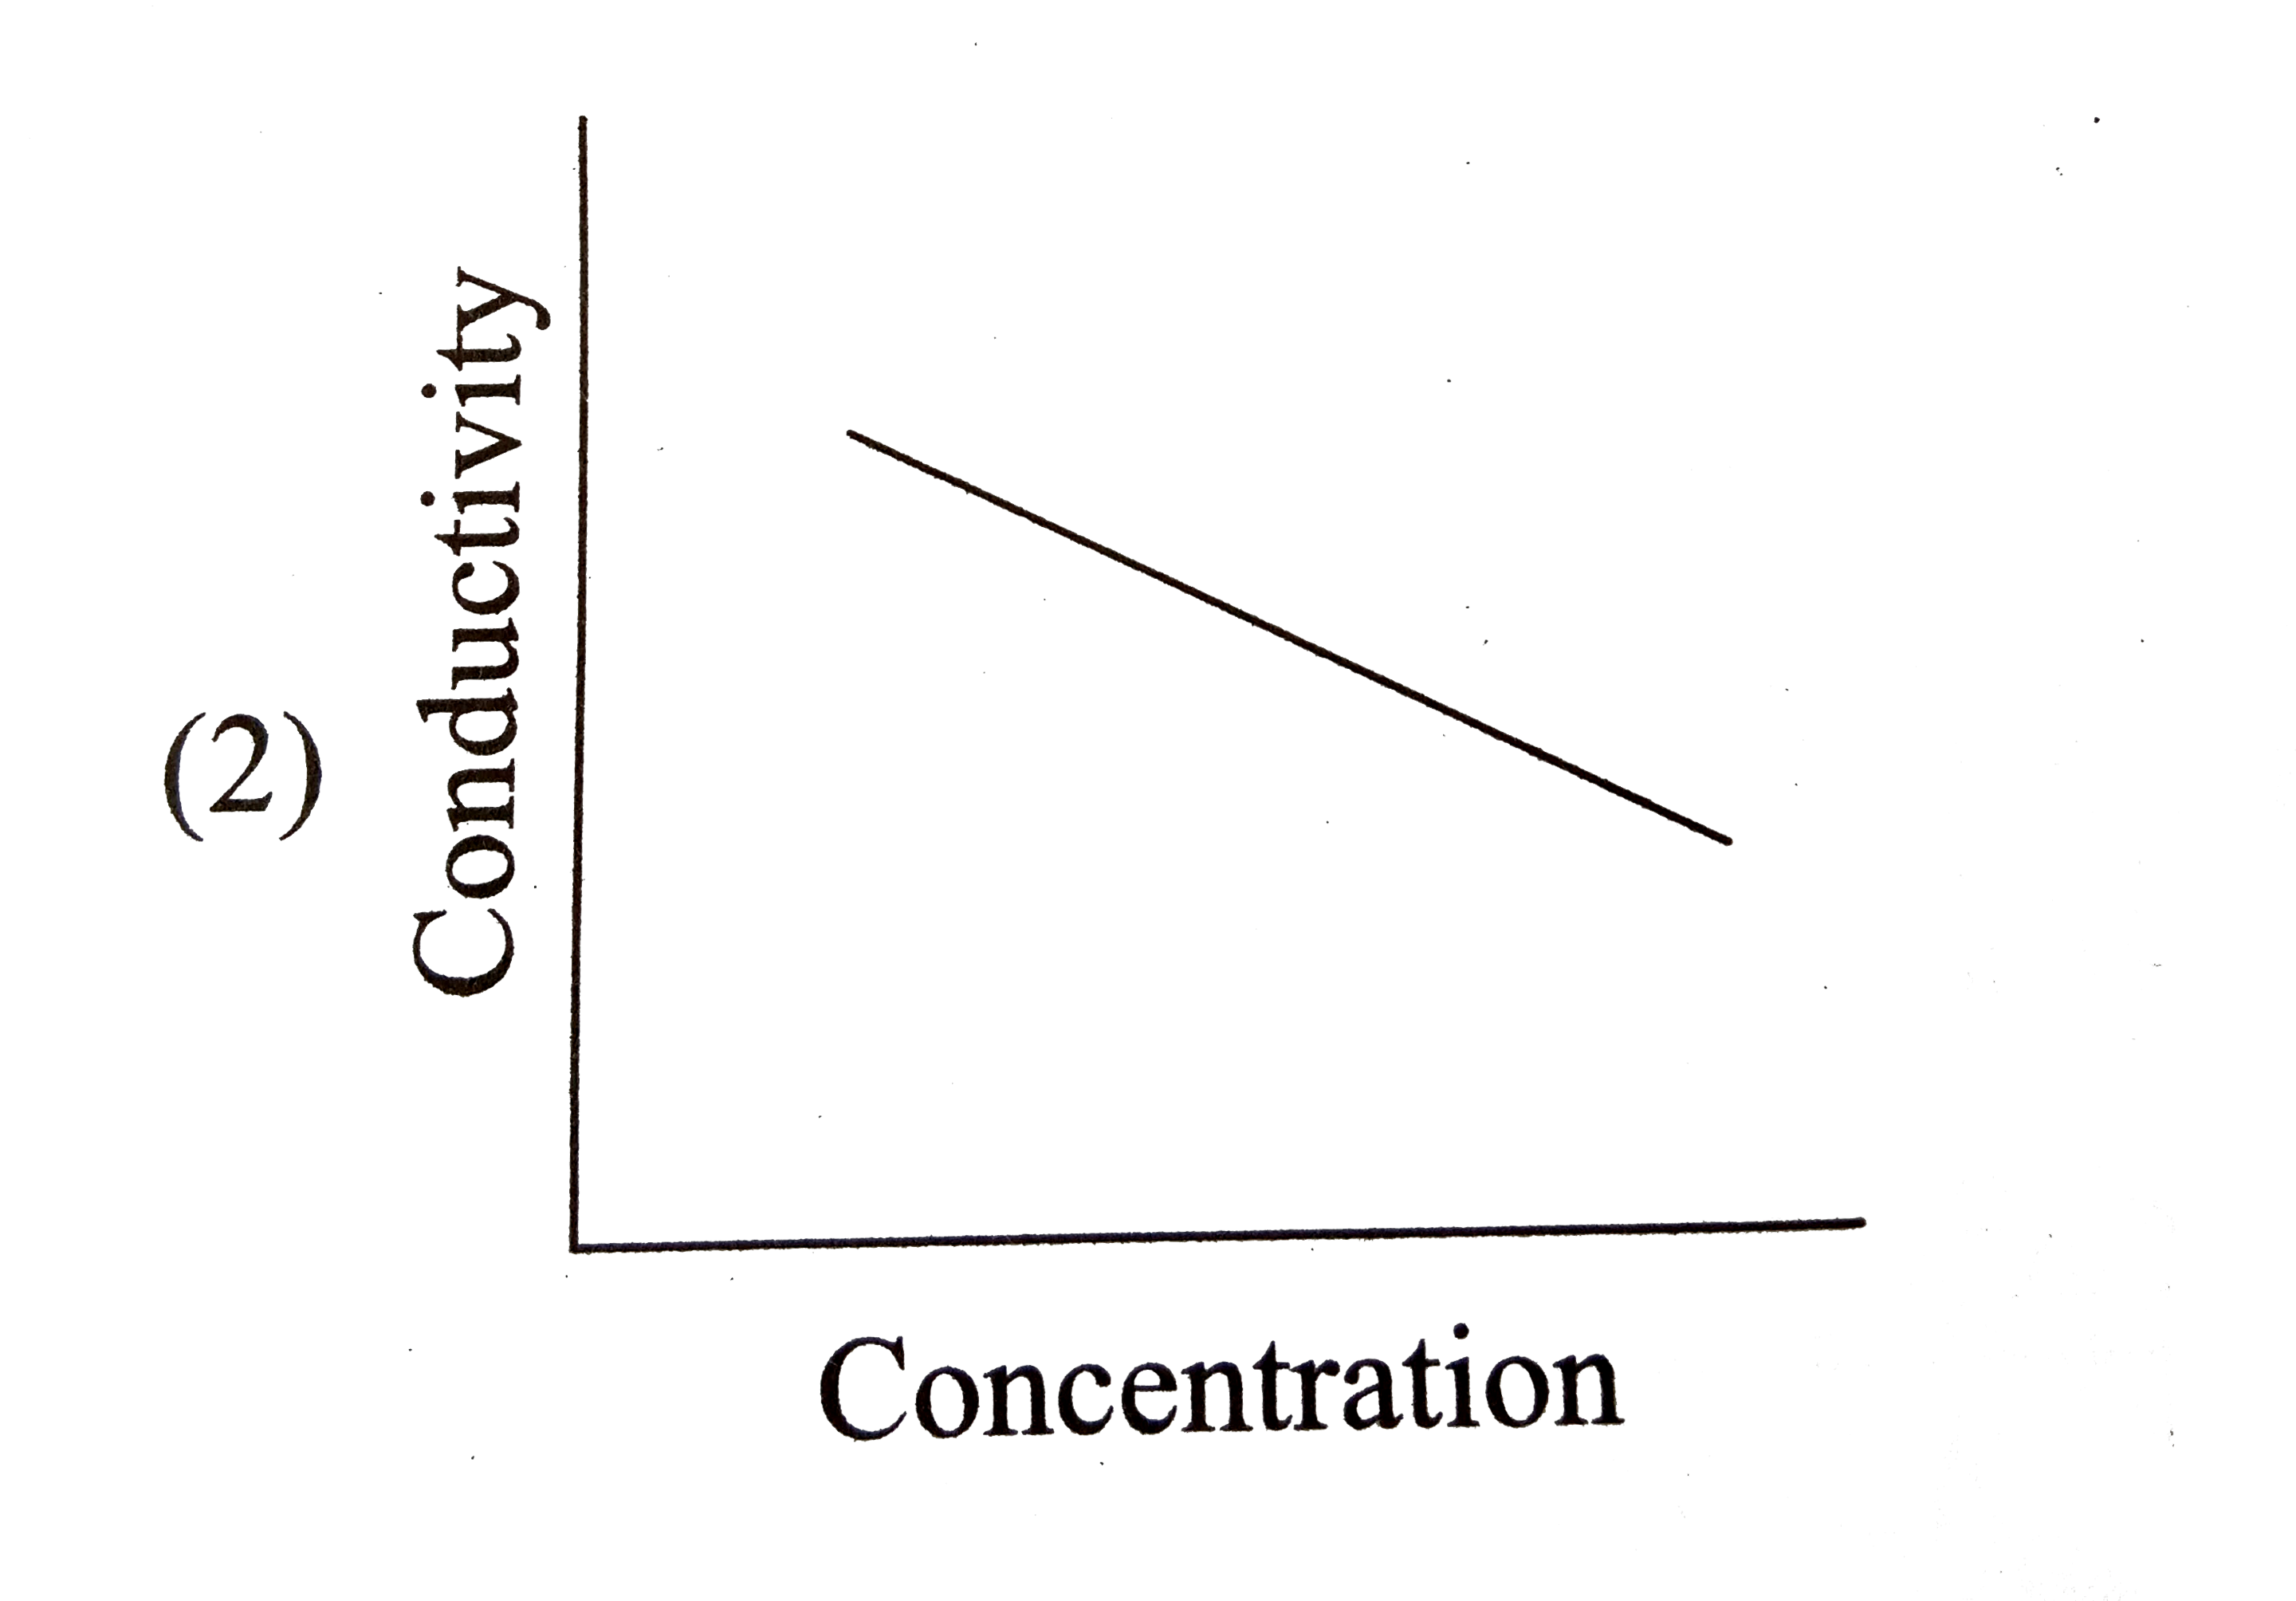
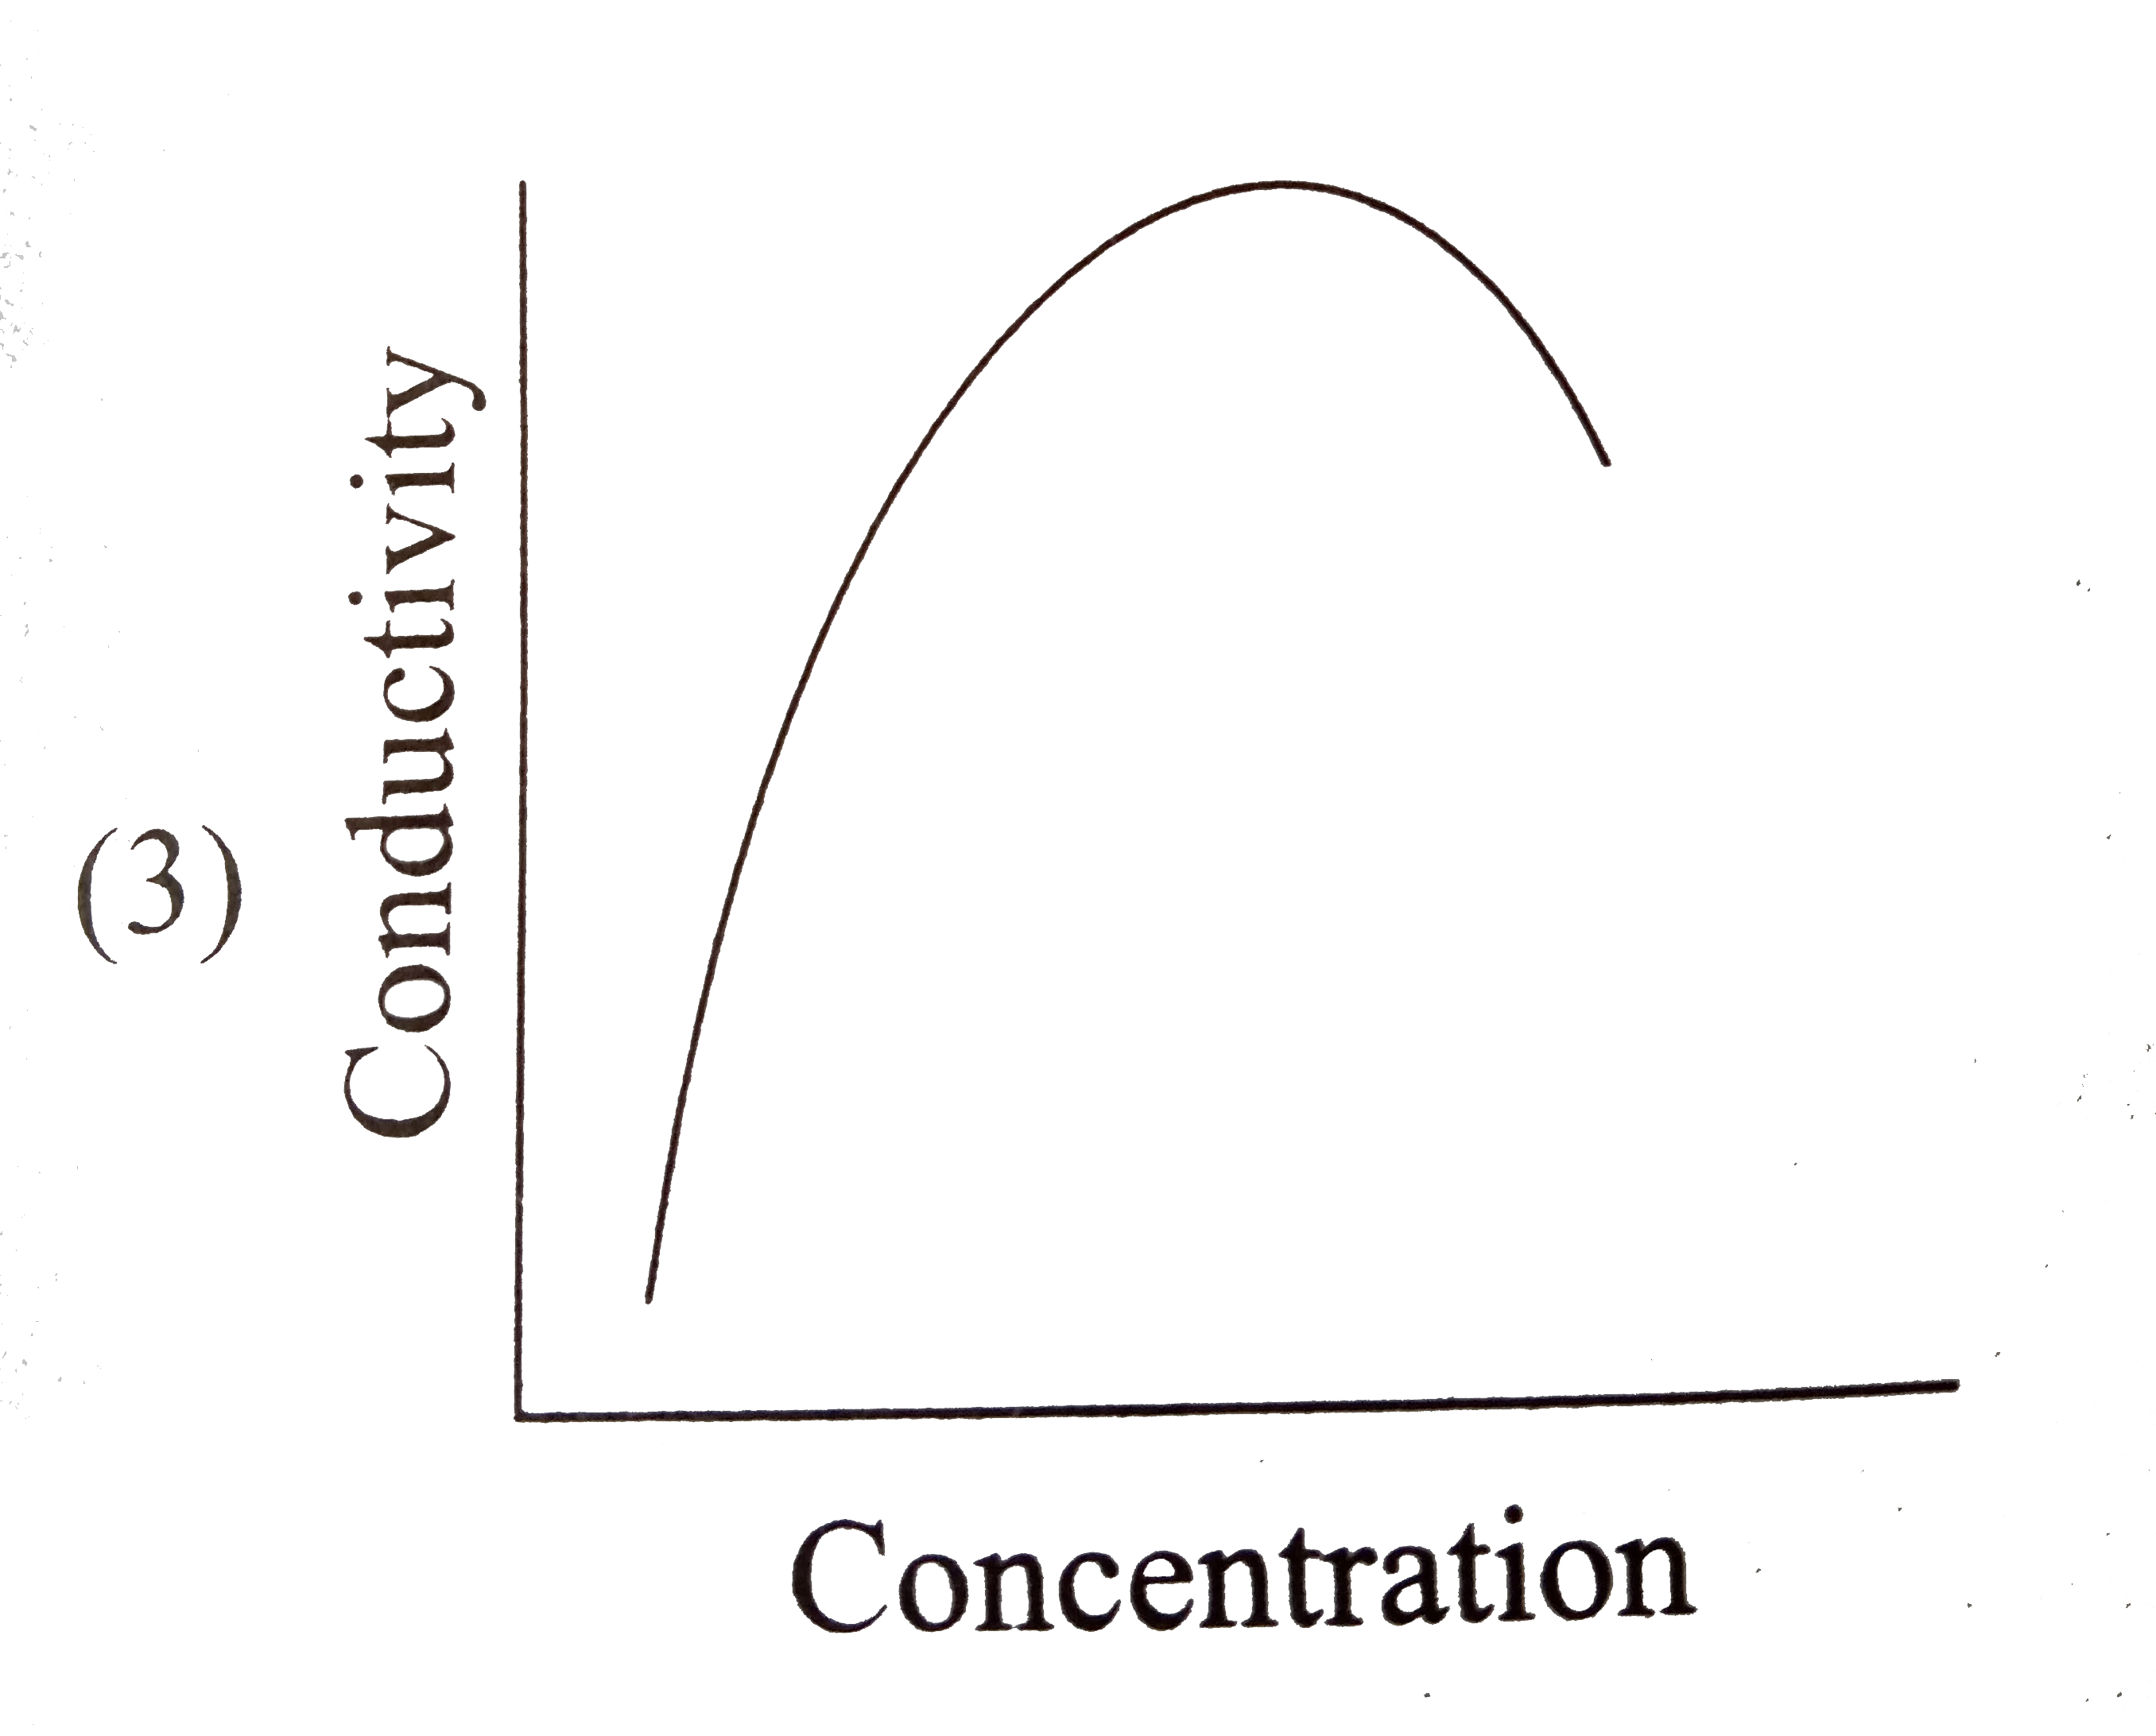
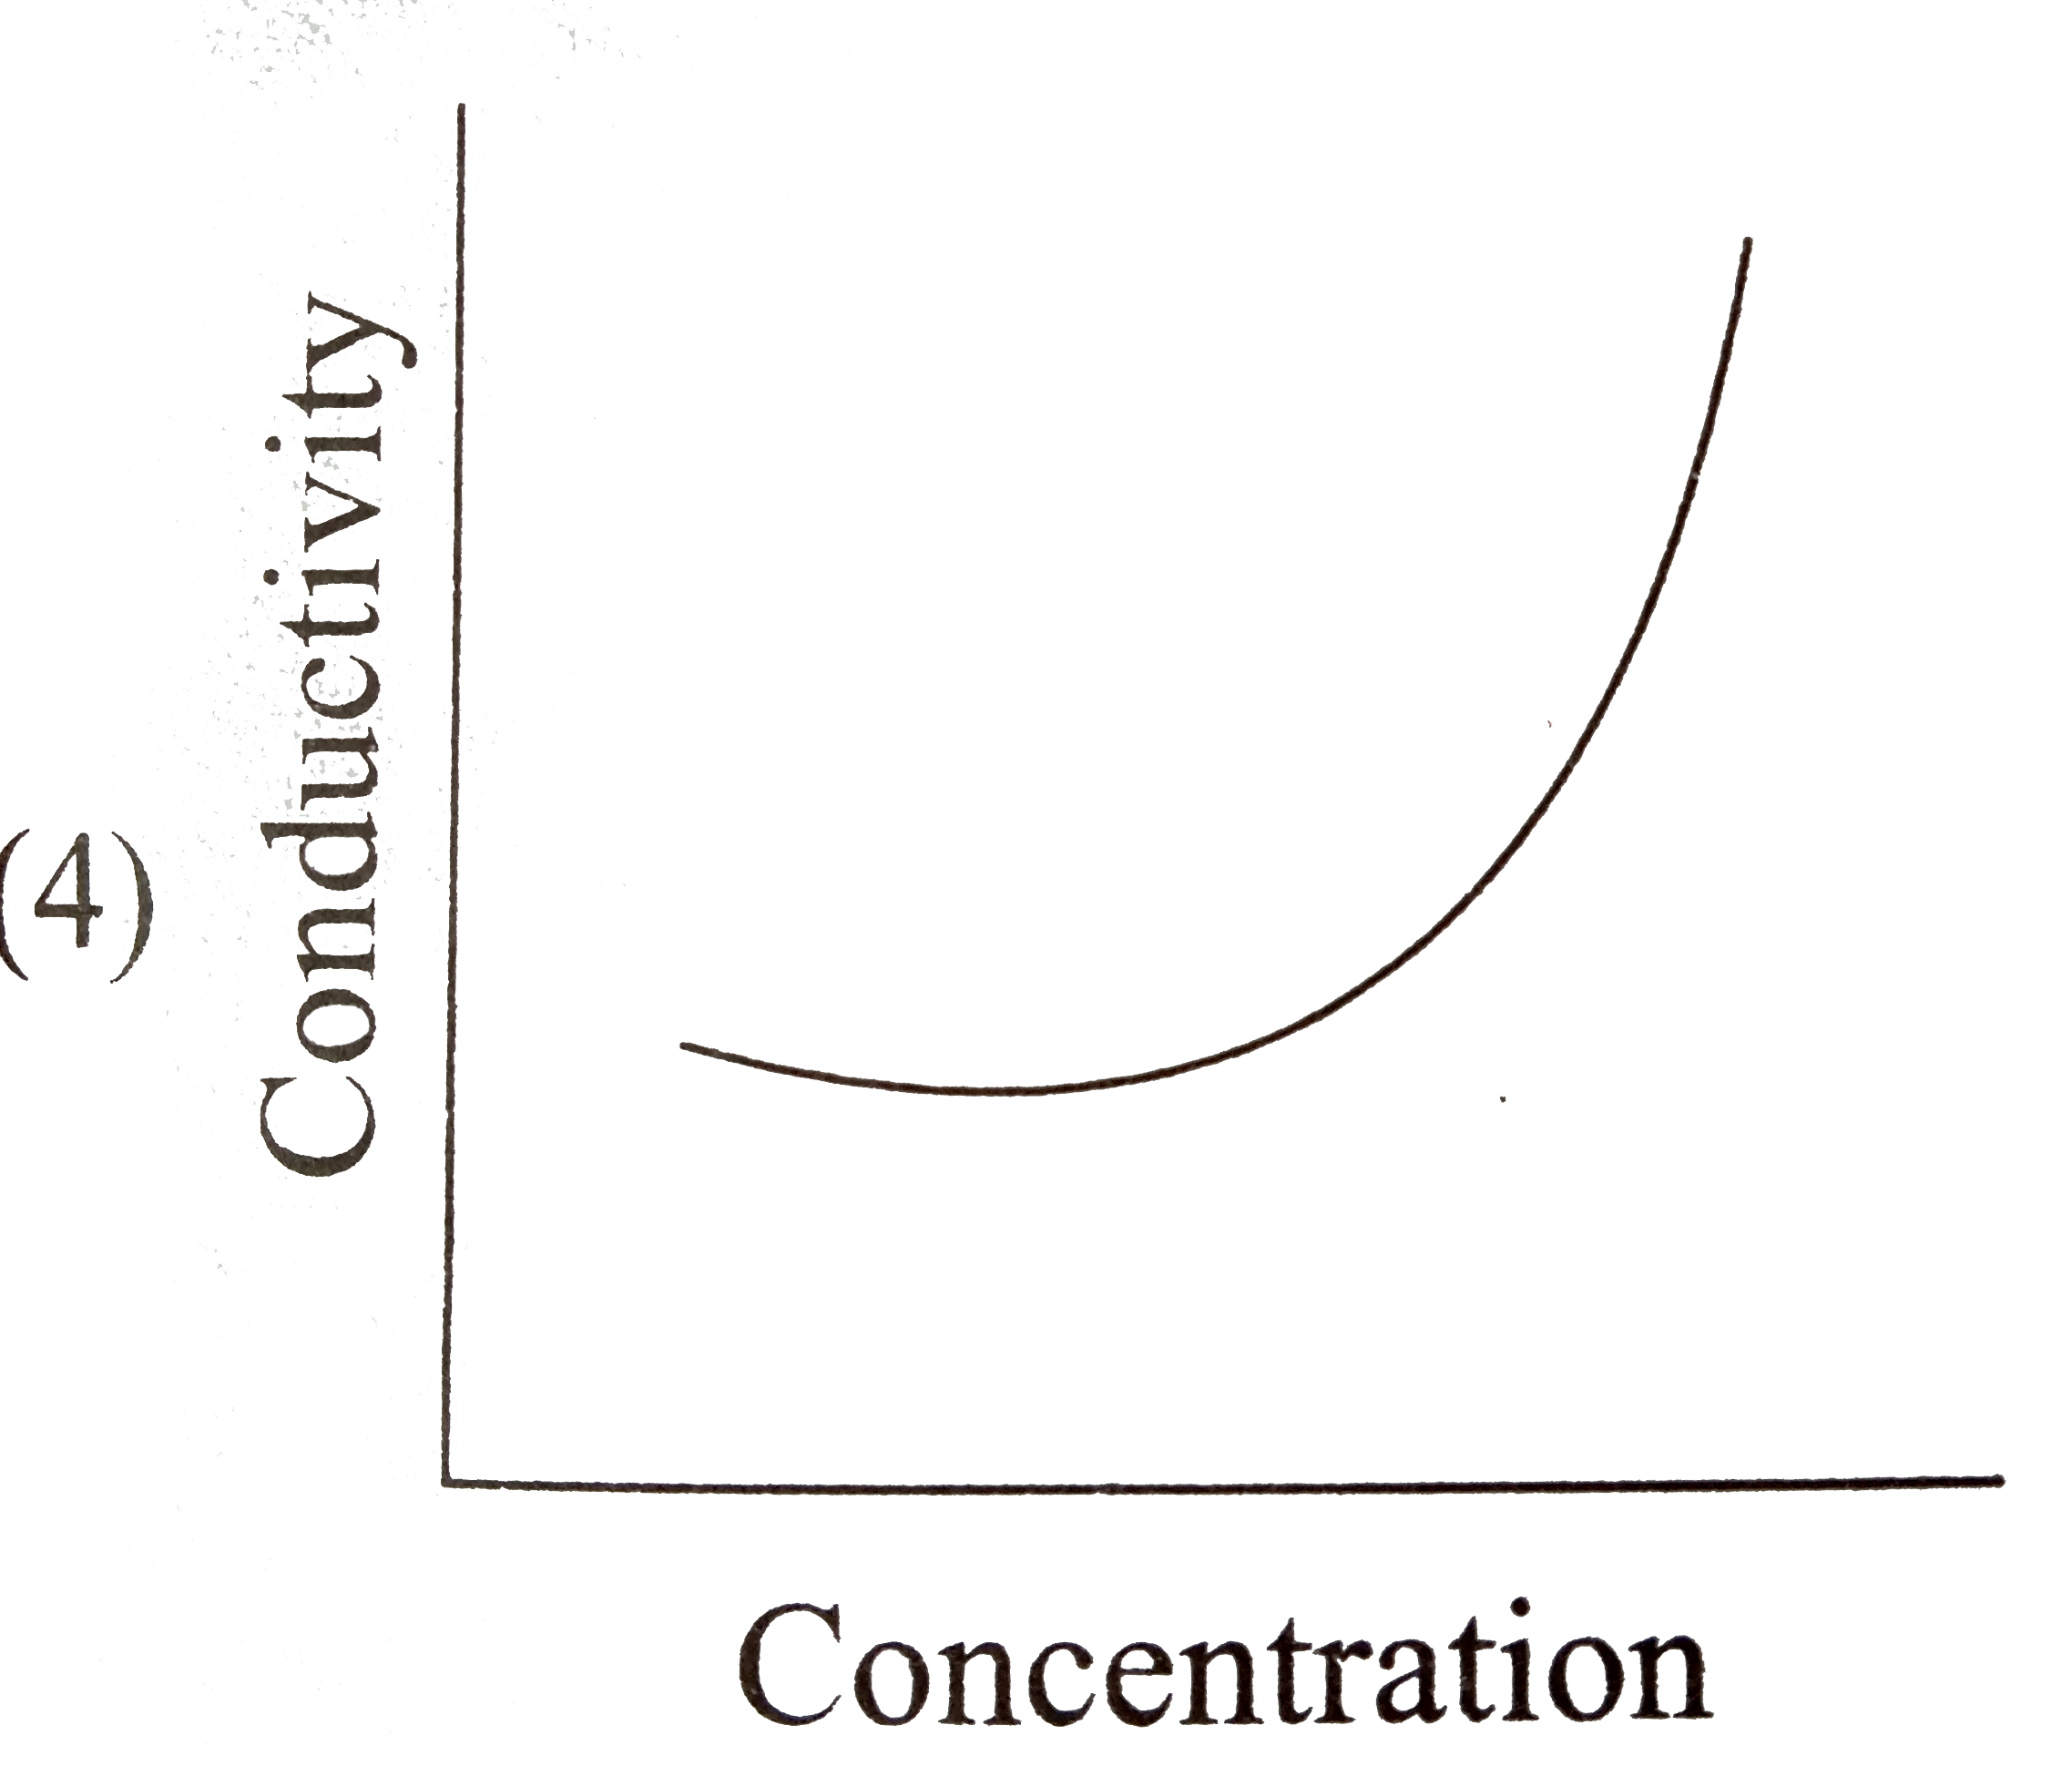
Which one of the following represents correctly the variations of surface tension with temperature θ ?
T∝θ
T∝θ−1
T∝θ2
T∝θ−2
The correct Answer is:B
Step by step video, text & image solution for Which one of the following represents correctly the variations of surface tension with temperature theta ? by Physics experts to help you in doubts & scoring excellent marks in Class 12 exams.
Updated on:21/07/2023Topper's Solved these Questions
- SURFACE TENSIONBook:NIKITA PUBLICATIONChapter:SURFACE TENSIONExercise:Multiple Choice Questions (Shape of liquid drop)
Explore 13 Videos
- SURFACE TENSIONBook:NIKITA PUBLICATIONChapter:SURFACE TENSIONExercise:Multiple Choice Questions (Capillarity and capillary action )
Explore 32 Videos
- SURFACE TENSIONBook:NIKITA PUBLICATIONChapter:SURFACE TENSIONExercise:Multiple Choice Questions (Surface energy and surface tension )
Explore 68 Videos
- STATIONARY WAVES Book:NIKITA PUBLICATIONChapter:STATIONARY WAVES Exercise:MCQs
Explore 396 Videos
- WAVE MOTIONBook:NIKITA PUBLICATIONChapter:WAVE MOTIONExercise:Multiple Choice Questions
Explore 364 Videos
Similar Questions
Which one of the following given graphs represents the variation of rate constant (k) with temperature (t) for an endothermic reaction ?
View SolutionWhich one of the following given graphs represents the variation of rate constant (k) with temperature (f) for an endothermic reaction ?
View Solution
Knowledge Check
Which one of the following graphs represents the variation of surface tension of water with temperture for a small range of temperature ?
A B
B C
C D
D
Which of the following represents correctly the variation of degree of adsorption against temperature for physical adsorption ?
A B
B C
C D
D
Which of the following plots represents correctly the variation of conductivity with concentration?
A B
B C
C D
D
Which one of the following structures is correctly represented.
View Solutionwhich of the following graph represents the variation of resistivity (ρ) with temperature (T) for copper?
View SolutionWhich one of the following correctly represents esterification reaction
View SolutionThe oscillationof a body on a smooth horizontal surface is represented by the equation
x=Acosωt
where x= displacement at time t, ω= frequency of oscillation. Which one of the following graphs shows correctly the variation of acceleration a with time t ?
View SolutionWhich of the following graph is correctly represented?
View Solution

