The velocity (v) and time (t) graph of a body in a straight line motion is shown in the figure . The pointS is at 4.333 seconds .the total distance covered by the body in 6s is
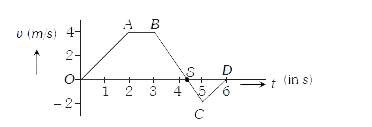
373m
12 m
11 m
494 m
The correct Answer is:A
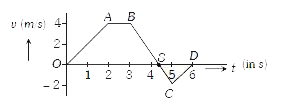
OS=4+13=133
SD=2−13=53
Area of OABS is A1
Area of SCD is A2
Distance = |A1|+|A2|
A1=12[133+1]4=323
A2=12×53×2=53
Distance = |A1|+|A2|
=323+53=373 .
Similar Questions
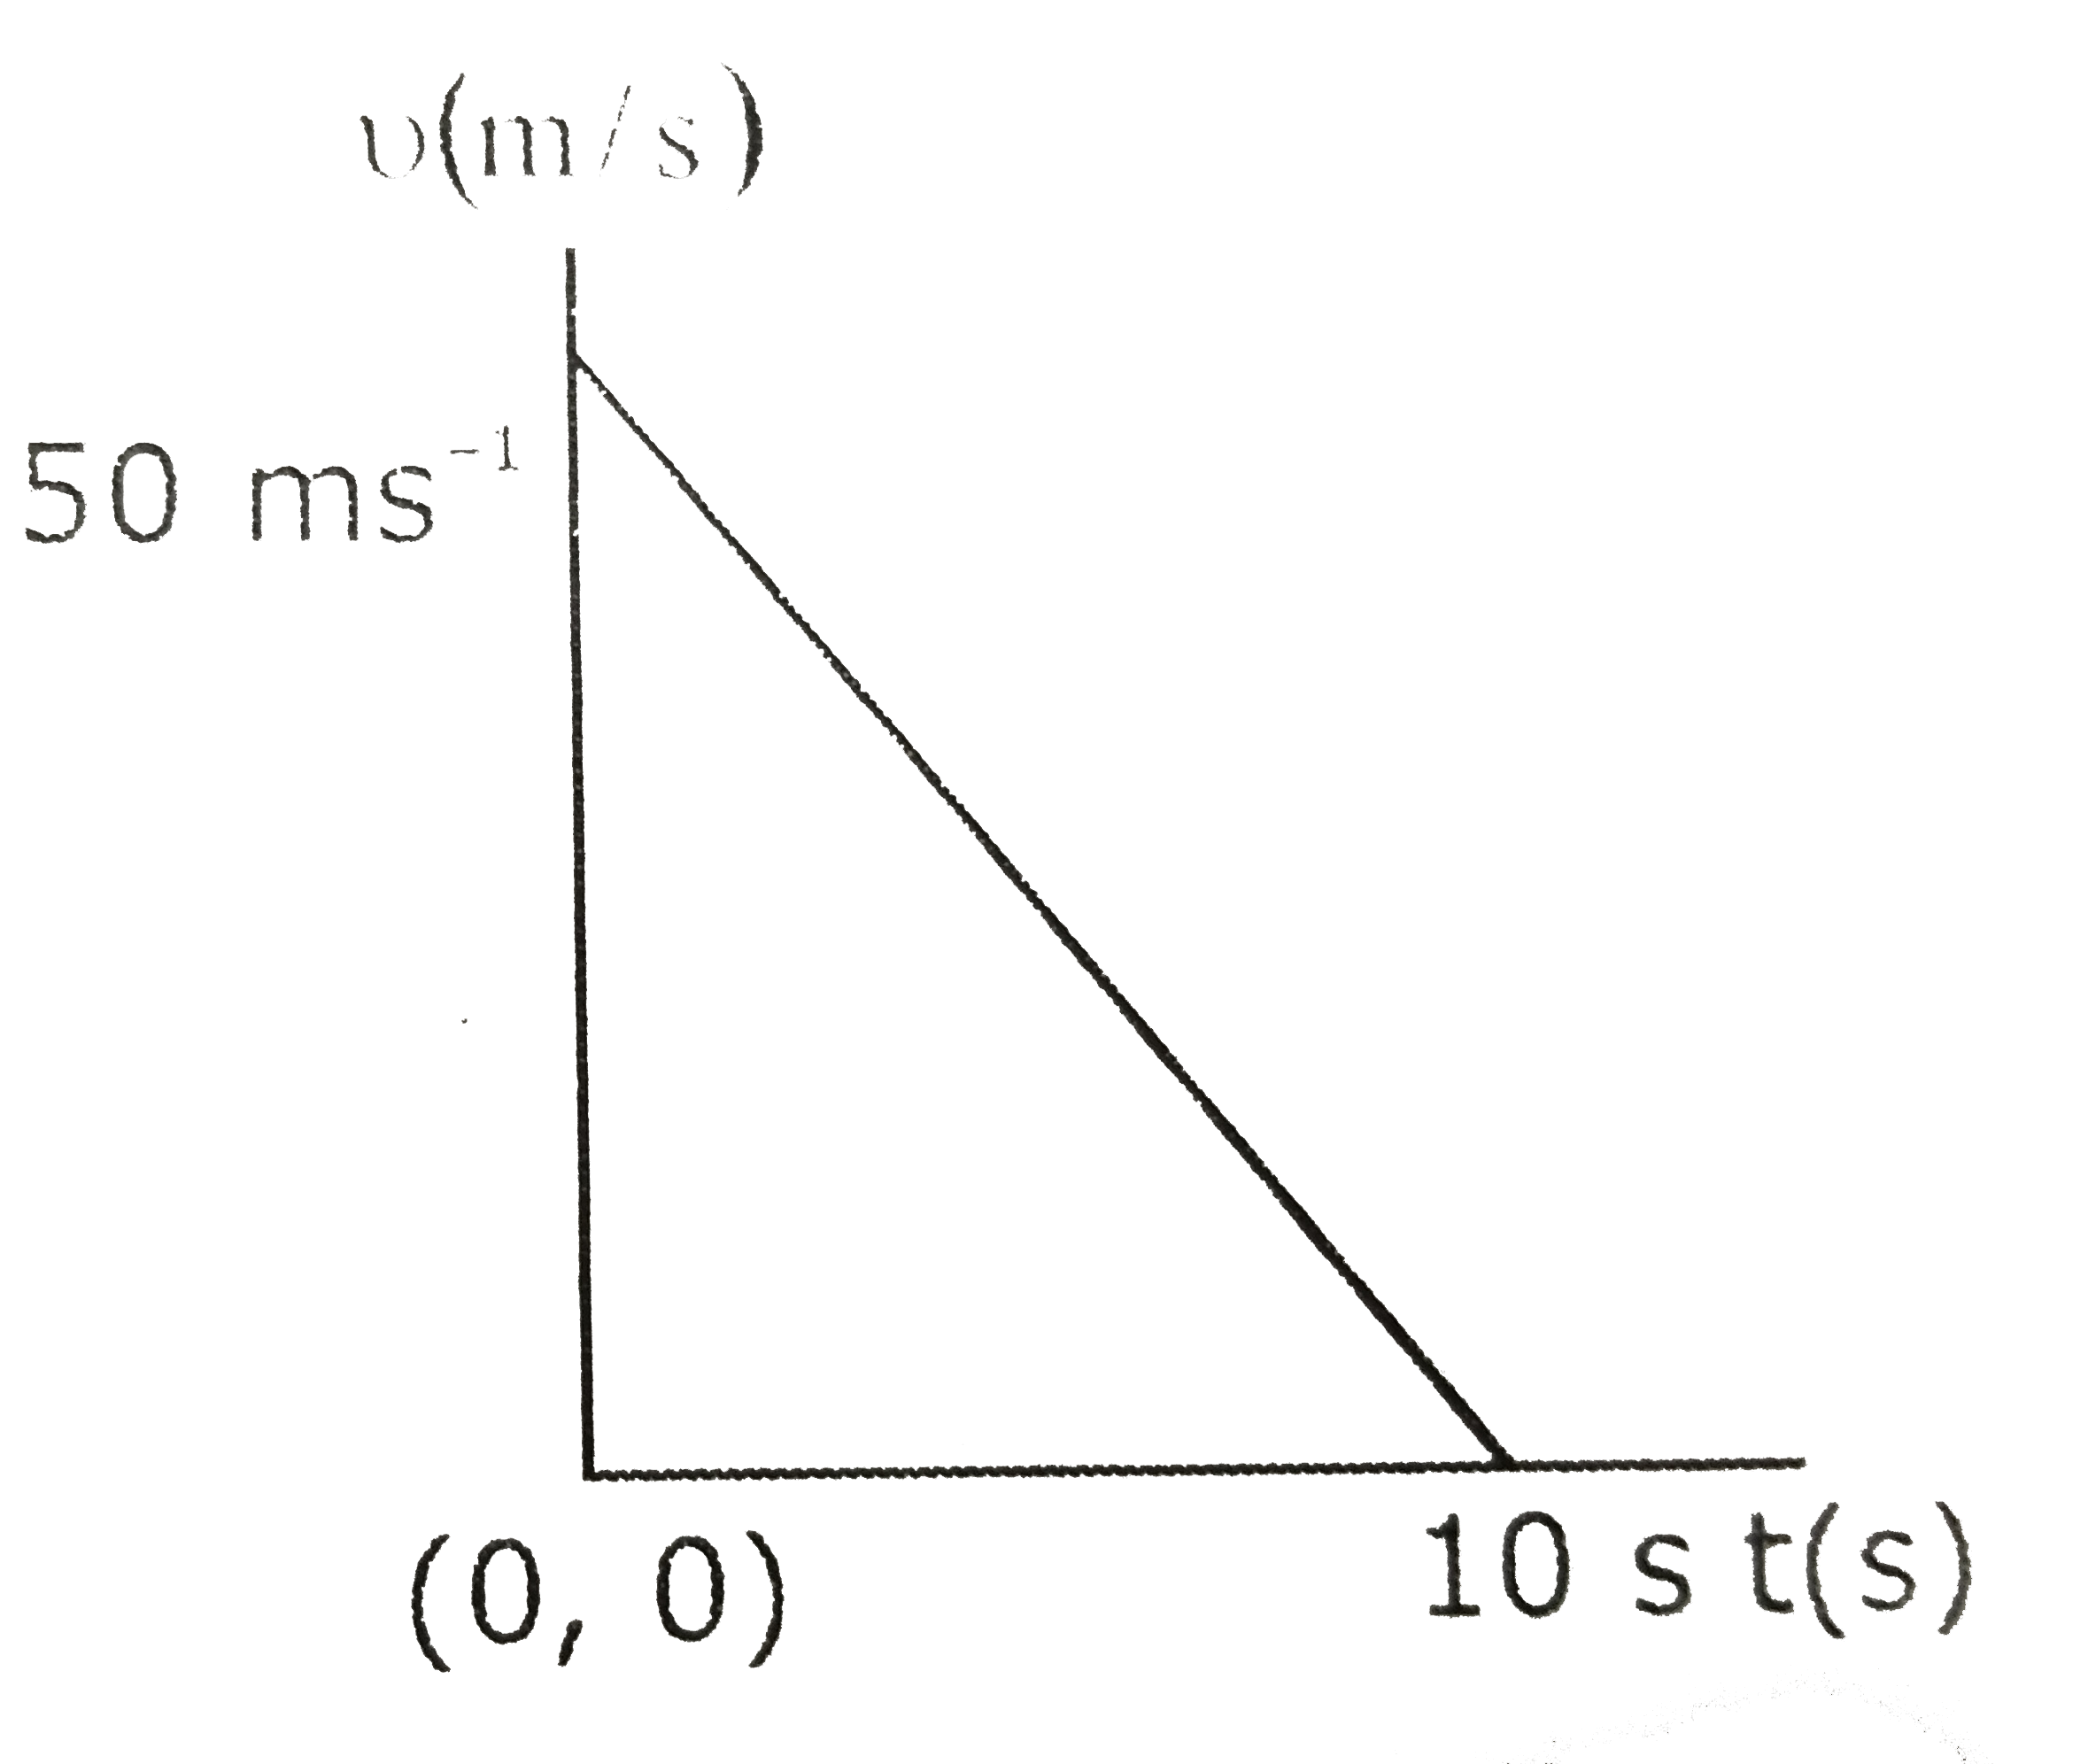
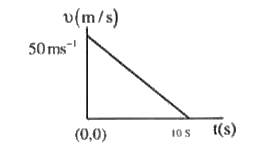
Velocity -time graph for a body of mass 10 kg is shown in figure. Work -done on the body in first two seconds of the motion is :
View SolutionThe velocity (v) and time (t) graph of a body in a straight line motion is shown in the figure . The point S is at 4.333 seconds . The total distance covered by the body in 6s is :
View SolutionVelocity - time graph for a body of mass 10 kg is shown in figure. Work - done on the body in first two seconds of the motion is :
View SolutionFor the velocity time graph shown in figure below the distance covered by the body in last two seconds of its motion is what fraction of the total distance covered by it in all the total distance covered by it in all the seven seconds
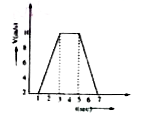
View SolutionThe velocity time graph of a body moving in a straight line is shown in the figure. The displacement and distance travelled by the body in 6 sec are respectively.
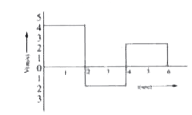
View SolutionThe velocity versus time graph of a body in a straight line is as shown in figure. The displacment of the body in five seconds is
View SolutionFigure shows the acceleration time (a-t) graph of a body moving in a straight line. Which graph in fig show the velocity time (v-t) of the motion of the body? Assume that x=0 and v=0 at t=0
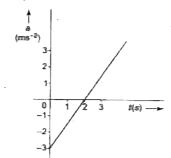
View SolutionThe vecs - t graph of a body is as shown in the figure. The time for which the body is in motion is ______ second.
View Solution

