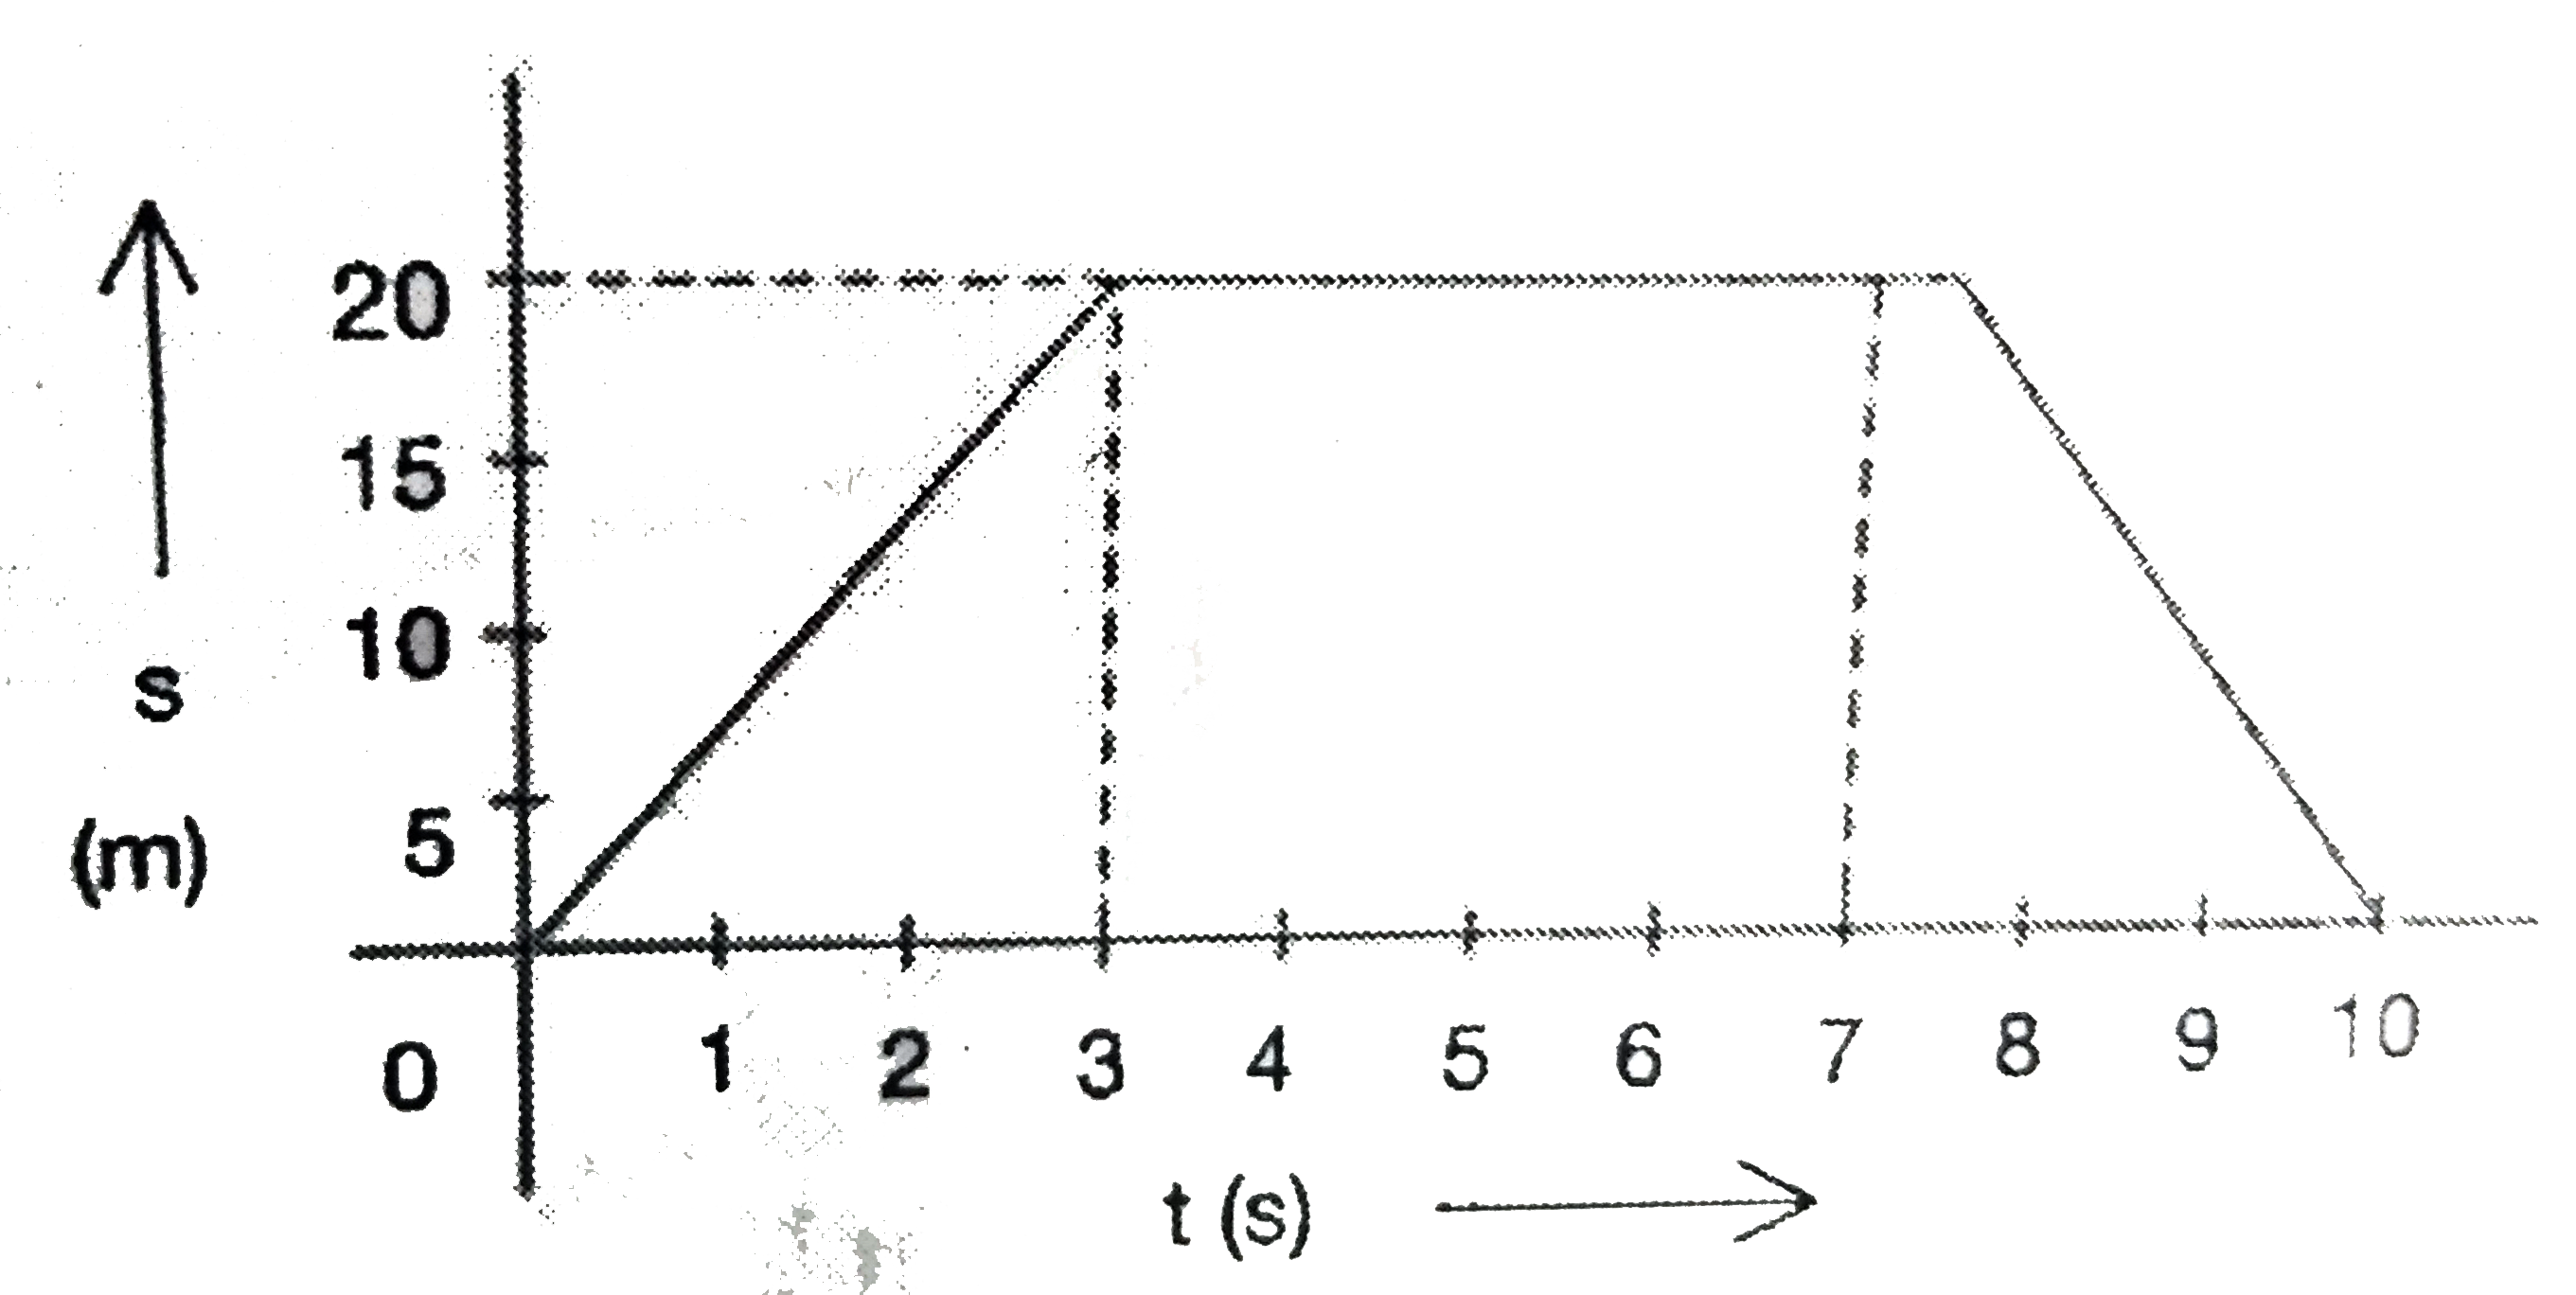
The →s−t graph of a body is a shown in the figure The time for which the body is in motion is________ second
A
2
B
3
C
6
D
10
Video Solution
Text Solution
The correct Answer is:C
From the graph it is clear that, from the instant t = 3 s to the instant t = 7 s, the displacement of the body is constant. This implies that the body is at rest for 4 seconds of time. Thus, the body is in motion for 6 seconds (10 - 4 = 6)
|
Similar Questions
Knowledge Check
The →s−t graph of a body is a shown in the figure The time for which the body is in motion is________ second
 A2B3C6D10
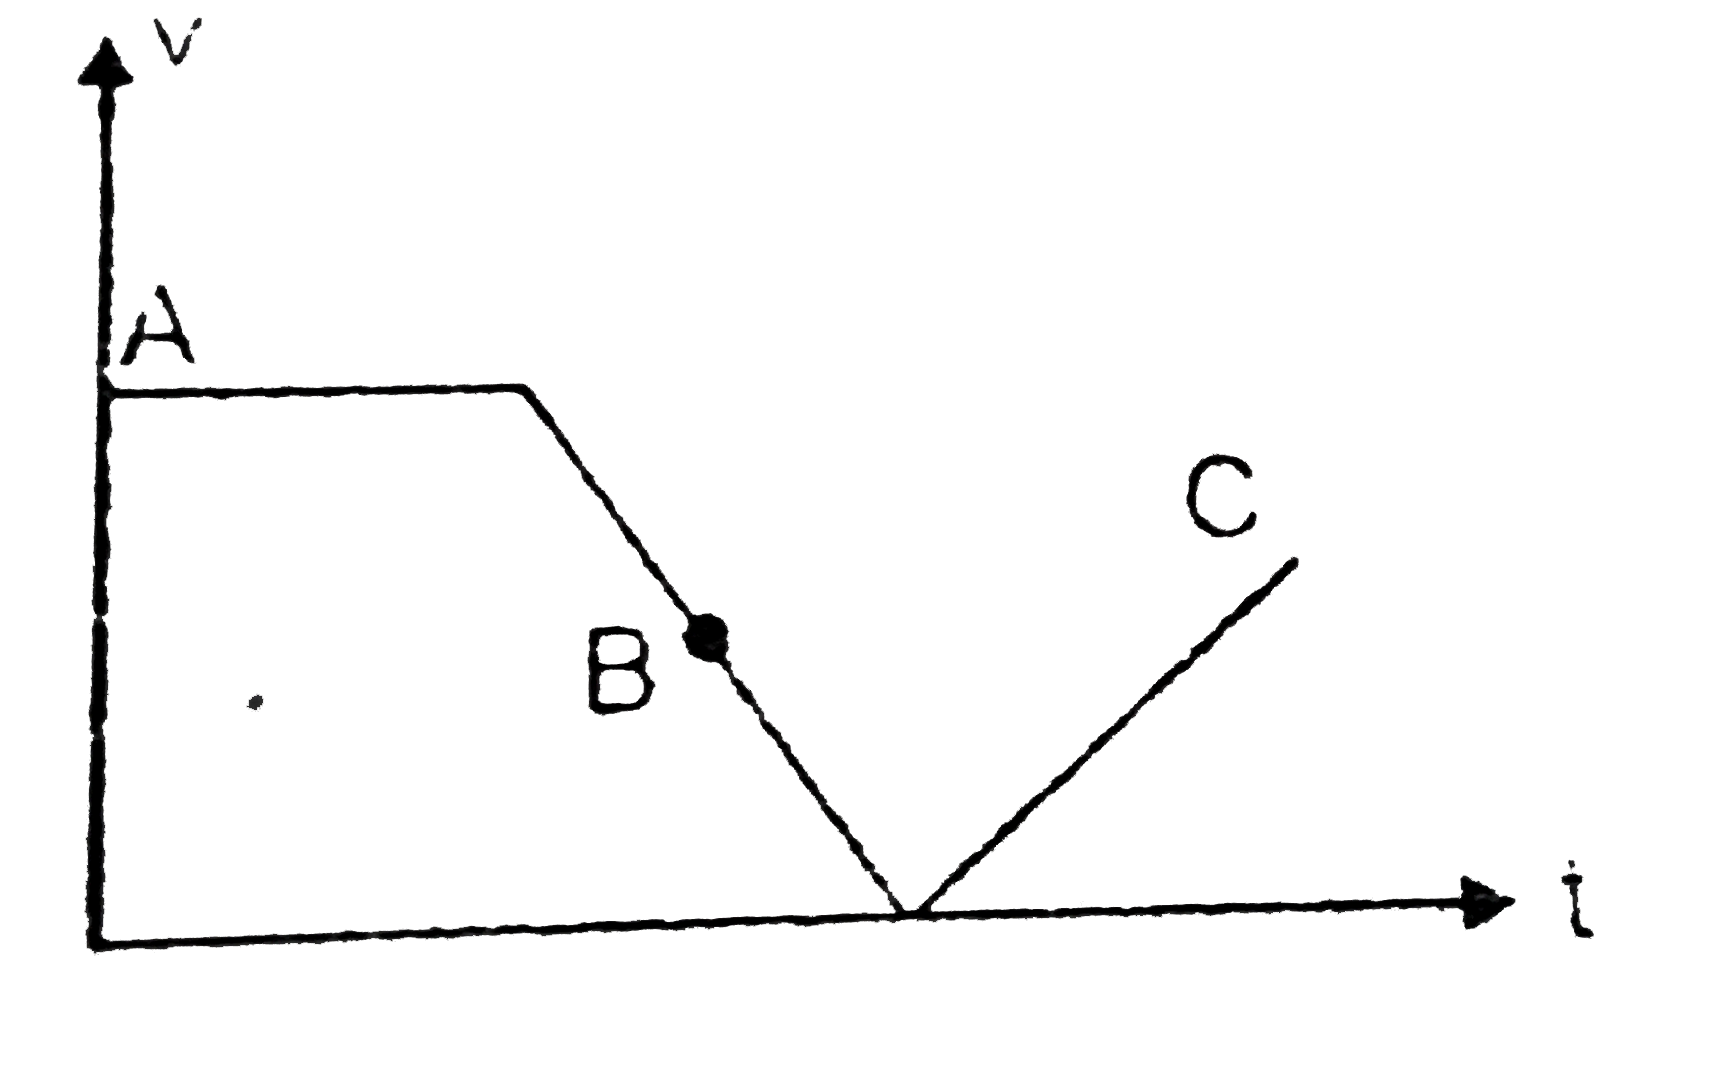
The velocity-time graph of a body is shown in the figure, it implies that at point B
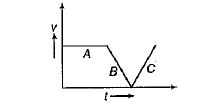 Athe force Is zeroBthere is a force toward motionCthere Is a force which opposes motionDthere is only gravitational force
The velocity-time graph of a body is shown in .
The displacement of the body in 8s is.
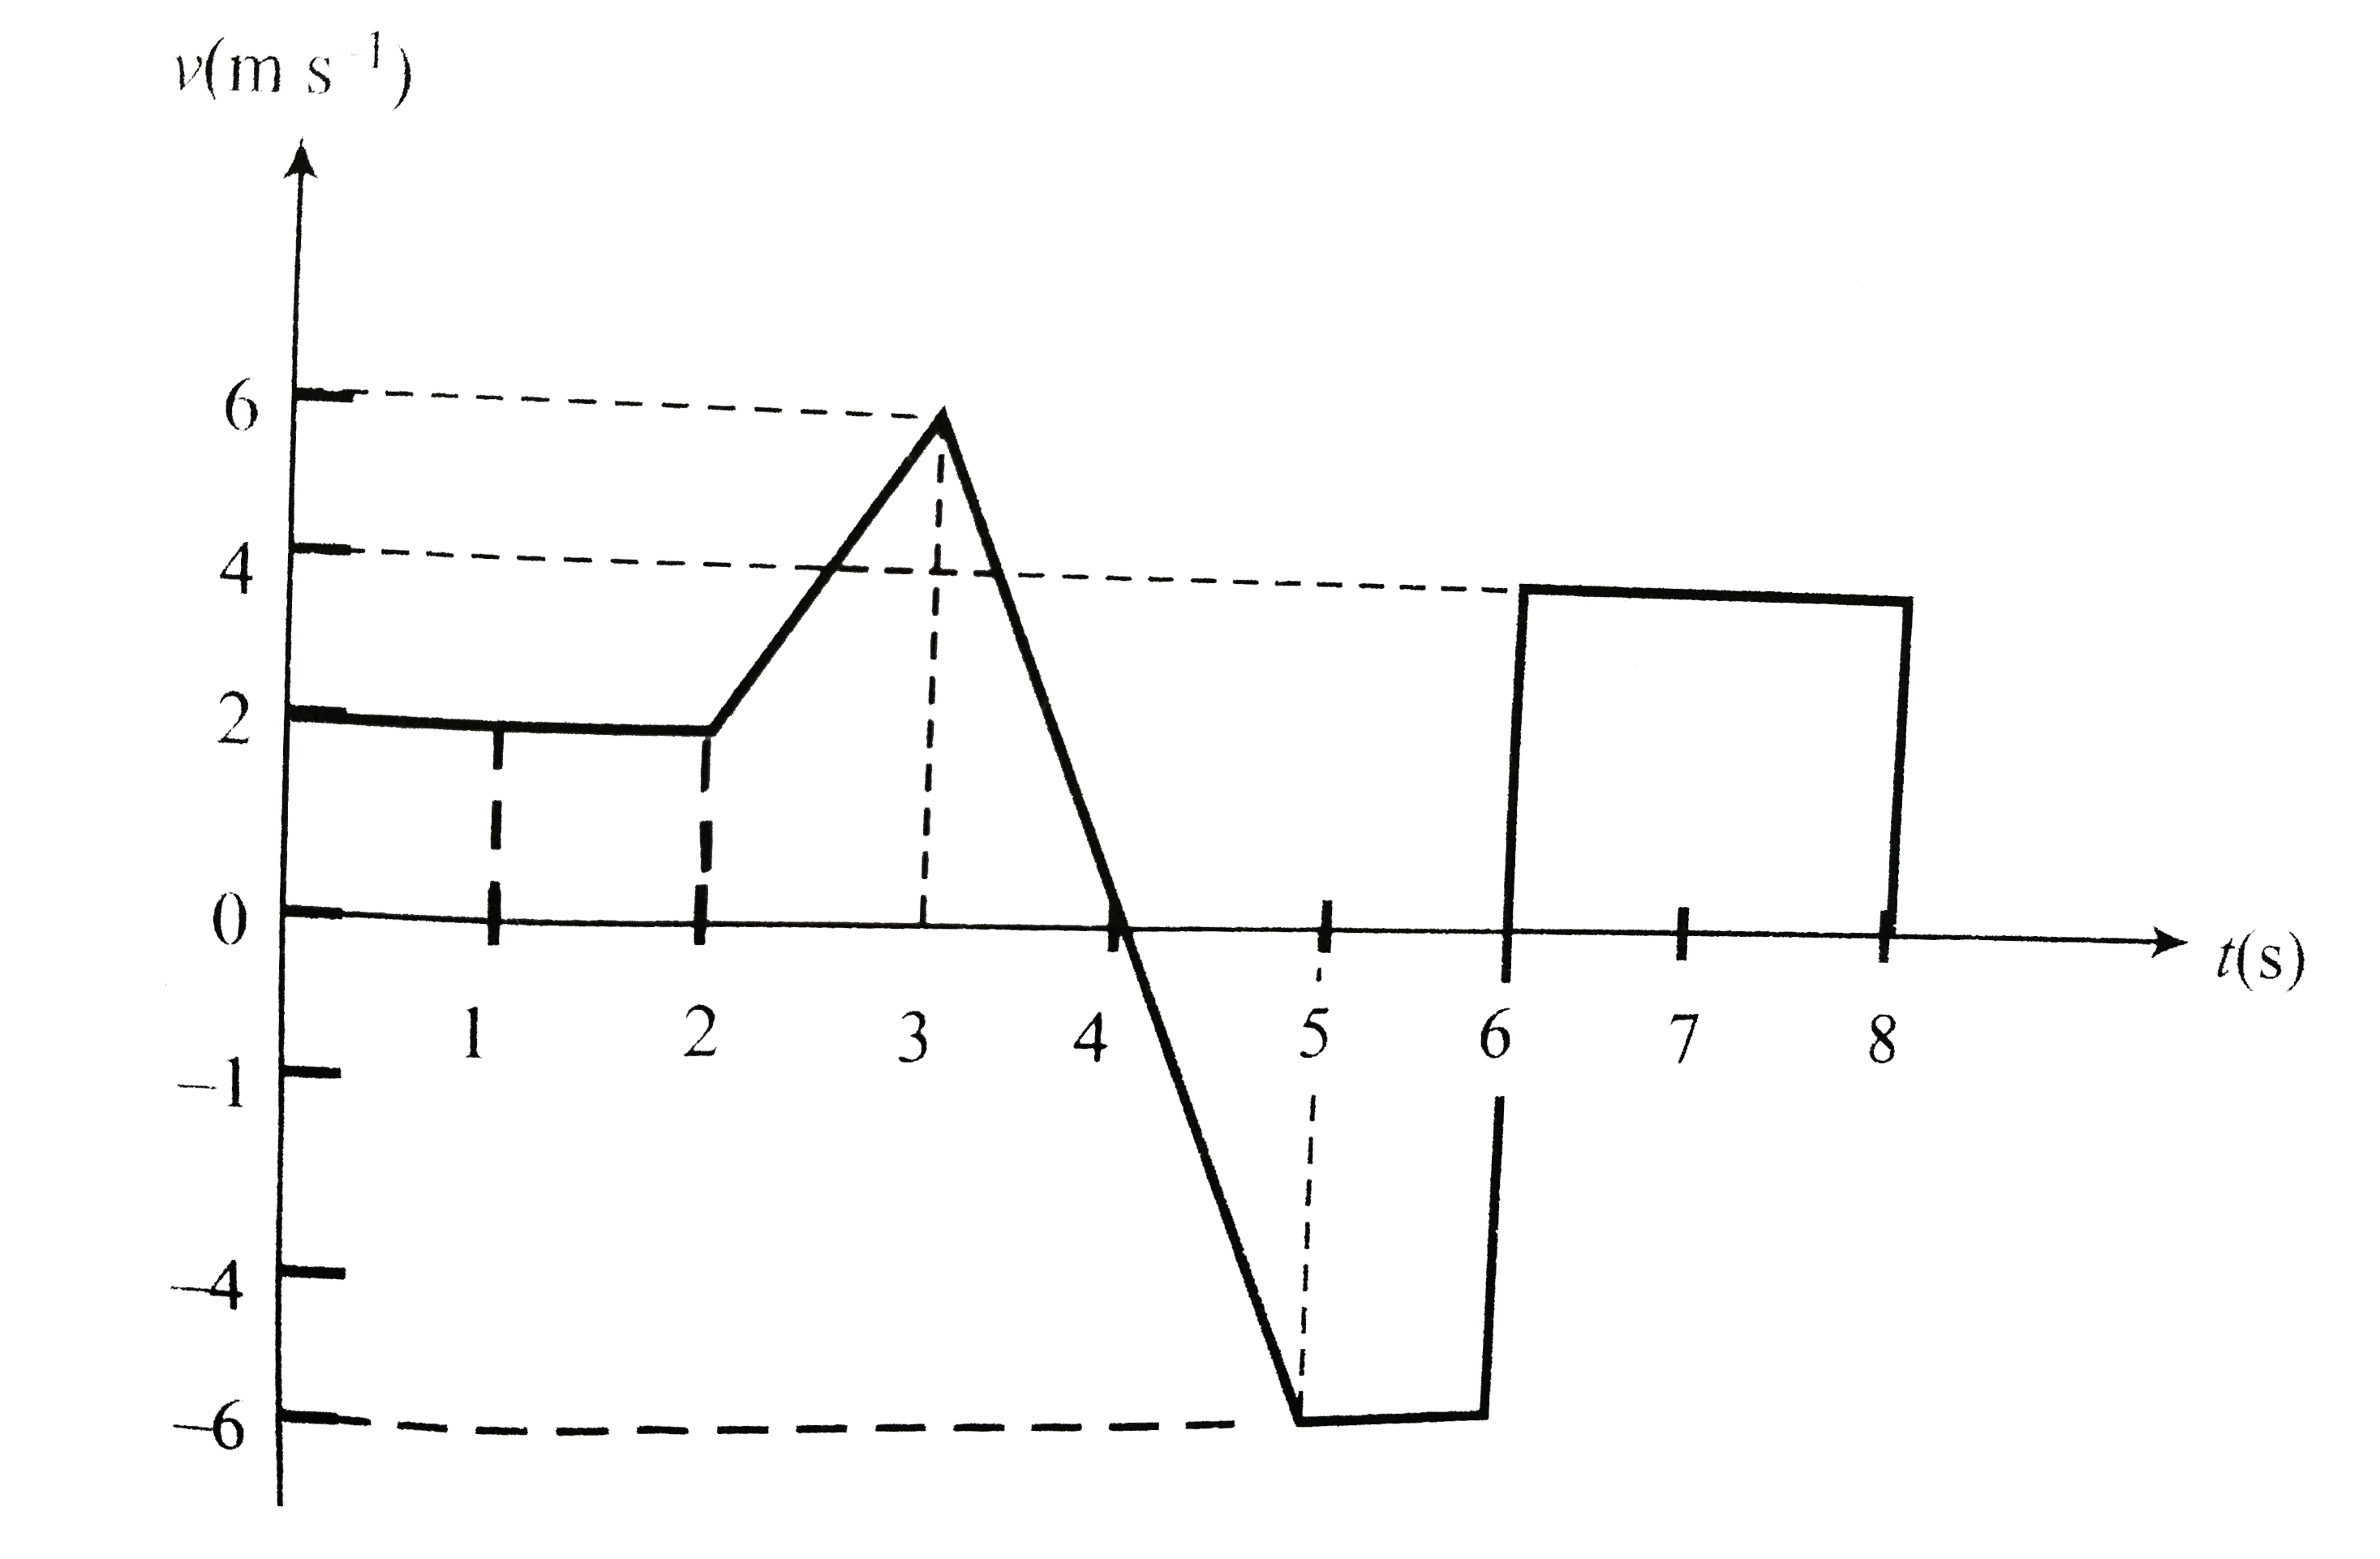 .A9mB12mC10mD28m
The velocity versus time graph of a body in a straight line is as shown in figure. The displacment of the body in five seconds is
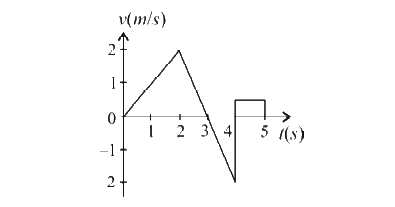
View SolutionVelocity versus time graph of a body is shown in figure. It explains that
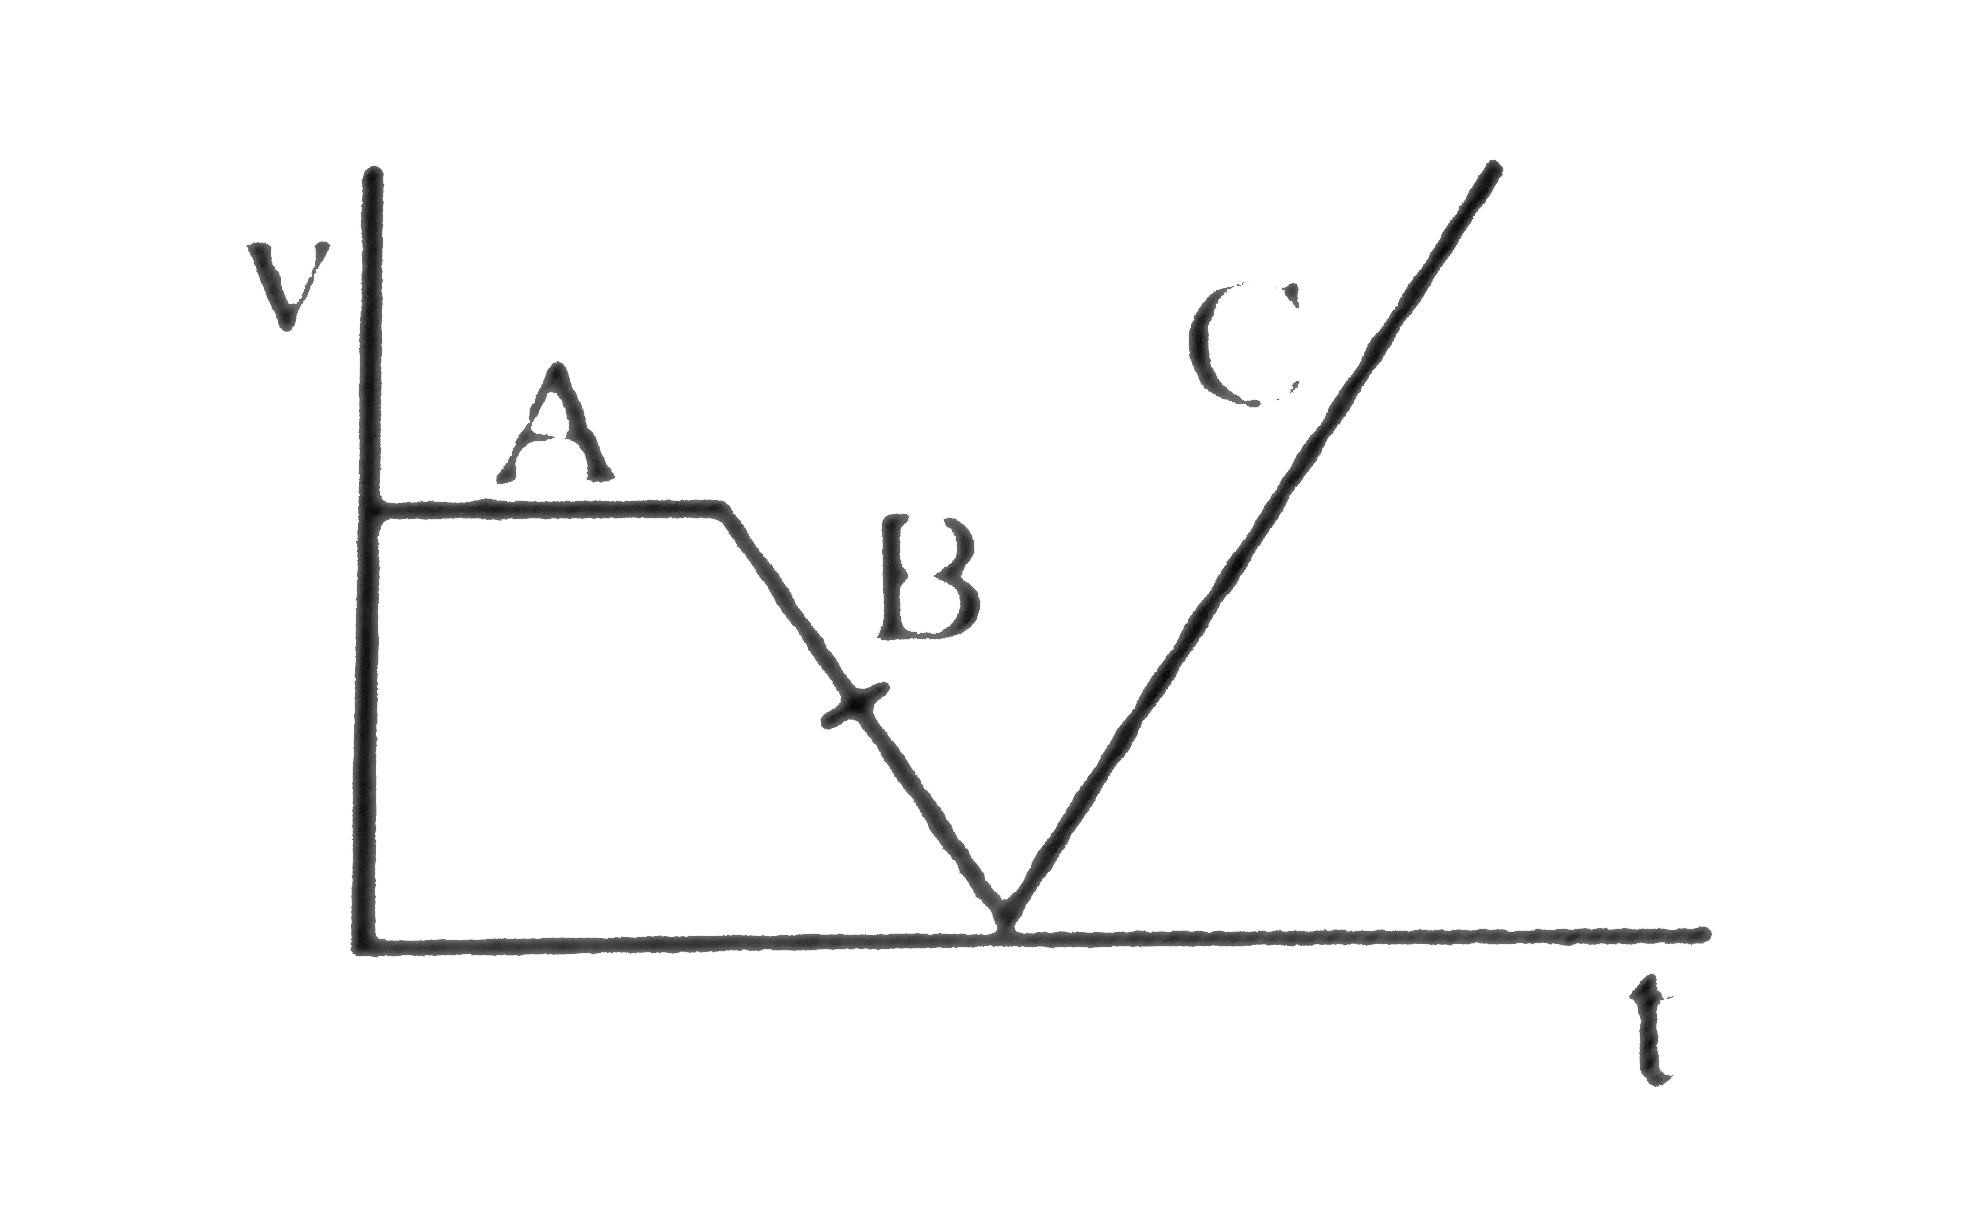
View SolutionThe distance- time graph of a body is as shown in the figure. The part of the graph that represent the unifrom speed of the body is
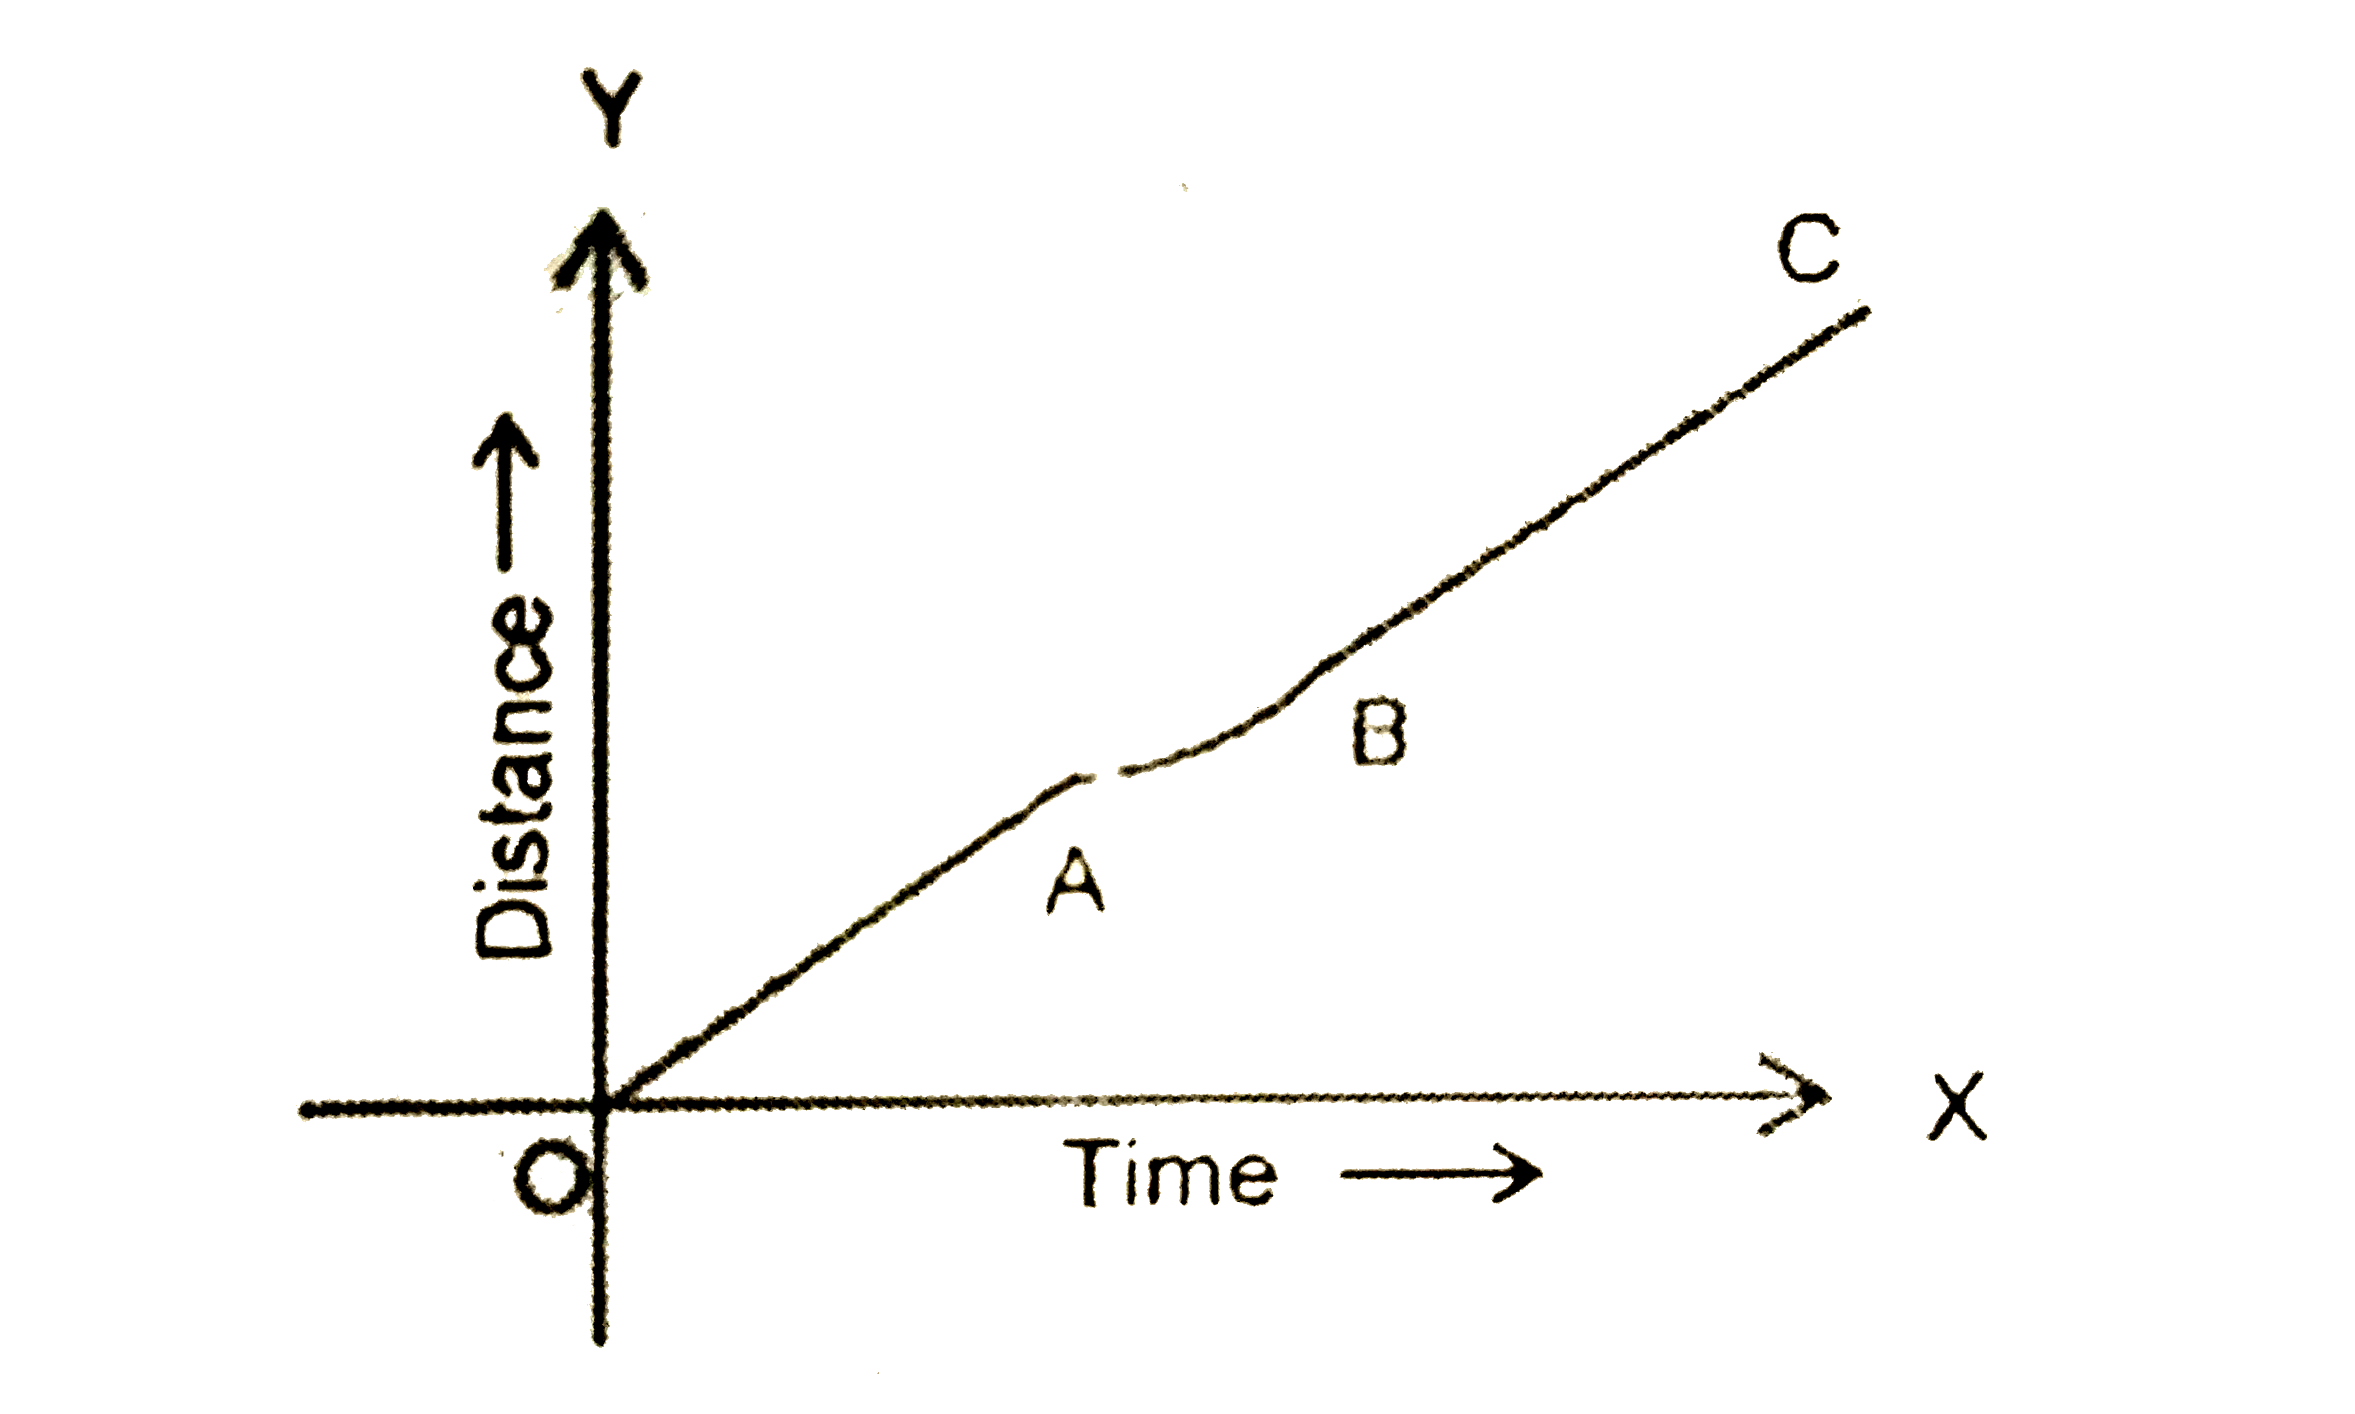
View SolutionThe distance- time graph of a body is as shown in the figure. The part of the graph that represent the unifrom speed of the body is

View SolutionThe displacement time graph of a body is shown in figure. The velocity-time graph of the motion of the body will be
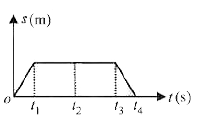
View Solution

