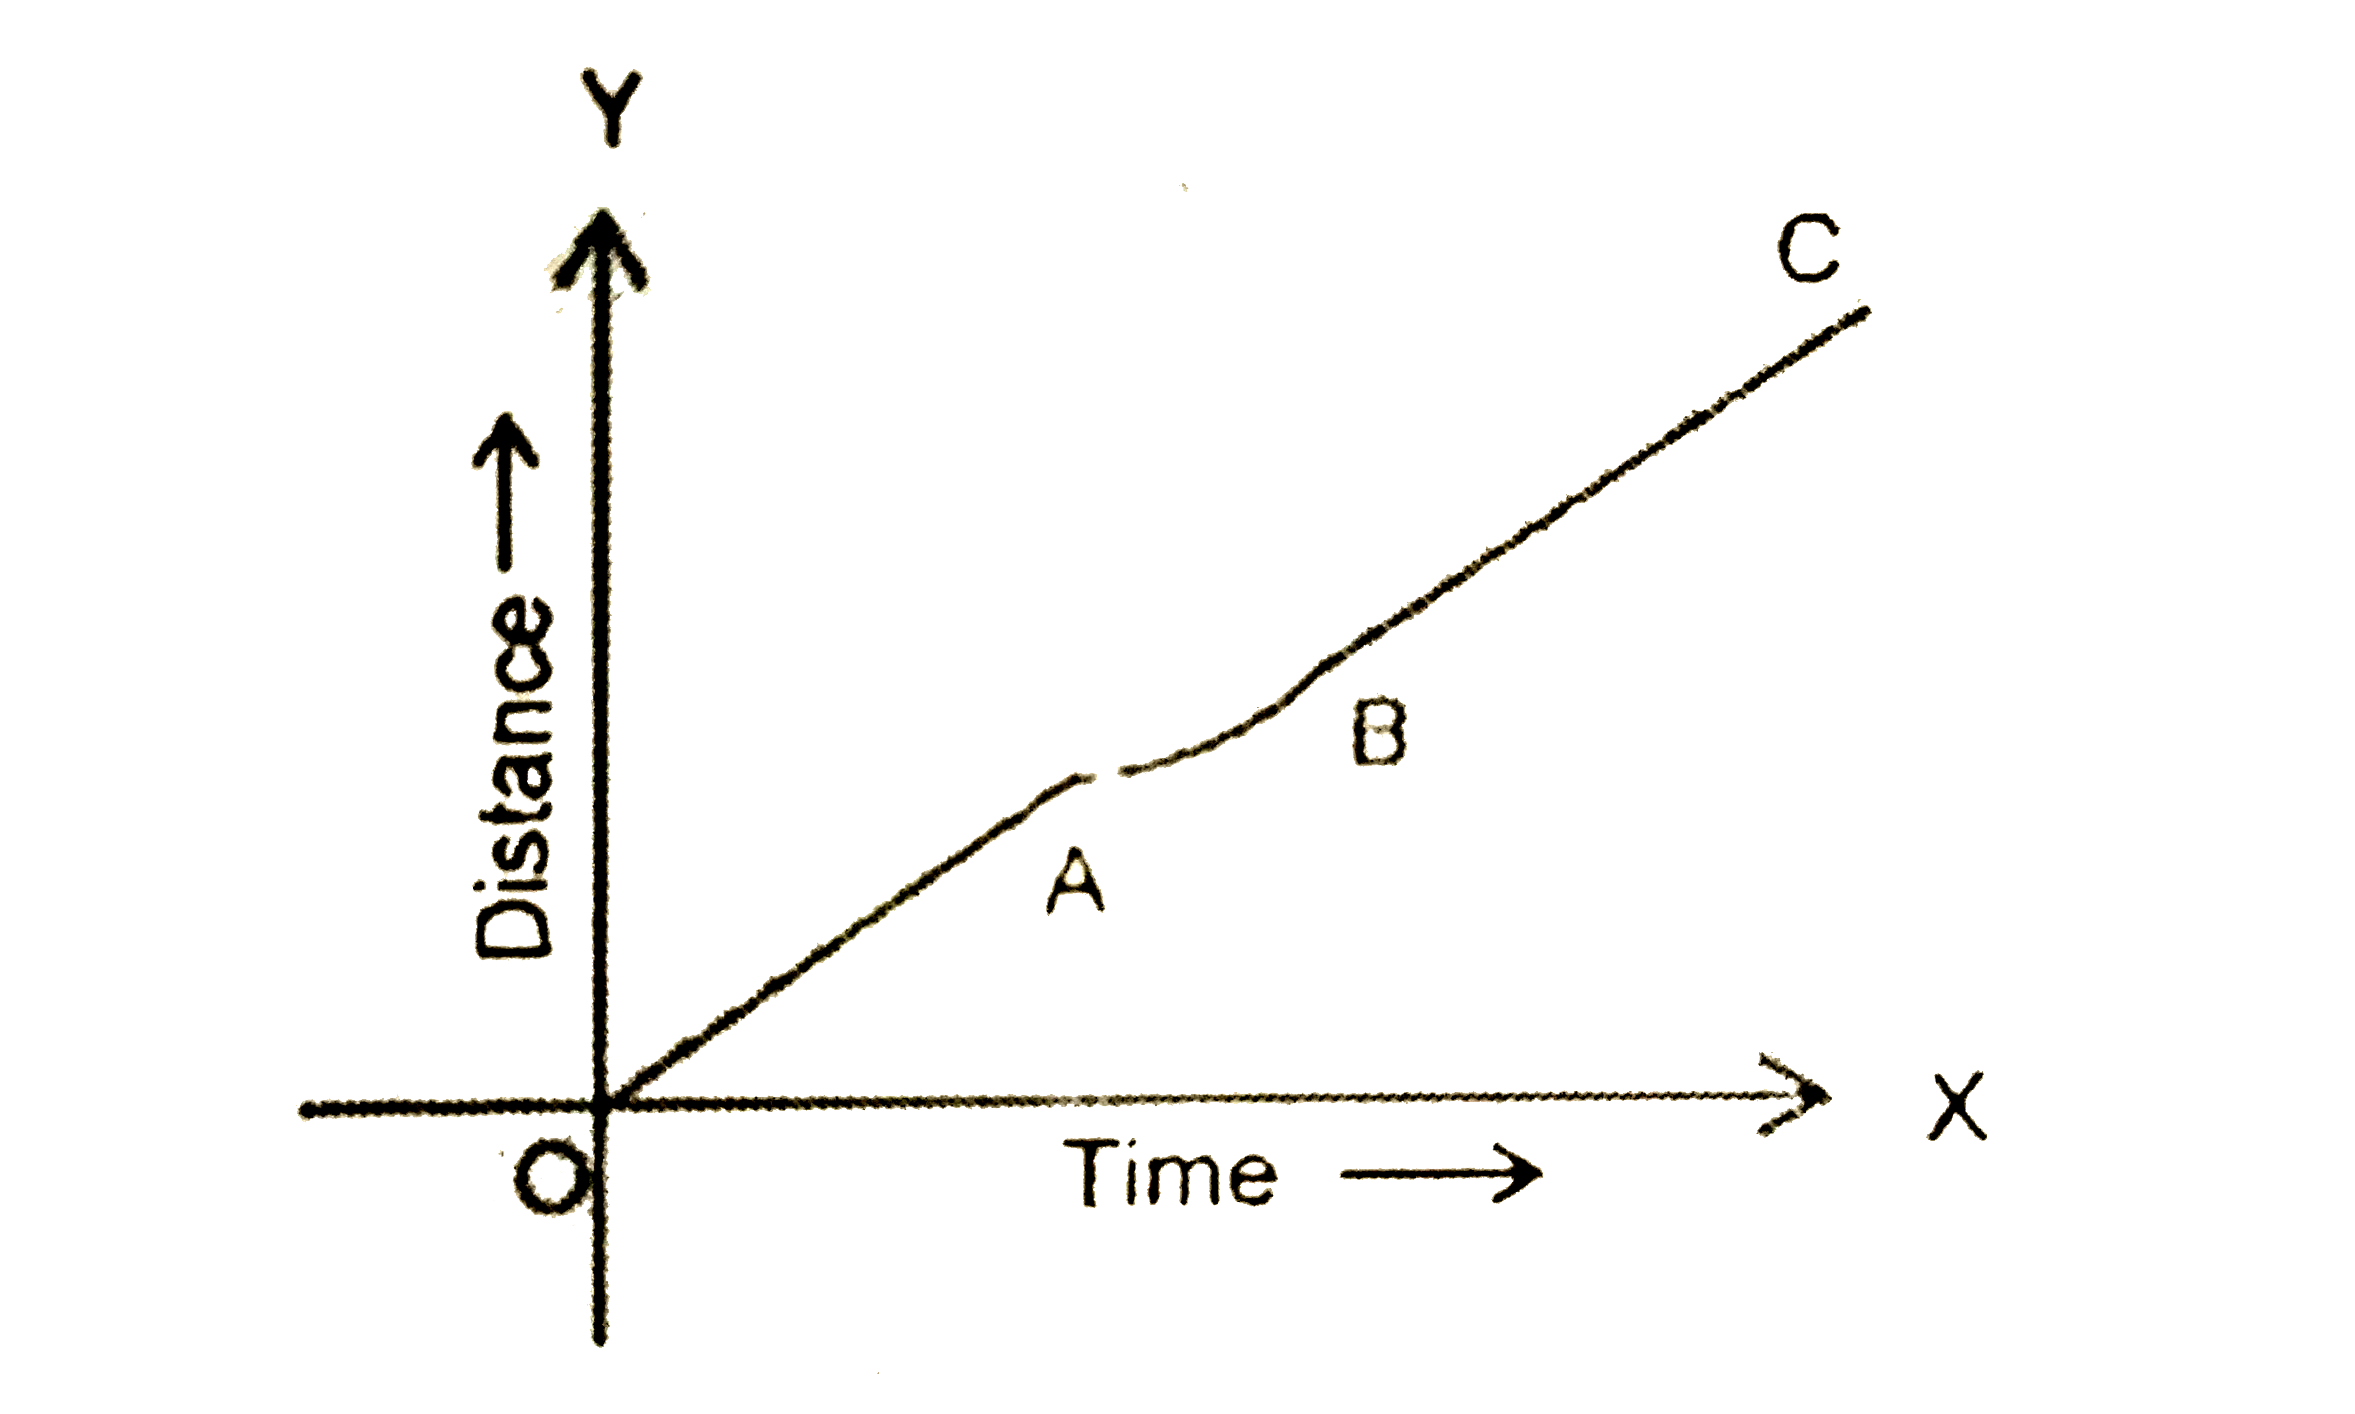
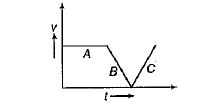
The distance- time graph of a body is as shown in the figure. The part of the graph that represent the unifrom speed of the body is
OA
AB
BC
Both OA and BC
The correct Answer is:D
Step by step video, text & image solution for The distance- time graph of a body is as shown in the figure. The part of the graph that represent the unifrom speed of the body is by Physics experts to help you in doubts & scoring excellent marks in Class 7 exams.
Updated on:21/07/2023Topper's Solved these Questions
- KINEMATICSBOOK - PEARSON IIT JEE FOUNDATIONCHAPTER - KINEMATICSEXERCISE - match
3 Videos
- KINEMATICSBOOK - PEARSON IIT JEE FOUNDATIONCHAPTER - KINEMATICSEXERCISE - Level 1
18 Videos
- KINEMATICSBOOK - PEARSON IIT JEE FOUNDATIONCHAPTER - KINEMATICSEXERCISE - ASSESSMENT TEST (TEST 2 (SELECT THE CORRECT ALTERNATIVE)
15 Videos
- HEAT BOOK - PEARSON IIT JEE FOUNDATIONCHAPTER - HEAT EXERCISE - Test 2
14 Videos
- LIGHTBOOK - PEARSON IIT JEE FOUNDATIONCHAPTER - LIGHTEXERCISE - ASSESSMENT TEST (TEST 2 (SELECT THE CORRECT ALTERNATIVE))
15 Videos
Similar Questions
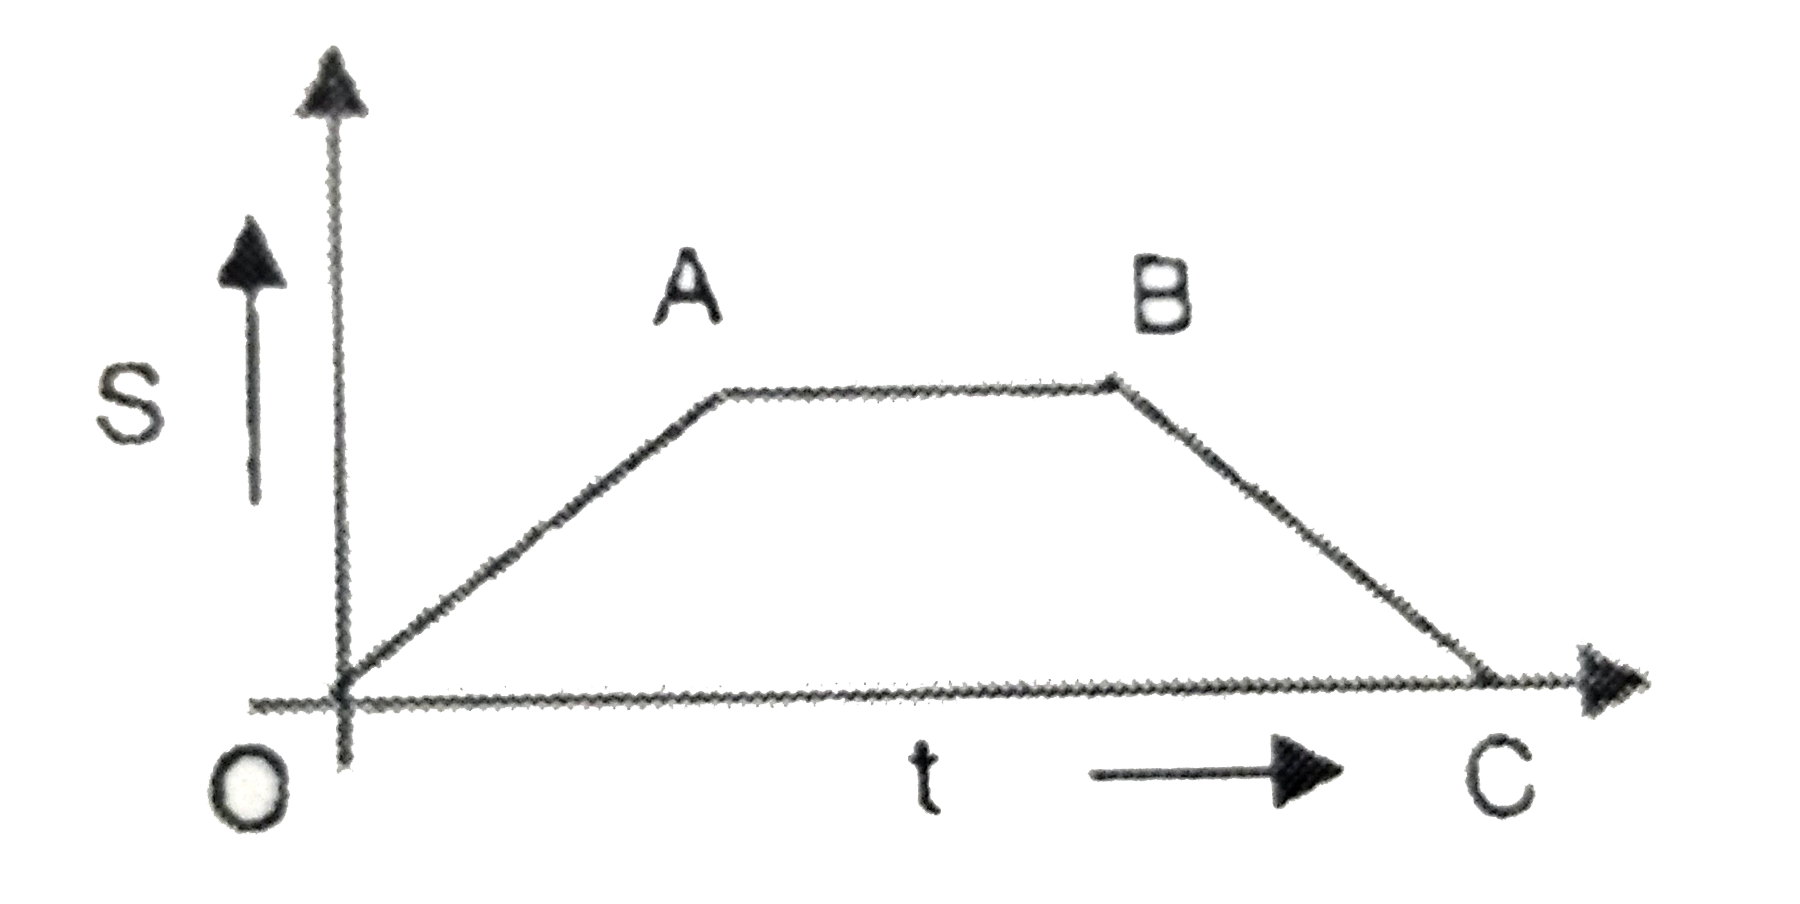
The displacement-time graph of a body is shown in the figure below. The part of the graph that represents the uniform motion of the body is _________
View SolutionThe displacement-time grpah of a body is shown in the figure below.
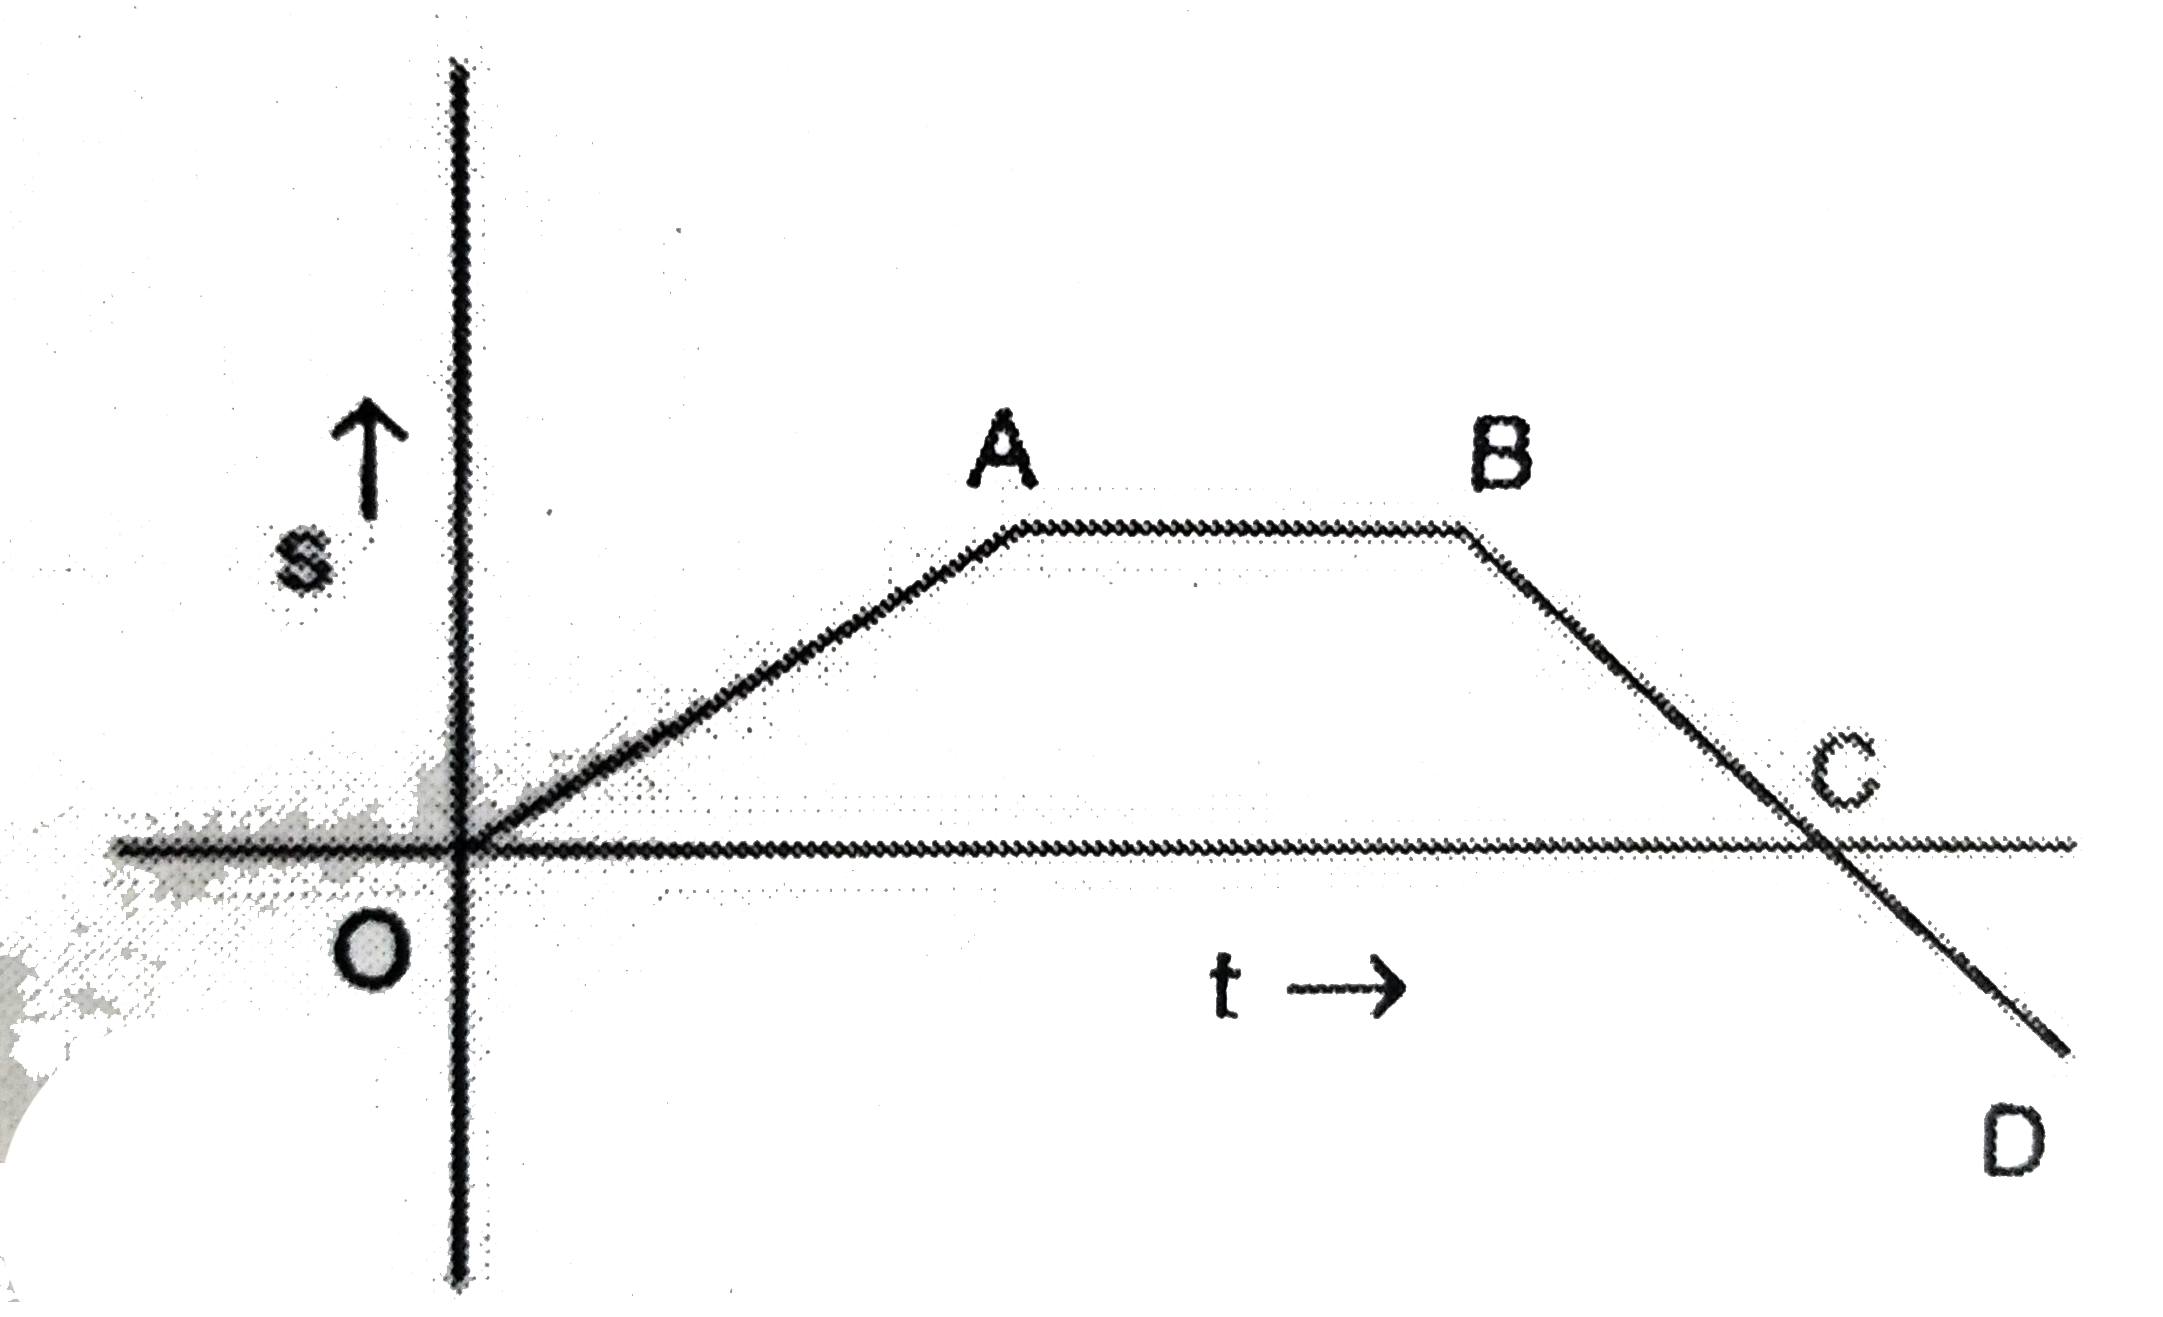
The part of the graph that represens the body at rest is
View Solution
Knowledge Check
The distance- time graph of a body is as shown in the figure. The part of the graph that represent the unifrom speed of the body is
 AOABABCBCDBoth OA and BC
The displacement-time grpah of a body is shown in the figure below.

The part of the graph that represens the body at rest isAOABABCBCDCDThe distance-time graph of a moving vehicle is as shown in the figure.
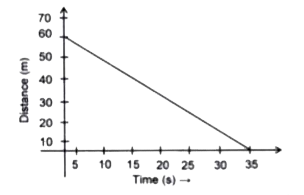 AThe speed of the vehicle is increasing with time.BThe speed of the vehicle is decreasing with time.CThe final speed of the vehicle is zero.DGraph is not possible.
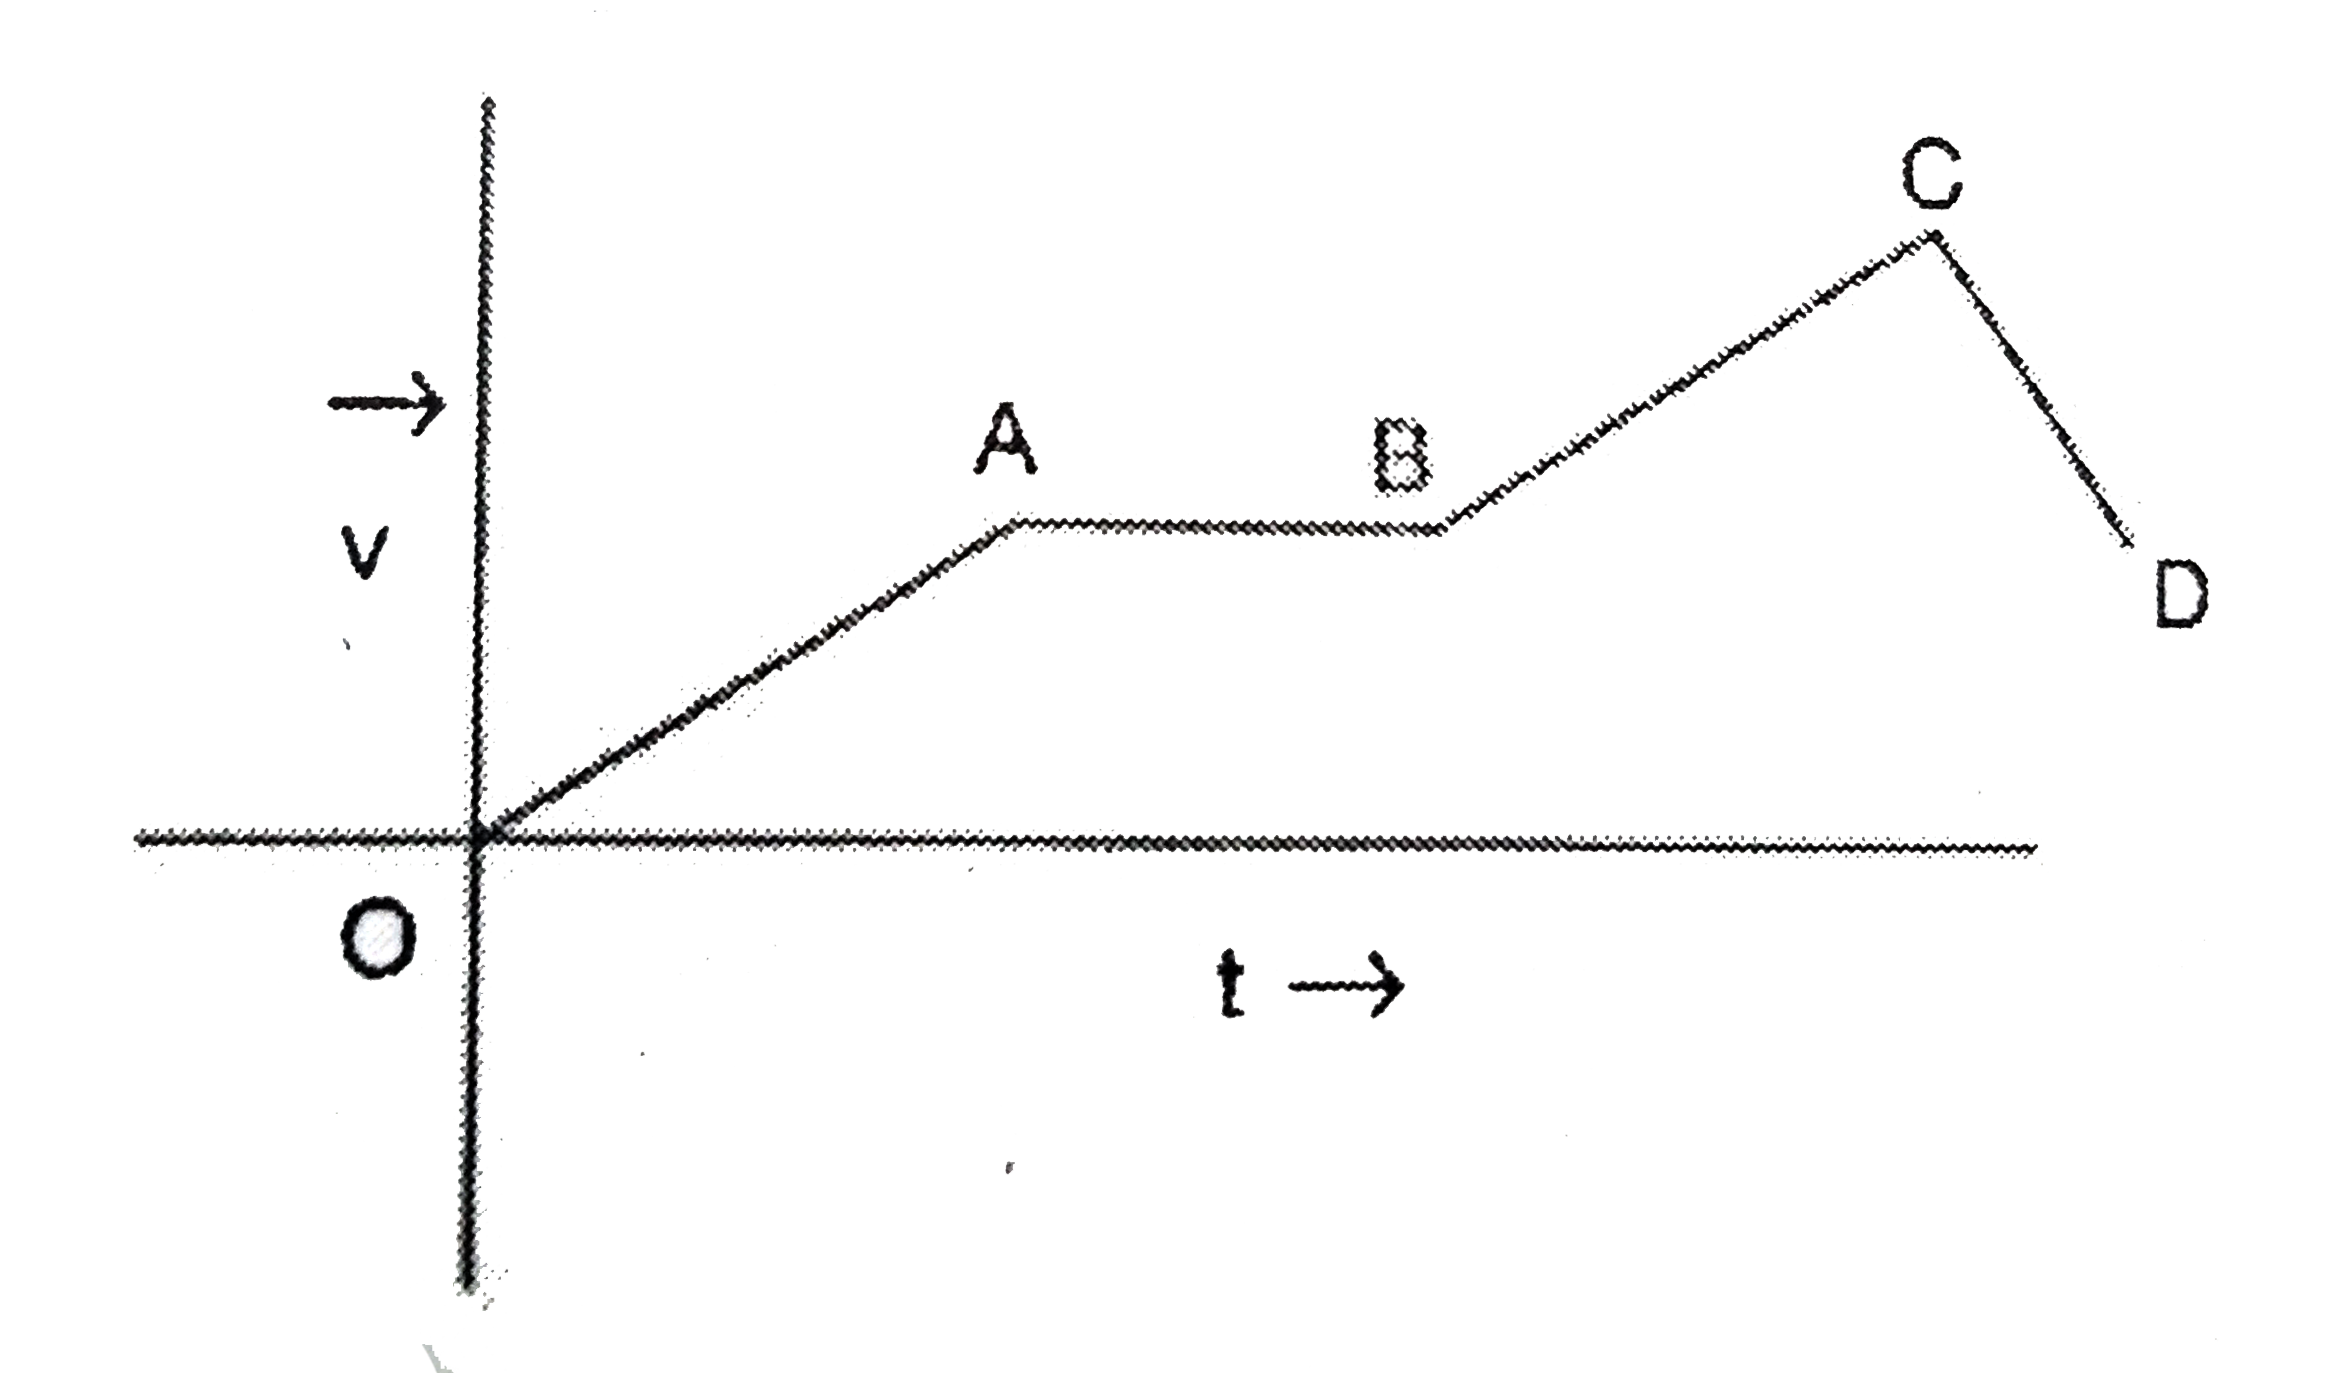
The velocity-time graph of a certain is shown in the following graph. The part of the graph that shows deceleration of the body is
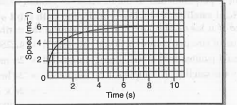
View SolutionSpeed - time graph for a car is show in the fig 1.13:Which part of the graph represents uniform motion of the car ?
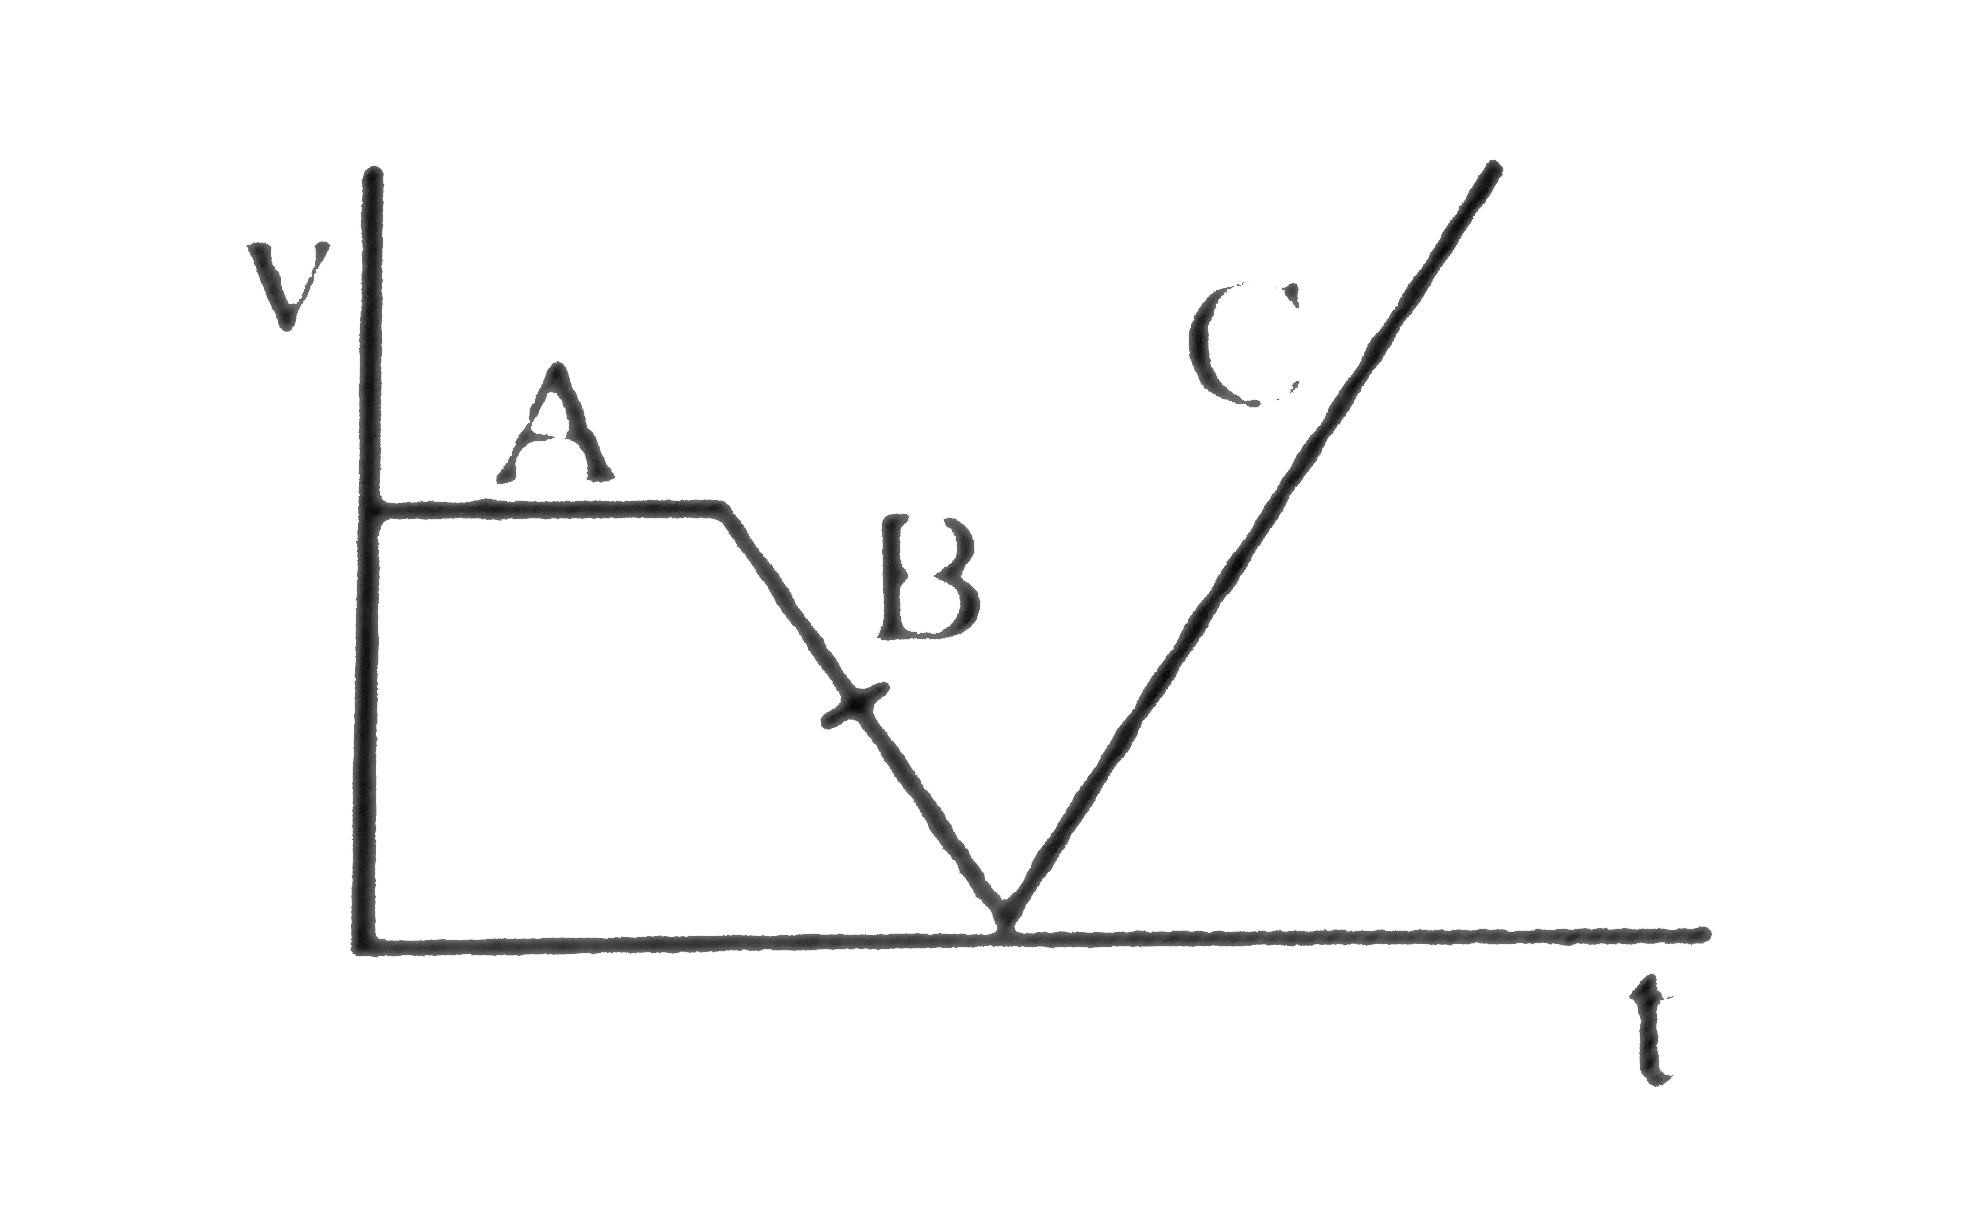
View SolutionVelocity versus time graph of a body is shown in figure. It explains that
View SolutionThe velocity time graph of a body is shown in fig. it indicates that :
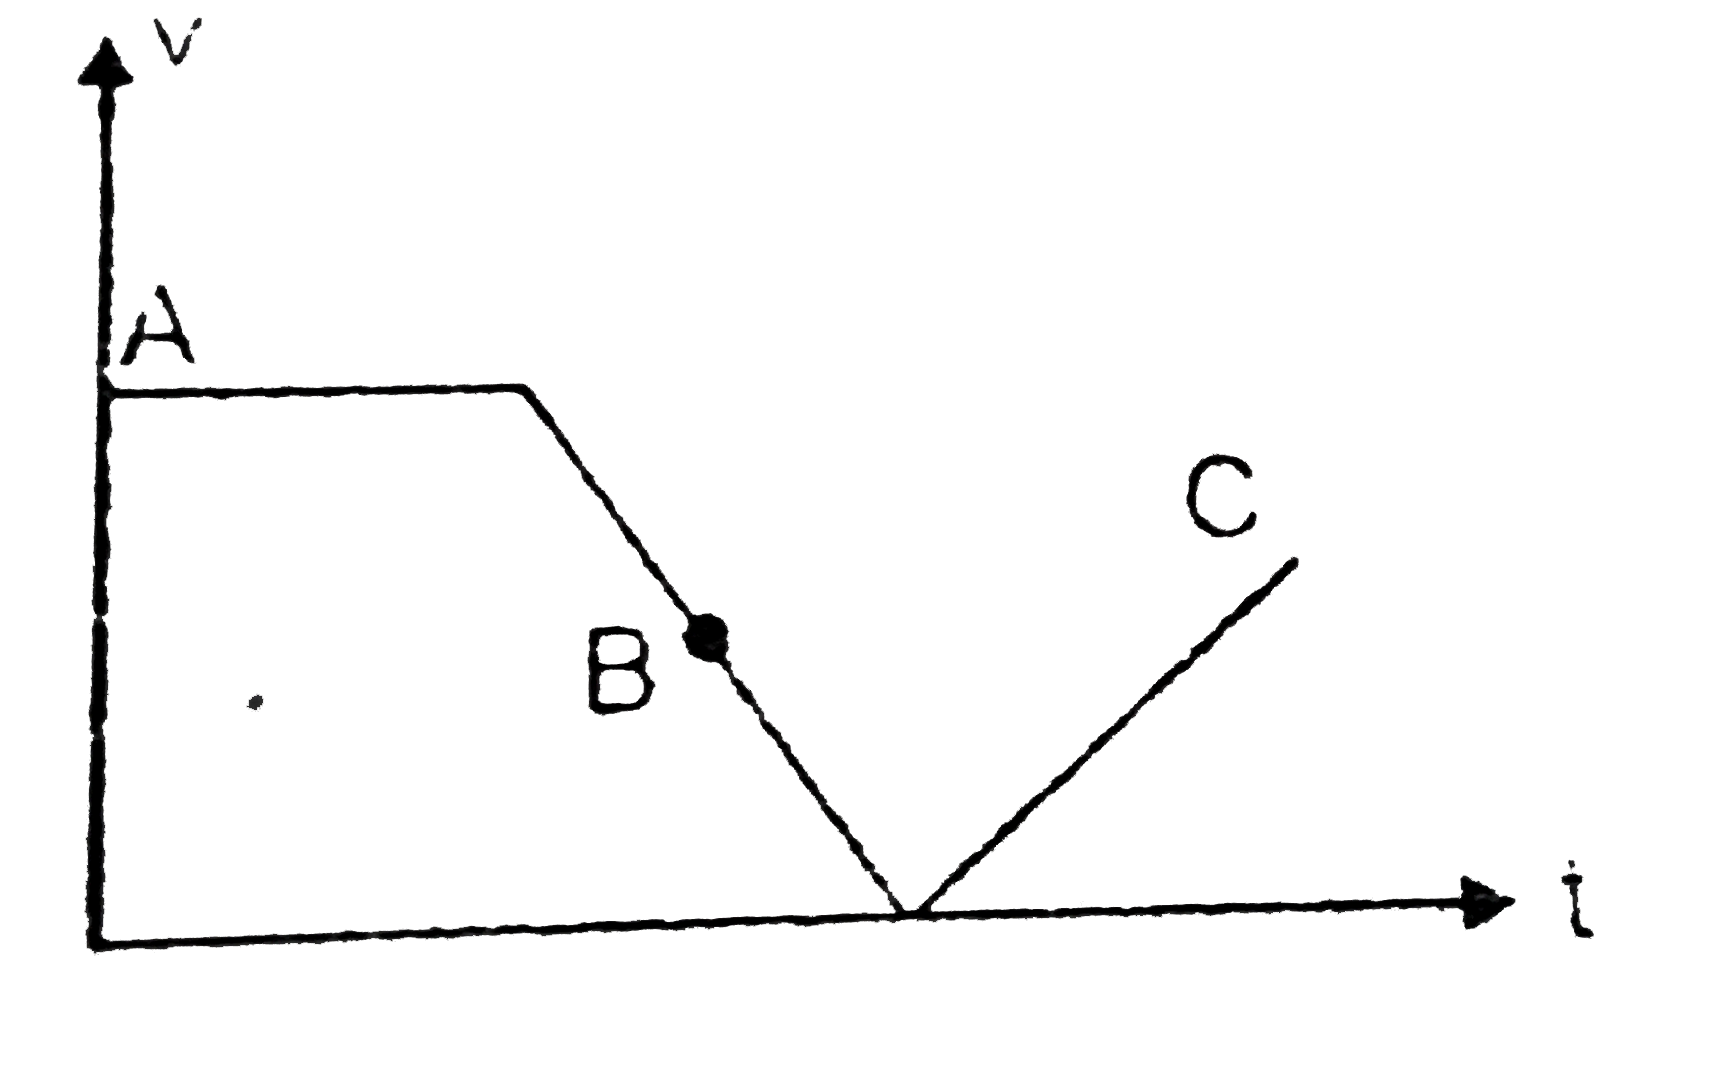
View SolutionThe velocity-time graph of a body is shown in the figure, it implies that at point B
View Solution
