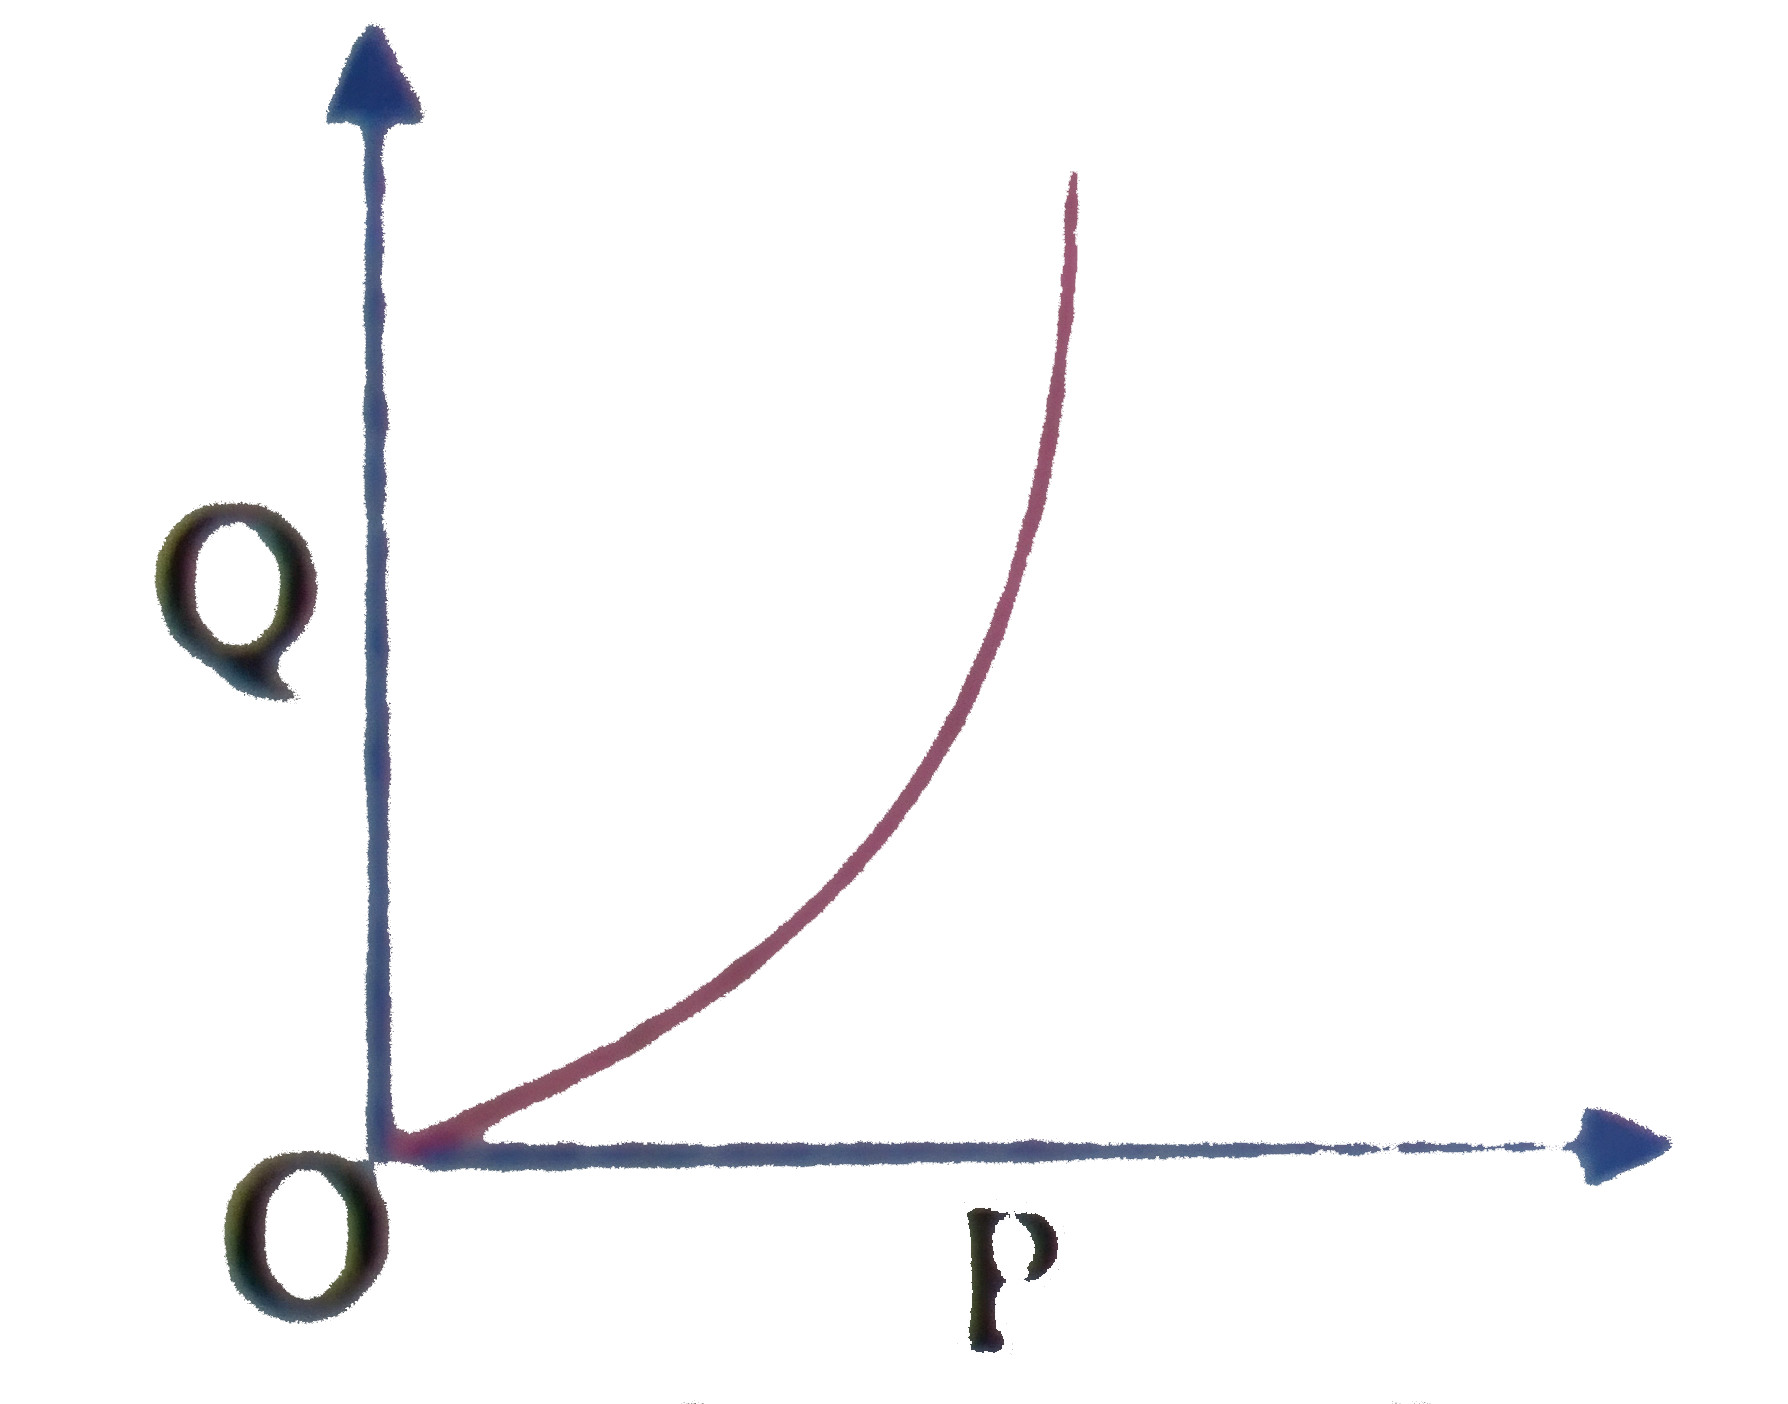
The graph show the behaviour of a length of wire in the region for which the substances obeys Hooke's law. P and Q represent

P = applied force, Q = extension
P = extension, Q = applied force
P = extension, Q = stored elastic energy
P = stored elastic energy, Q = extension
The correct Answer is:C
U=12kx2orU∝x2
Similar Questions
The graph show the behaviour of a length of wire in the region for which the substance obeys Hooke.s law. P and Q represent.
View SolutionWhen a wire is stretched with a very large force it breaks. State Hooke's law. For which part of the the extension of a wire with a load graph, is Hooke's law applicable?
View SolutionState Hooke's law and graphically represent it. OR State Hooke's law Draw a labelled graph of tensile stress against tensile strain for a metal up to breaking point. Show the region Hooke's law is obeyed.
View SolutionExplain with graph hooke's law.
View SolutionThe graph shows the behaviour of a steel wire in the region for whoch the wire obeys Hooke's law. The graph is a parabola. The variables X and Y -axes, respectively can be [ stress (sigma) ,strain ( epsilon) and elastic potential energy(U) ]
View SolutionThe graph show the behaviour of a length of wire in the region for which the substances obeys Hooke's law. P and Q represent
View Solution(i) State Hook's law. (ii) Draw a labelled graph of tensile stress against tensile strain for a metal wire upto the breaking point. Shhow on your graph the region in which Hooke's law is obeyed. What is the significance of the area between the graph and the strain axis withing the Hooke's law region?
View Solutionग्राफ उस क्षेत्र में तार की प्रवृत्ति को प्रदर्शित करता है जिसके लिए पदार्थ हूक के नियम का पालन करता है , तब P तथा Q प्रदर्शित करते है

View Solution
