The graph shows the behaviour of a steel wire in the region for whoch the wire obeys Hooke's law. The graph is a parabola. The variables X and Y -axes, respectively can be [ stress (σ),strain (ε) and elastic potential energy(U) ]
![The graph shows the behaviour of a steel wire in the region for whoch the wire obeys Hooke's law. The graph is a parabola. The variables X and Y -axes, respectively can be [ stress (sigma),strain ( epsilon) and elastic potential energy(U) ]](https://d10lpgp6xz60nq.cloudfront.net/physics_images/DCP_VO2_C15_EO1_026_Q01.png)
A) U,σ
B) U,ε
C) σ,ε
D) None of these
The correct Answer is:B
U=12σε=12(Yε)ε
⇒U=12Yε2 is similar to x =ky2
Which is a parabola passing through origin and symmetric about x-axis.
Topper's Solved these Questions
- ELASTICITYBOOK - DC PANDEYCHAPTER - ELASTICITYEXERCISE - Level 1 Subjective
8 Videos
- ELASTICITYBOOK - DC PANDEYCHAPTER - ELASTICITYEXERCISE - Level 2 Single Correct
10 Videos
- ELASTICITYBOOK - DC PANDEYCHAPTER - ELASTICITYEXERCISE - Assertion And Reason
22 Videos
- CURRENT ELECTRICITYBOOK - DC PANDEYCHAPTER - CURRENT ELECTRICITYEXERCISE - All Questions
434 Videos
- ELECTROSTATICSBOOK - DC PANDEYCHAPTER - ELECTROSTATICSEXERCISE - Integer
17 Videos
Similar Questions
When a uniform metallic wire is stretched the lateral strain produced in it is beta .if sigma and Y are the Poisson's ratio and Young's modulus for wire, then elastic potential energy density of Wire is
View SolutionThe figure shows the y–x graph at an instant for a small amplitude transverse wave travelling on a stretched string. Three elements (1, 2 and 3) on the string have equal original lengths (=Δx). At the given instant-
(i) which element (among 1, 2 and 3) has largest kinetic energy?
(ii) which element has largest energy (i.e., sum of its kinetic and elastic potential energy)
(iii) Prove that energy per unit length ΔEΔx of the string is constant everywhere equal to T(∂y∂x)2 where T is tension the string.

View Solution
Knowledge Check
The graph show the behaviour of a length of wire in the region for which the substances obeys Hooke's law. P and Q represent
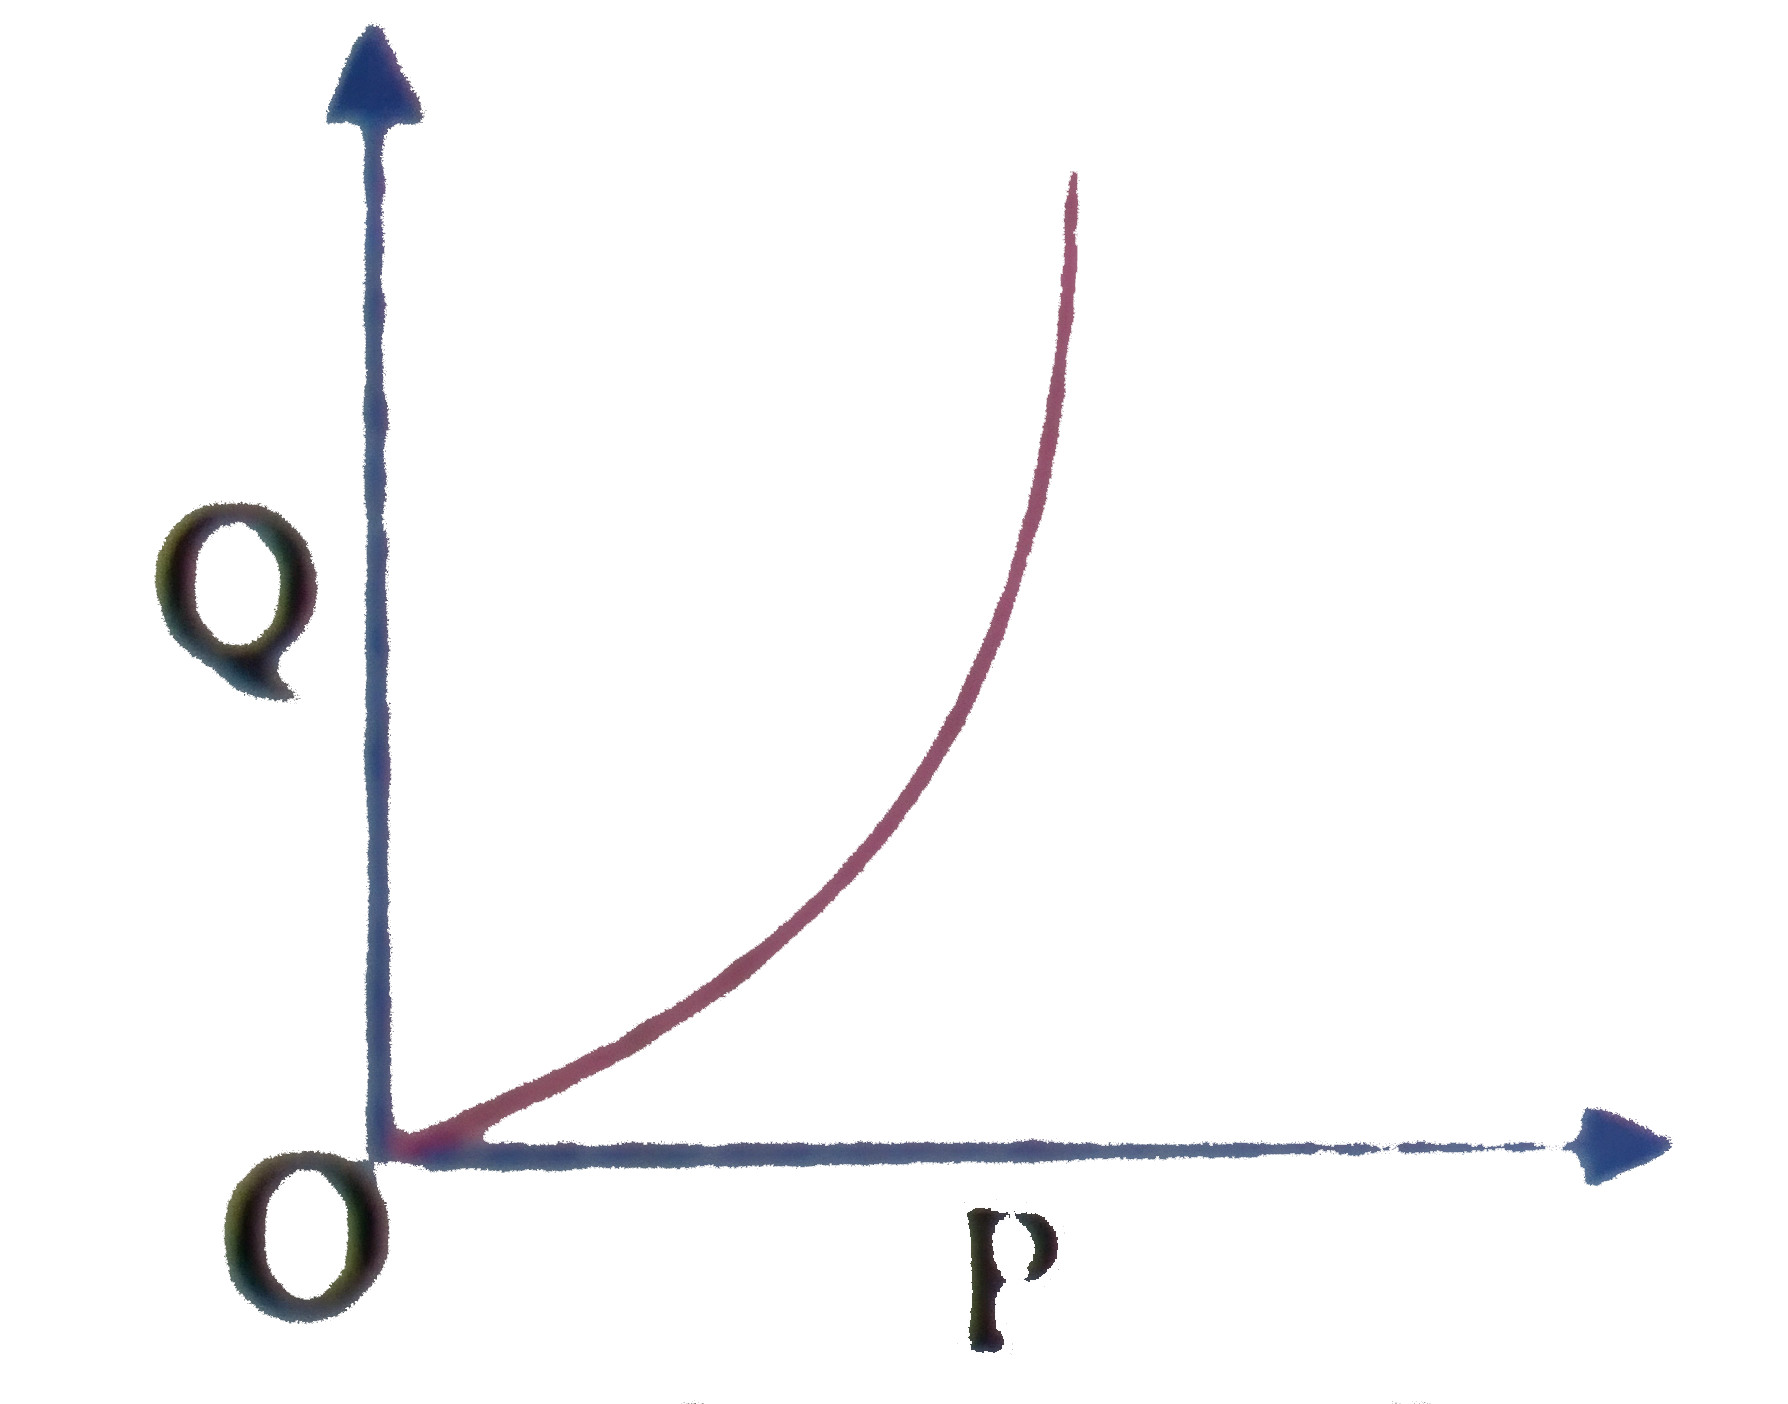 AP = applied force, Q = extensionBextension, applied forceCextension, stored elastic energyDstored elastic energy, extension
The graph shows the behaviout of a length of wire in the region for which the substance obeys Hook's law. D and Q represent
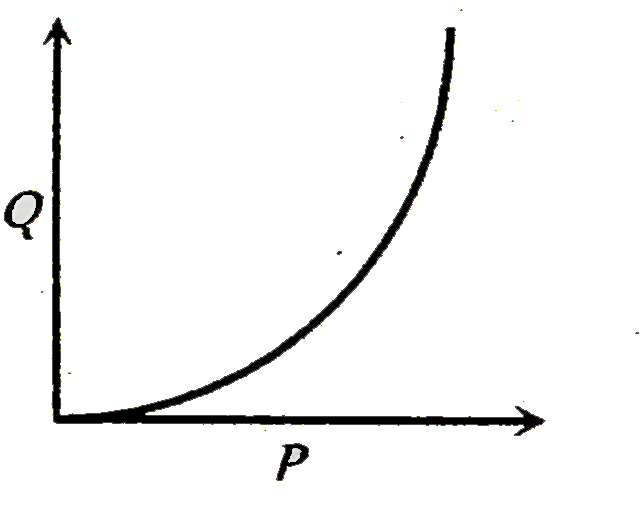 AP = applied force, Q = extensionBP = extension, Q = applied forceCP = extension, Q= stored elastic energyDP = stored elastic energy, Q = extension
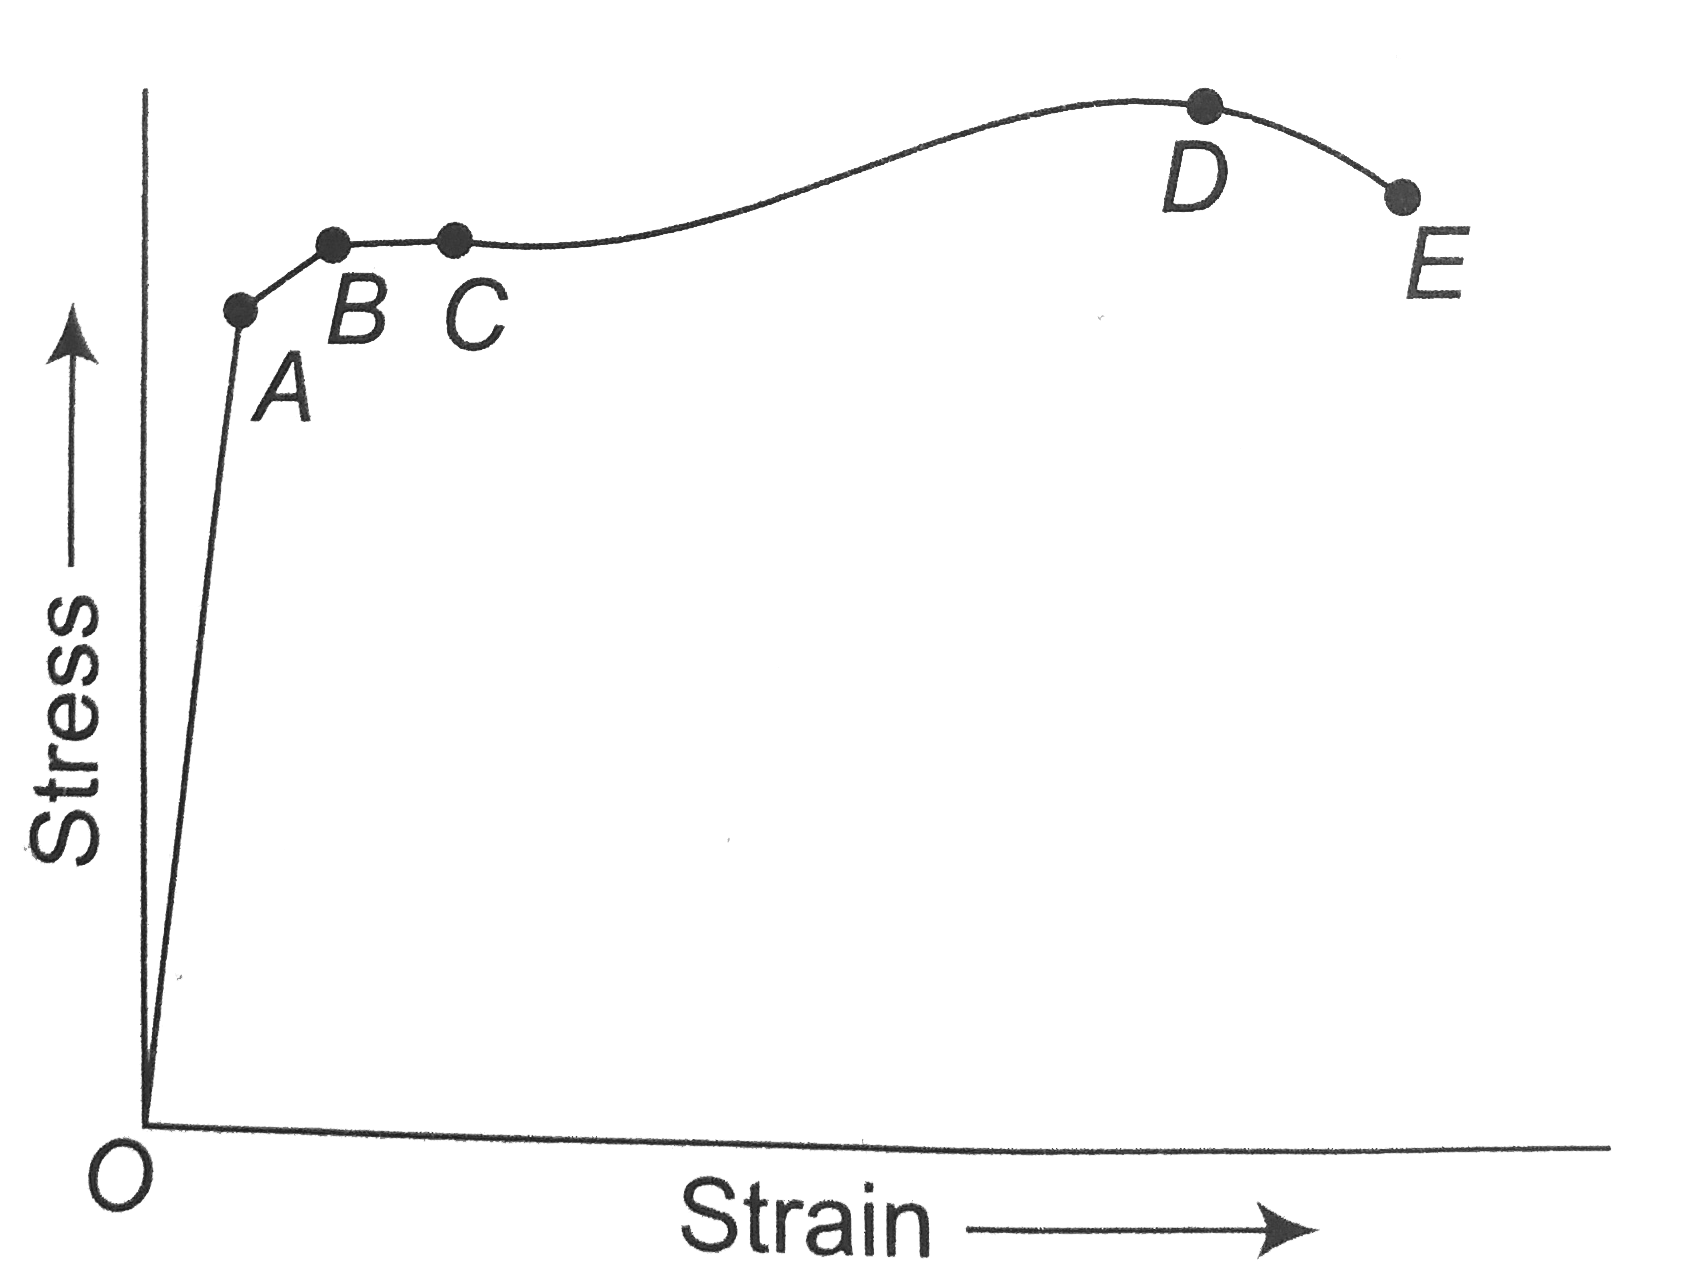
The stress strain graph for a metal wire is as shown in the figure. In the graph, the region in which Hooke's law is obeyed, the ultimate strength and fracture are represented byAOA,C,DBOB,D,ECOA,D,EDOB,C,D
The following plot shows the variation of potential energy (U) of a system versus position (x). From the graph we can interpret that :
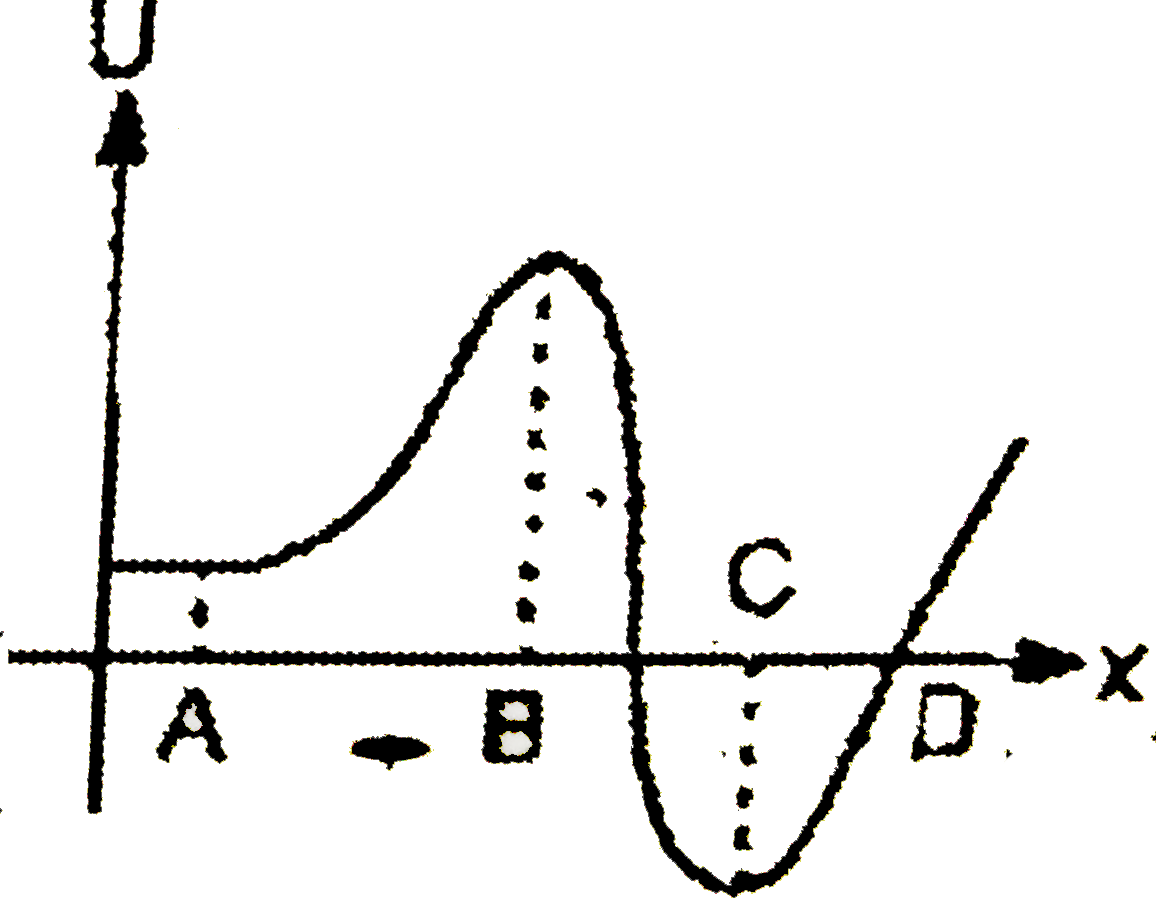
View SolutionFigure shows the relationship between tensile stress and strain for a typical material. Below proportional point A, stress is directly proportional to strain which means Young's moudulus (Y) is a constant. In this region the material obeys Hooke's law.
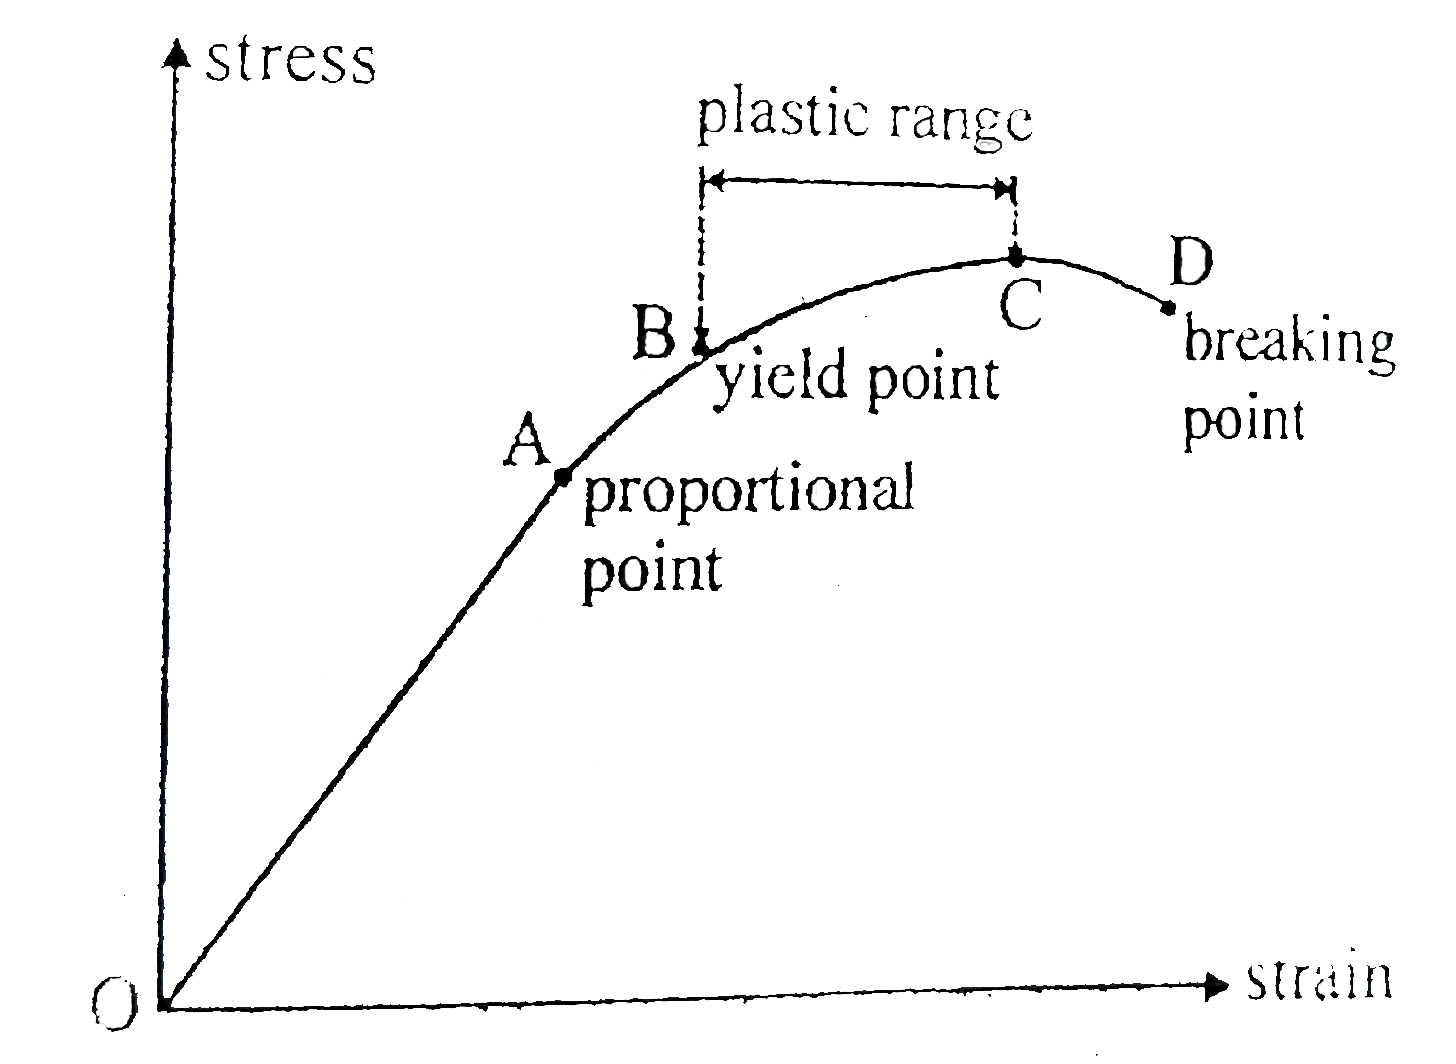
Provided the strain is below the yield point 'B' the material returns to its original shape and size when the force is removed. Beyond the yield point, the material retains a permancnt deformation after the stress is removed. For stresses beyond the yeld point, the material exhibit plastic flow, which means that it continues to elongate for little increases in the stress. Beyond C a local constriction occurs. The material fractures at D (i.e. breaking point). The graph below shows the stress-strain curve for 4 different materials.
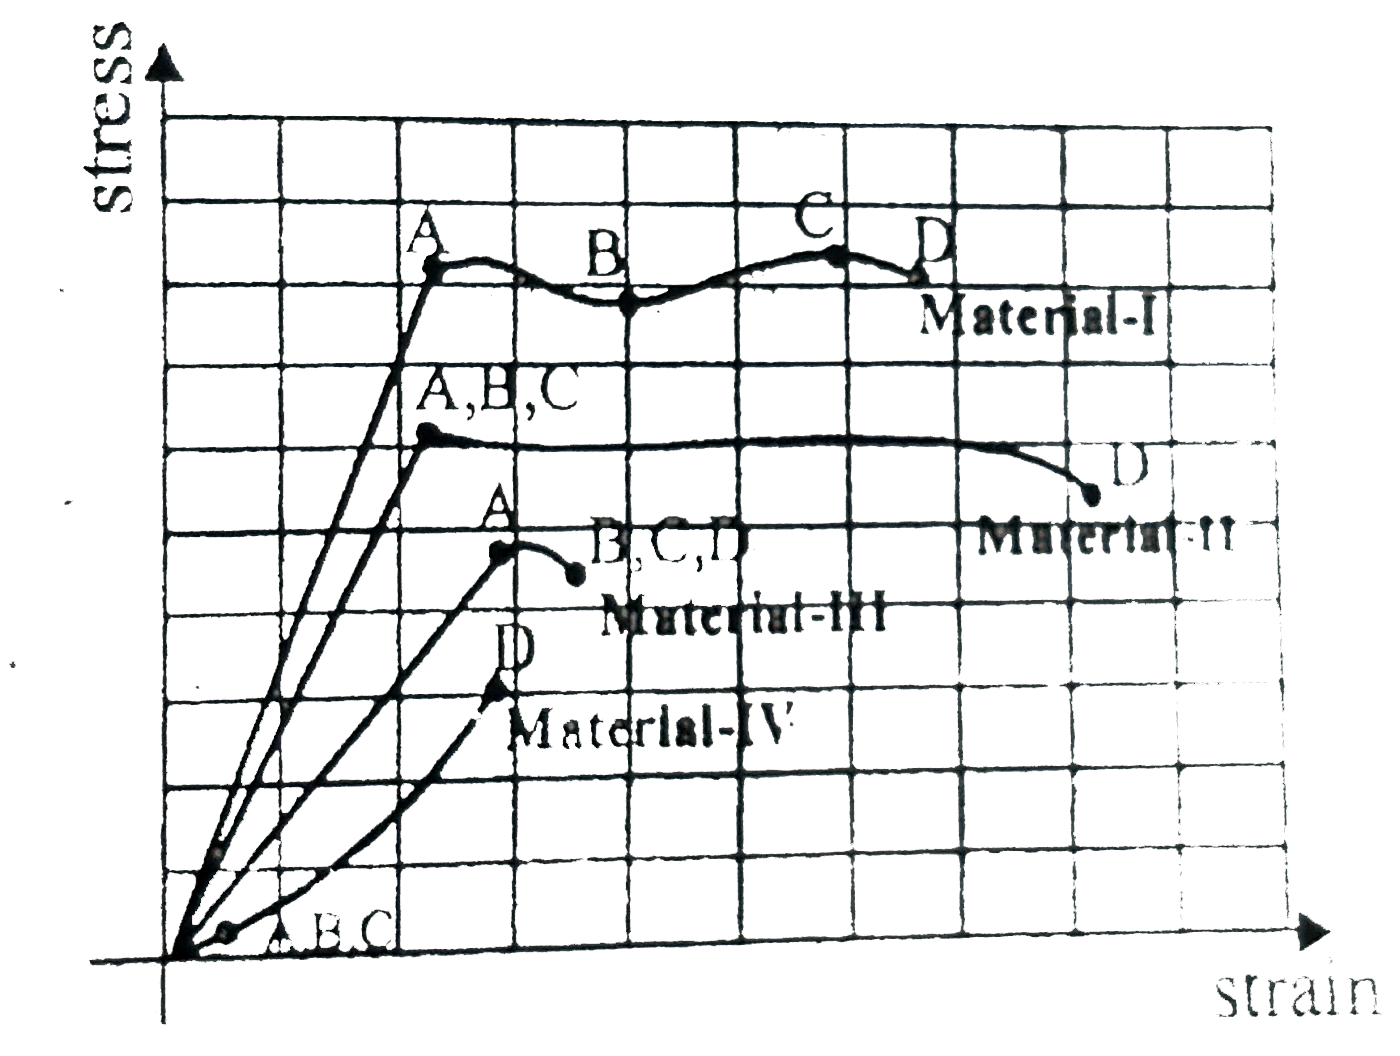
Material which is good for making wires by stretching is
View SolutionFigure shows the relationship between tensile stress and strain for a typical material. Below proportional point A, stress is directly proportional to strain which means Young's moudulus (Y) is a constant. In this region the material obeys Hooke's law.
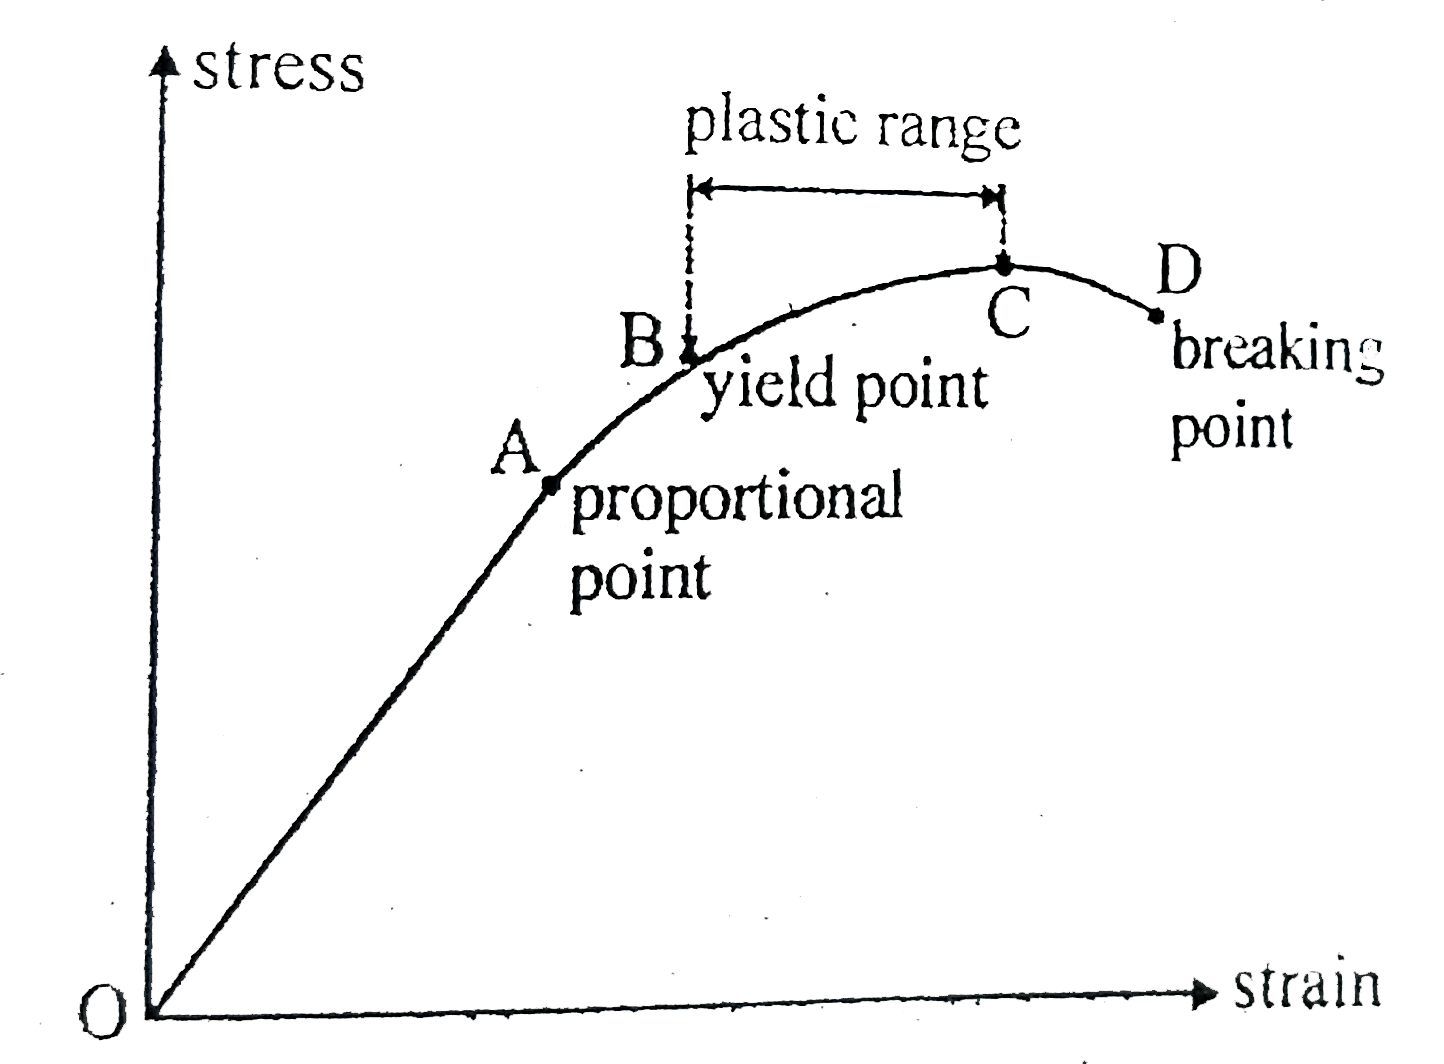
Provided the strain is below the yield point 'B' the material returns to its original shape and size when the force is removed. Beyond the yield point, the material retains a permancnt deformation after the stress is removed. For stresses beyond the yeld point, the material exhibit plastic flow, which means that it continues to elongate for little increases in the stress. Beyond C a local constriction occurs. The material fractures at D (i.e. breaking point). The graph below shows the stress-strain curve for 4 different materials.
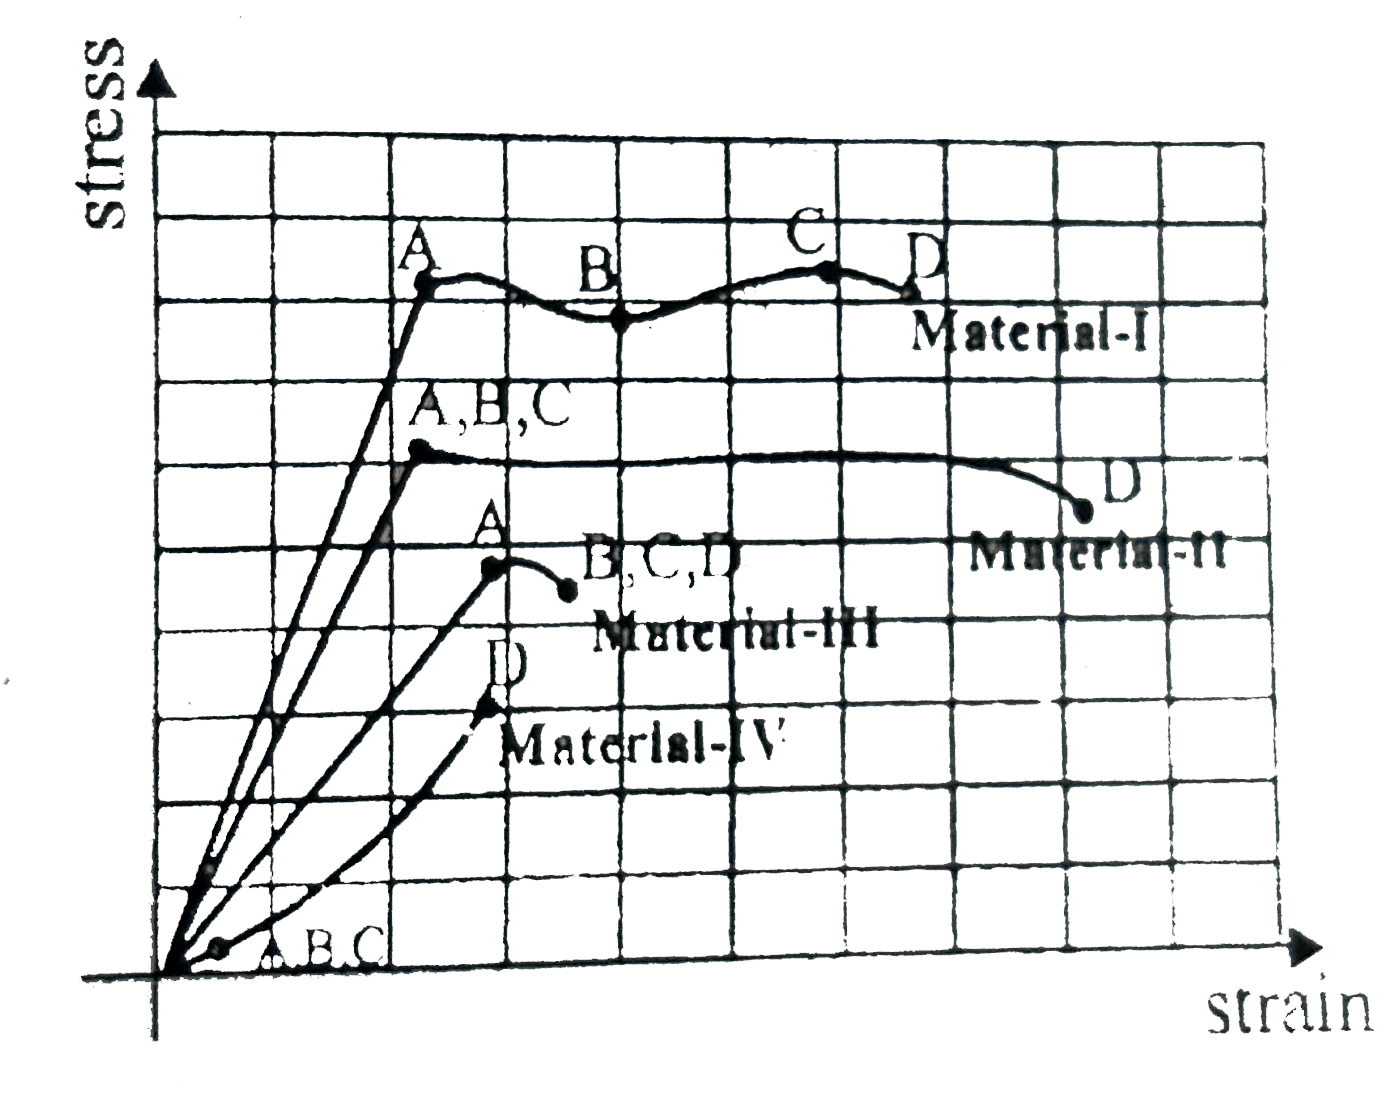
Material which is most brittle is
View SolutionFigure shows the relationship between tensile stress and strain for a typical material. Below proportional point A, stress is directly proportional to strain which means Young's moudulus (Y) is a constant. In this region the material obeys Hooke's law.
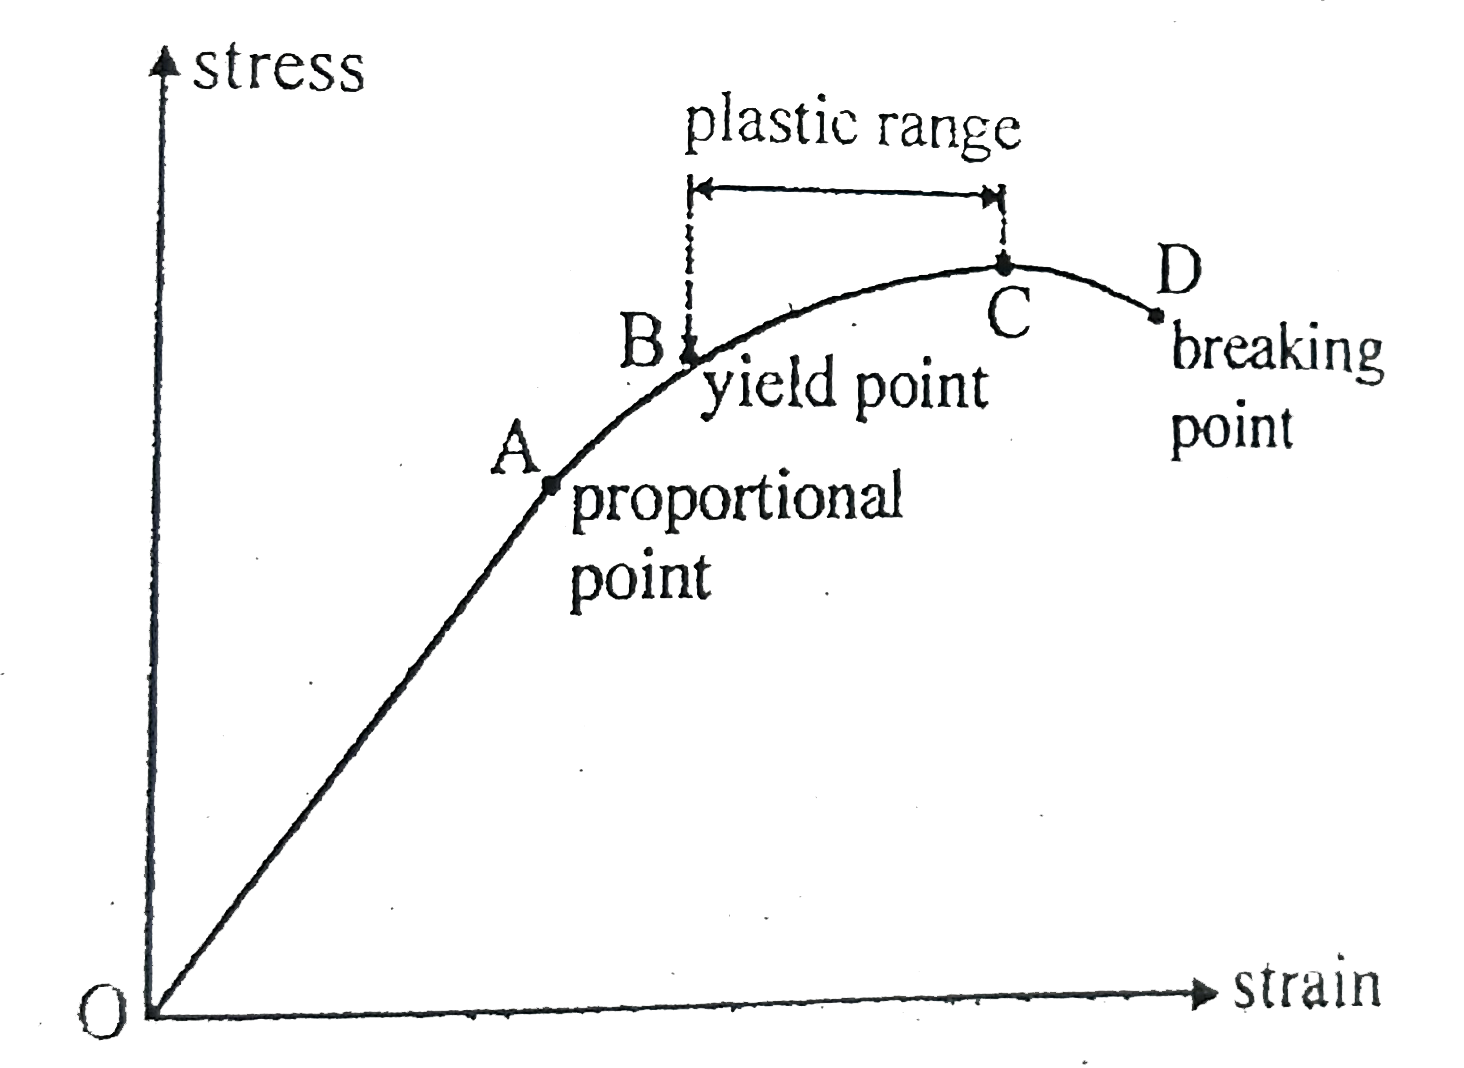
Provided the strain is below the yield point 'B' the material returns to its original shape and size when the force is removed. Beyond the yield point, the material retains a permancnt deformation after the stress is removed. For stresses beyond the yeld point, the material exhibit plastic flow, which means that it continues to elongate for little increases in the stress. Beyond C a local constriction occurs. The material fractures at D (i.e. breaking point). The graph below shows the stress-strain curve for 4 different materials.
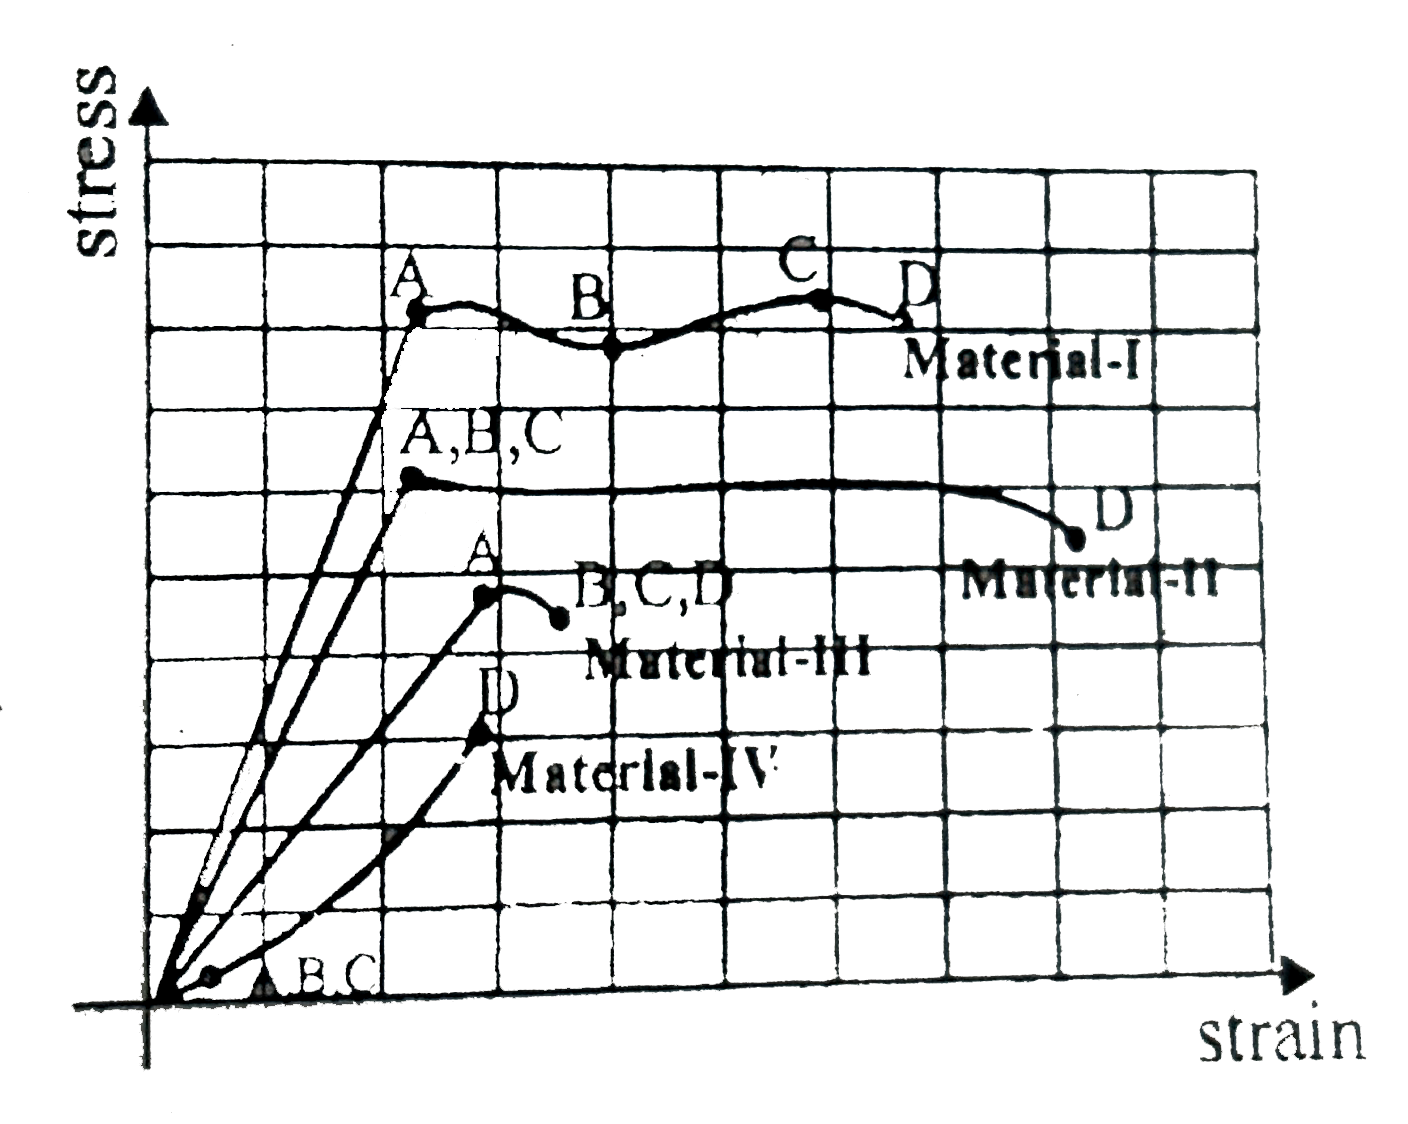
If you bough a new shoe which bites in the beginning and later on fits perfectly, then the material used to making the shoe is
View SolutionAccording to Hooke's law, within the elastic limit stress/strain = constant. This constant depends on the type of strain or the type of force acting. Tensile stress might result in compressional or elongative strain, however, a tangential stress can only cause a shearing strain. After crossing the elastic limit, the material undergoes elongation and beyond a stage beaks. All modulus of elasticity are basically constants for the materials under stress.
If stress/strain is x in elastic region and y in the region of yield, then
View Solution
