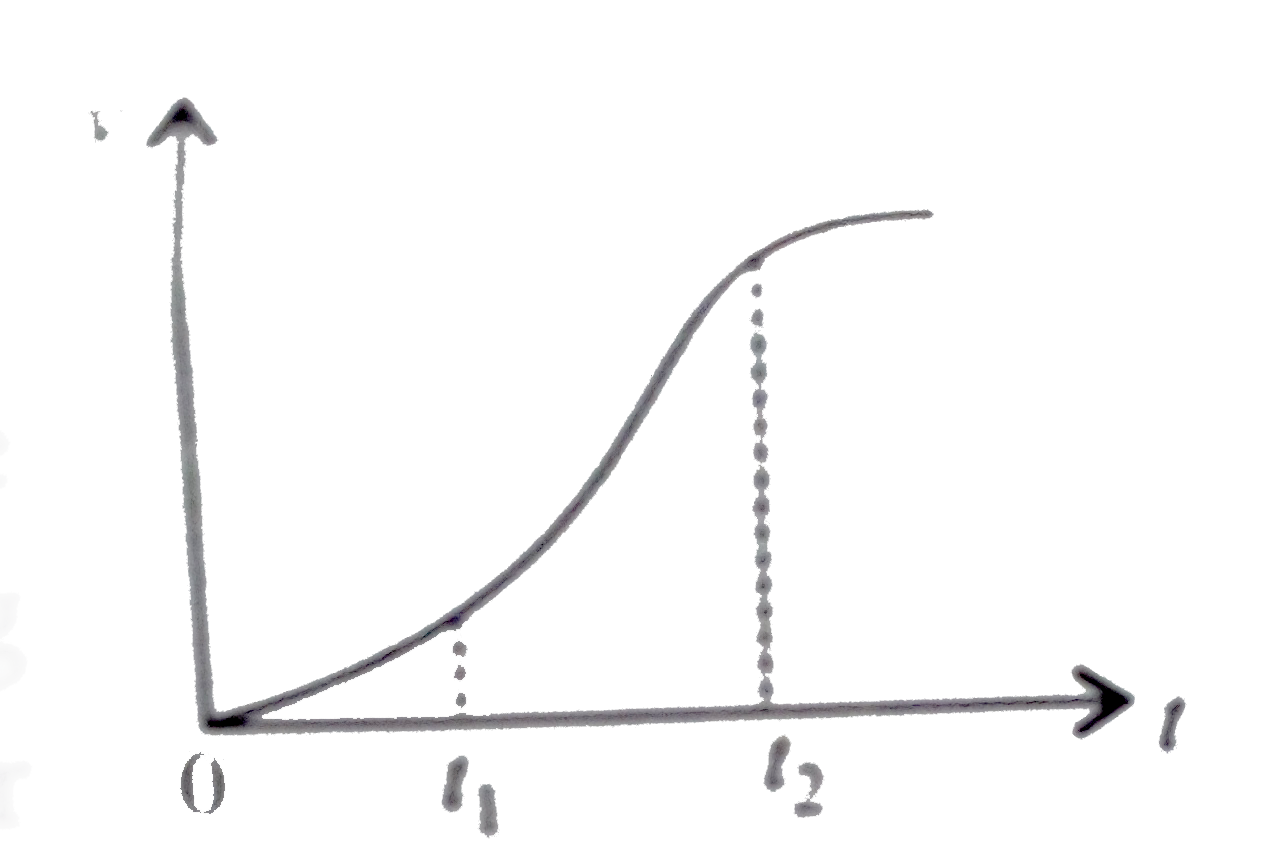
A graph is drawn between velocity and time for the motion of a particle. The area under the curve between the time intervalst1andt2 gives
Momentum of the particle
Displacement of the particle
Acceleration of the particle
Change in velocity of the particle
The correct Answer is:B
To solve the question regarding the area under the velocity-time graph between the time intervals t1 and t2, we can follow these steps:
1. Understand the Graph:
- The graph in question is a velocity-time graph where the y-axis represents velocity (v) and the x-axis represents time (t).
2. Identify the Area Under the Curve:
- The area under the curve between the time intervals t1 and t2 represents a physical quantity.
3. Relate Area to Displacement:
- In physics, the area under a velocity-time graph gives the displacement of the particle. This is because displacement can be calculated as the integral of velocity with respect to time.
- Mathematically, this can be expressed as:
Displacement=∫t2t1vdt
- This integral represents the area under the curve from t1 to t2.
4. Conclusion:
- Therefore, the area under the velocity-time graph between the time intervals t1 and t2 gives the displacement of the particle.
Final Answer:
The area under the curve between the time intervals t1 and t2 gives the displacement of the particle.
- The graph in question is a velocity-time graph where the y-axis represents velocity (v) and the x-axis represents time (t).
- The area under the curve between the time intervals t1 and t2 represents a physical quantity.
- In physics, the area under a velocity-time graph gives the displacement of the particle. This is because displacement can be calculated as the integral of velocity with respect to time.
- Mathematically, this can be expressed as:
Displacement=∫t2t1vdt
- This integral represents the area under the curve from t1 to t2.
- Therefore, the area under the velocity-time graph between the time intervals t1 and t2 gives the displacement of the particle.
The area under the curve between the time intervals t1 and t2 gives the displacement of the particle.
Topper's Solved these Questions
- MOTION IN ONE DIMENSIONBOOK - ERRORLESSCHAPTER - MOTION IN ONE DIMENSIONEXERCISE - NCERT BASED QUESTIONS (UNIFORM MOTION )
24 Videos
- MOTION IN ONE DIMENSIONBOOK - ERRORLESSCHAPTER - MOTION IN ONE DIMENSIONEXERCISE - NCERT BASED QUESTIONS (NON-UNIFORM MOTION )
104 Videos
- KINETIC THEORY OF GASES BOOK - ERRORLESSCHAPTER - KINETIC THEORY OF GASES EXERCISE - ASSERTION AND REASON
16 Videos
- MOTION IN TWO DIMENSIONBOOK - ERRORLESSCHAPTER - MOTION IN TWO DIMENSIONEXERCISE - ASSERTION & REASON
19 Videos
Similar Questions
Knowledge Check
In problem43, number of atoms decayed between time interval t1 and t2 are
Aln(2)λ(R1R2)BR1e−λt2−R2e−λt2Cλ(R1−R2)DR1−R2λ)The area under the acceleration-time (a-t) graph gives
AAccelerationBDisplacementCVelocityDChange in velocityThe area under a velocity-time graph gives :
ADisplacementBChange in velocityCAccelerationDSpeed
The velocity-time graph of particle comes out to be a non-linear curve. The motion is
View SolutionWhich of the following statements is correct about the average velocity of a particle?
(The average stands for average of the quantity over the time interval , t1 to t2 )
View SolutionThe figure shows graph between velocity 'V' and displacement 'X' from mean position of a particle performing simple harmonic motion

The time period of motion of particle is:
View SolutionThe velocity-time graph of a particle in one-dimensional motion is shown in the figure. Which of the following formulae is correct for describing the motion of the particle over the time interval t1 to t2?

View SolutionThe area under velocity-time graph for a particle in a given interval of time represents
View Solution
