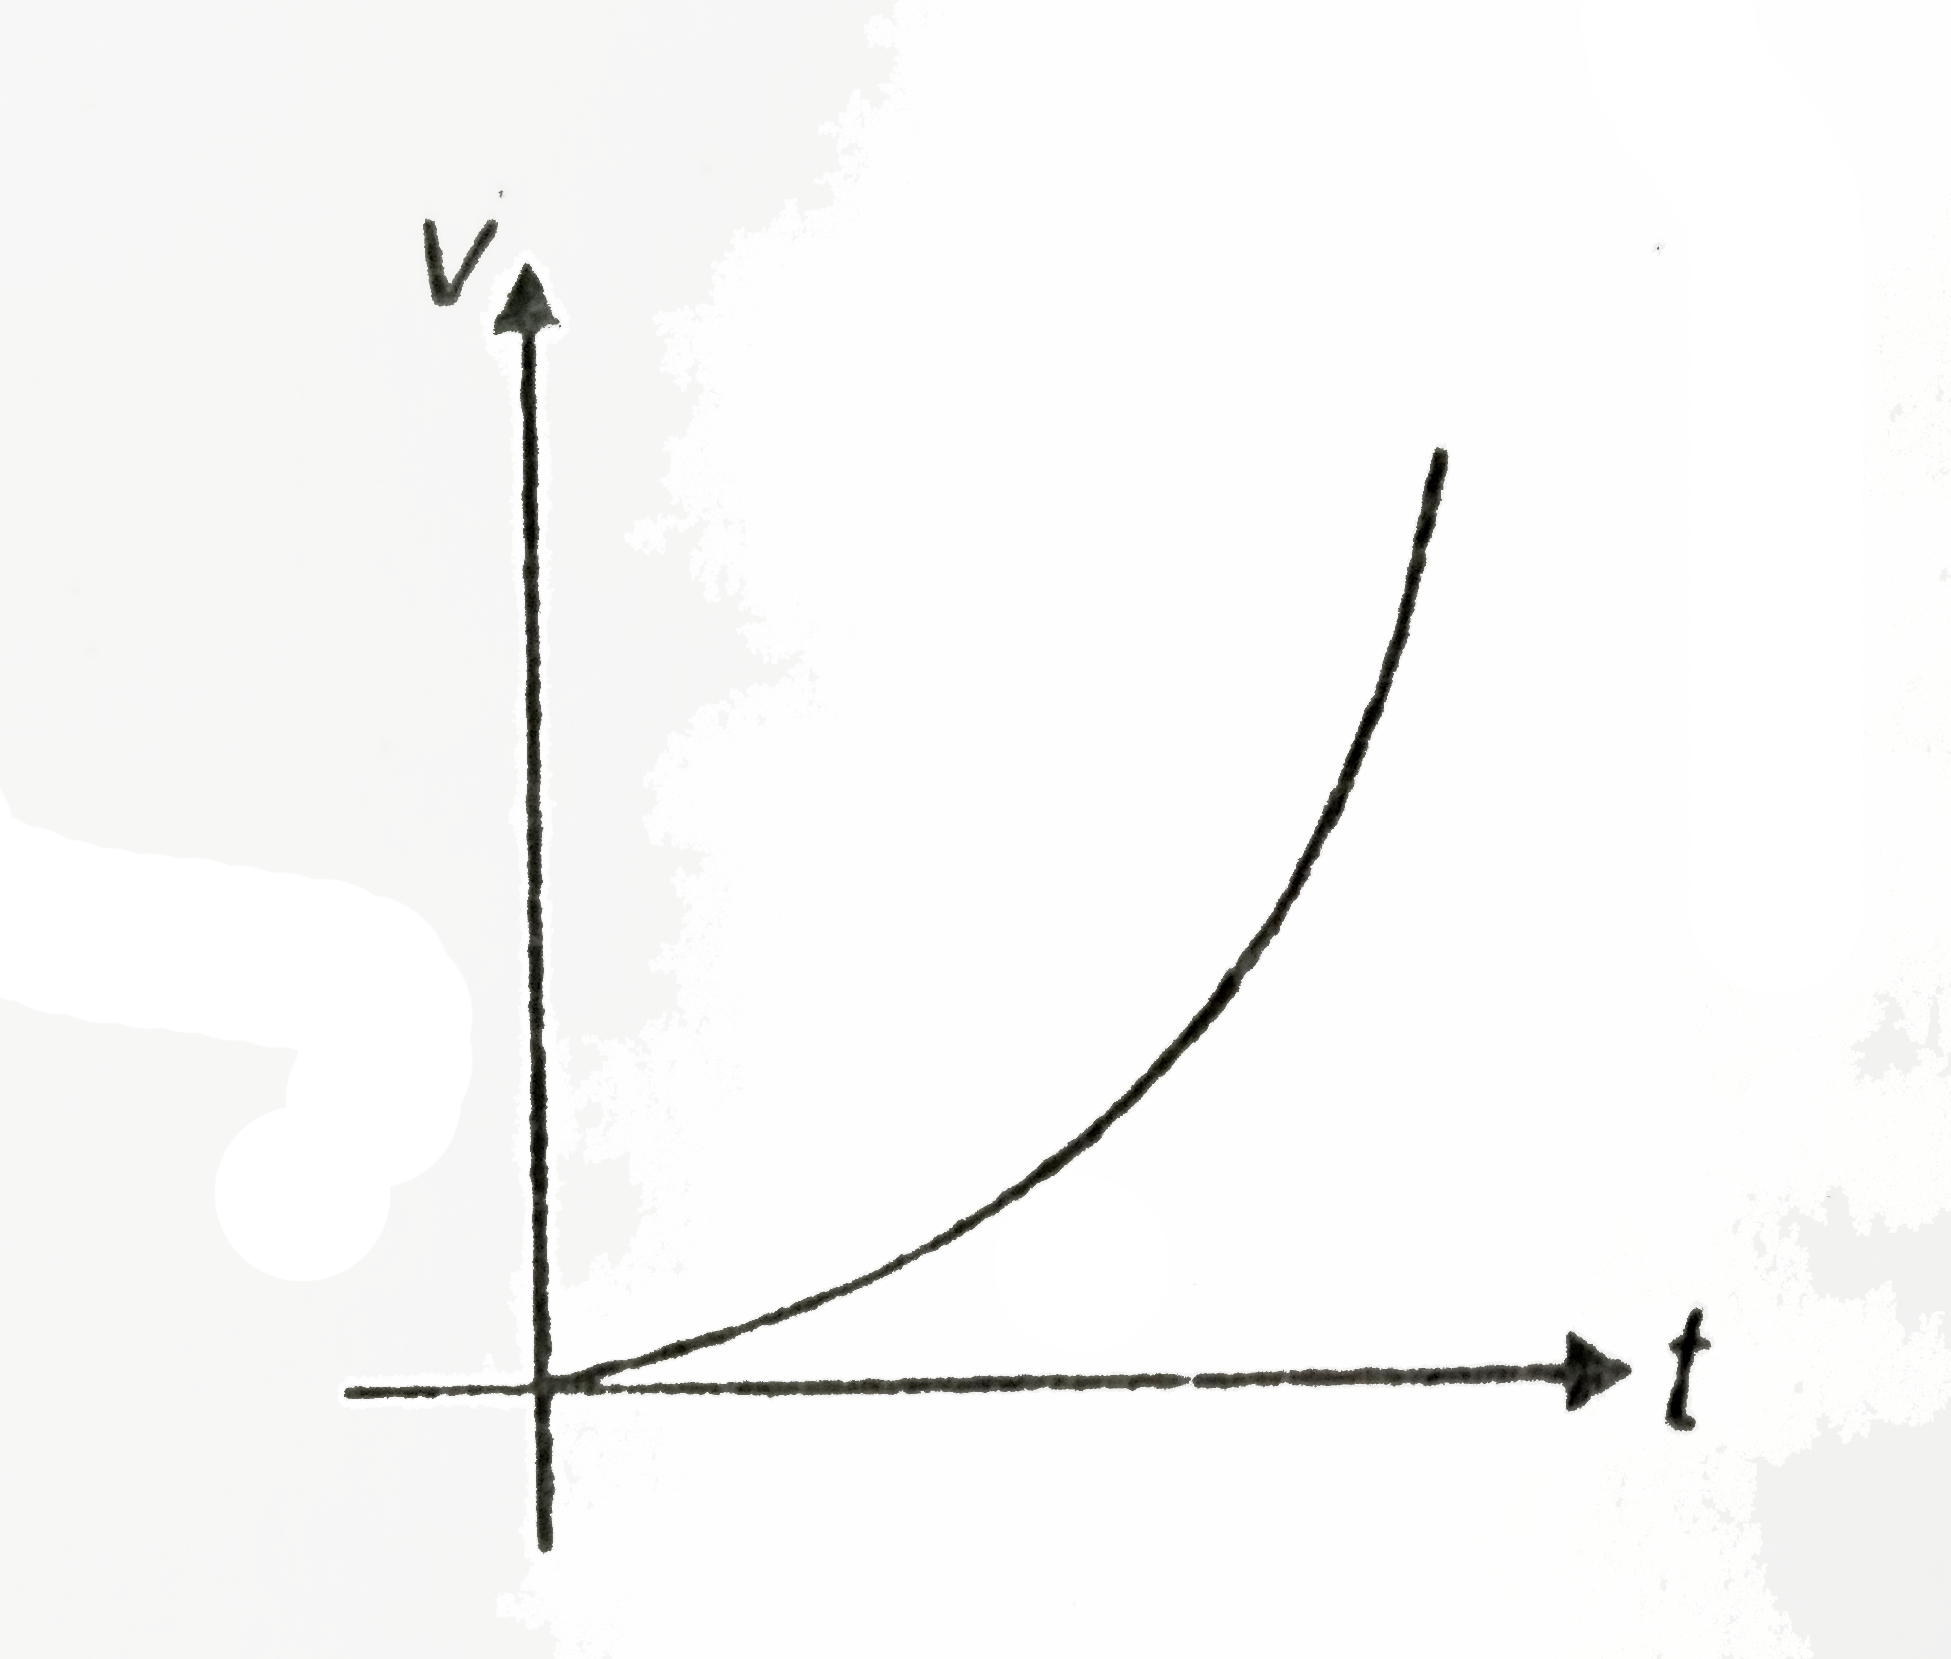
The velocity-time graph of particle comes out to be a non-linear curve. The motion is
uniform velocity motion
uniformly accelerated motion
non-uniform accelerated motion
Nothing can be said about the motion
The correct Answer is:C
Velocity - time graph gives the instaneous value of velocity at any instant. For non-uniformly accelerated motion, υ−t graph is non-liner.
Topper's Solved these Questions
- MOTION IN A PLANEBook:DC PANDEYChapter:MOTION IN A PLANEExercise:(B) Meical entrance special format questions (Mathch the columns)
Explore 6 Videos
- MOTIONBook:DC PANDEYChapter:MOTIONExercise:Medical entrances gallery
Explore 19 Videos
- PROJECTILE MOTIONBook:DC PANDEYChapter:PROJECTILE MOTIONExercise:Level - 2 Subjective
Explore 10 Videos
Similar Questions
Knowledge Check
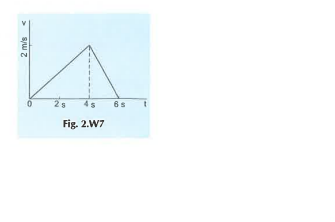
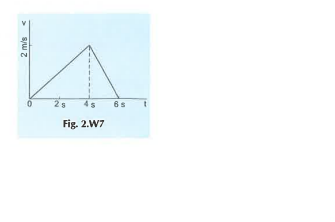
The velocity − time graph of a particle is as shown in figure
 AIt moves with a constant acceleration throughoutBIt moves with an acceleration of constant magnitude but changing direction at the end of every two secondCThe displacement of the particle is zeroDThe velocity becomes zero at t=4 second
The velocity - time graph of a particle of mass 10 kg is shown in the figure. The net work done on the particle in the first two seconds of the motion is
 A−9300JB12000JC−4500JD−12000J
The velocity time graph of the motion of a car is given here.
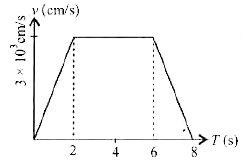 AThe distance travelled by the car in the first six seconds is 150 m.BThe deceleration of the car during the last two seconds are −15ms2.CThe distance travelled by the car in the first six second is 220 m.DThe deceleration of the car during the last two second is −20ms2
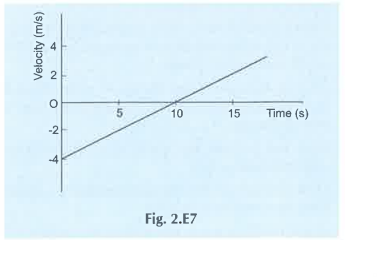
The velocity-time graph of a particle moving along a straight line is given in Figure 2E7.Does the particle ever come to rest ? If so , when ?
View SolutionGraphs are very useful to represent a physical situation. Various quantities can be easily represented on graphs and other quantites can be determined from the graph. For example the slope of velocity-time graph represents instantaneous acceleration. For a motion with constant acceleration slope of velocity-time graph is constant. If acceleration is changing with time, slope with change and thus velocity-time graph will be a non-linear curve. Further the area of velocity-time graph gives displacement.
For the given velocity-time graph the possibly correct acceleration-time relationship is
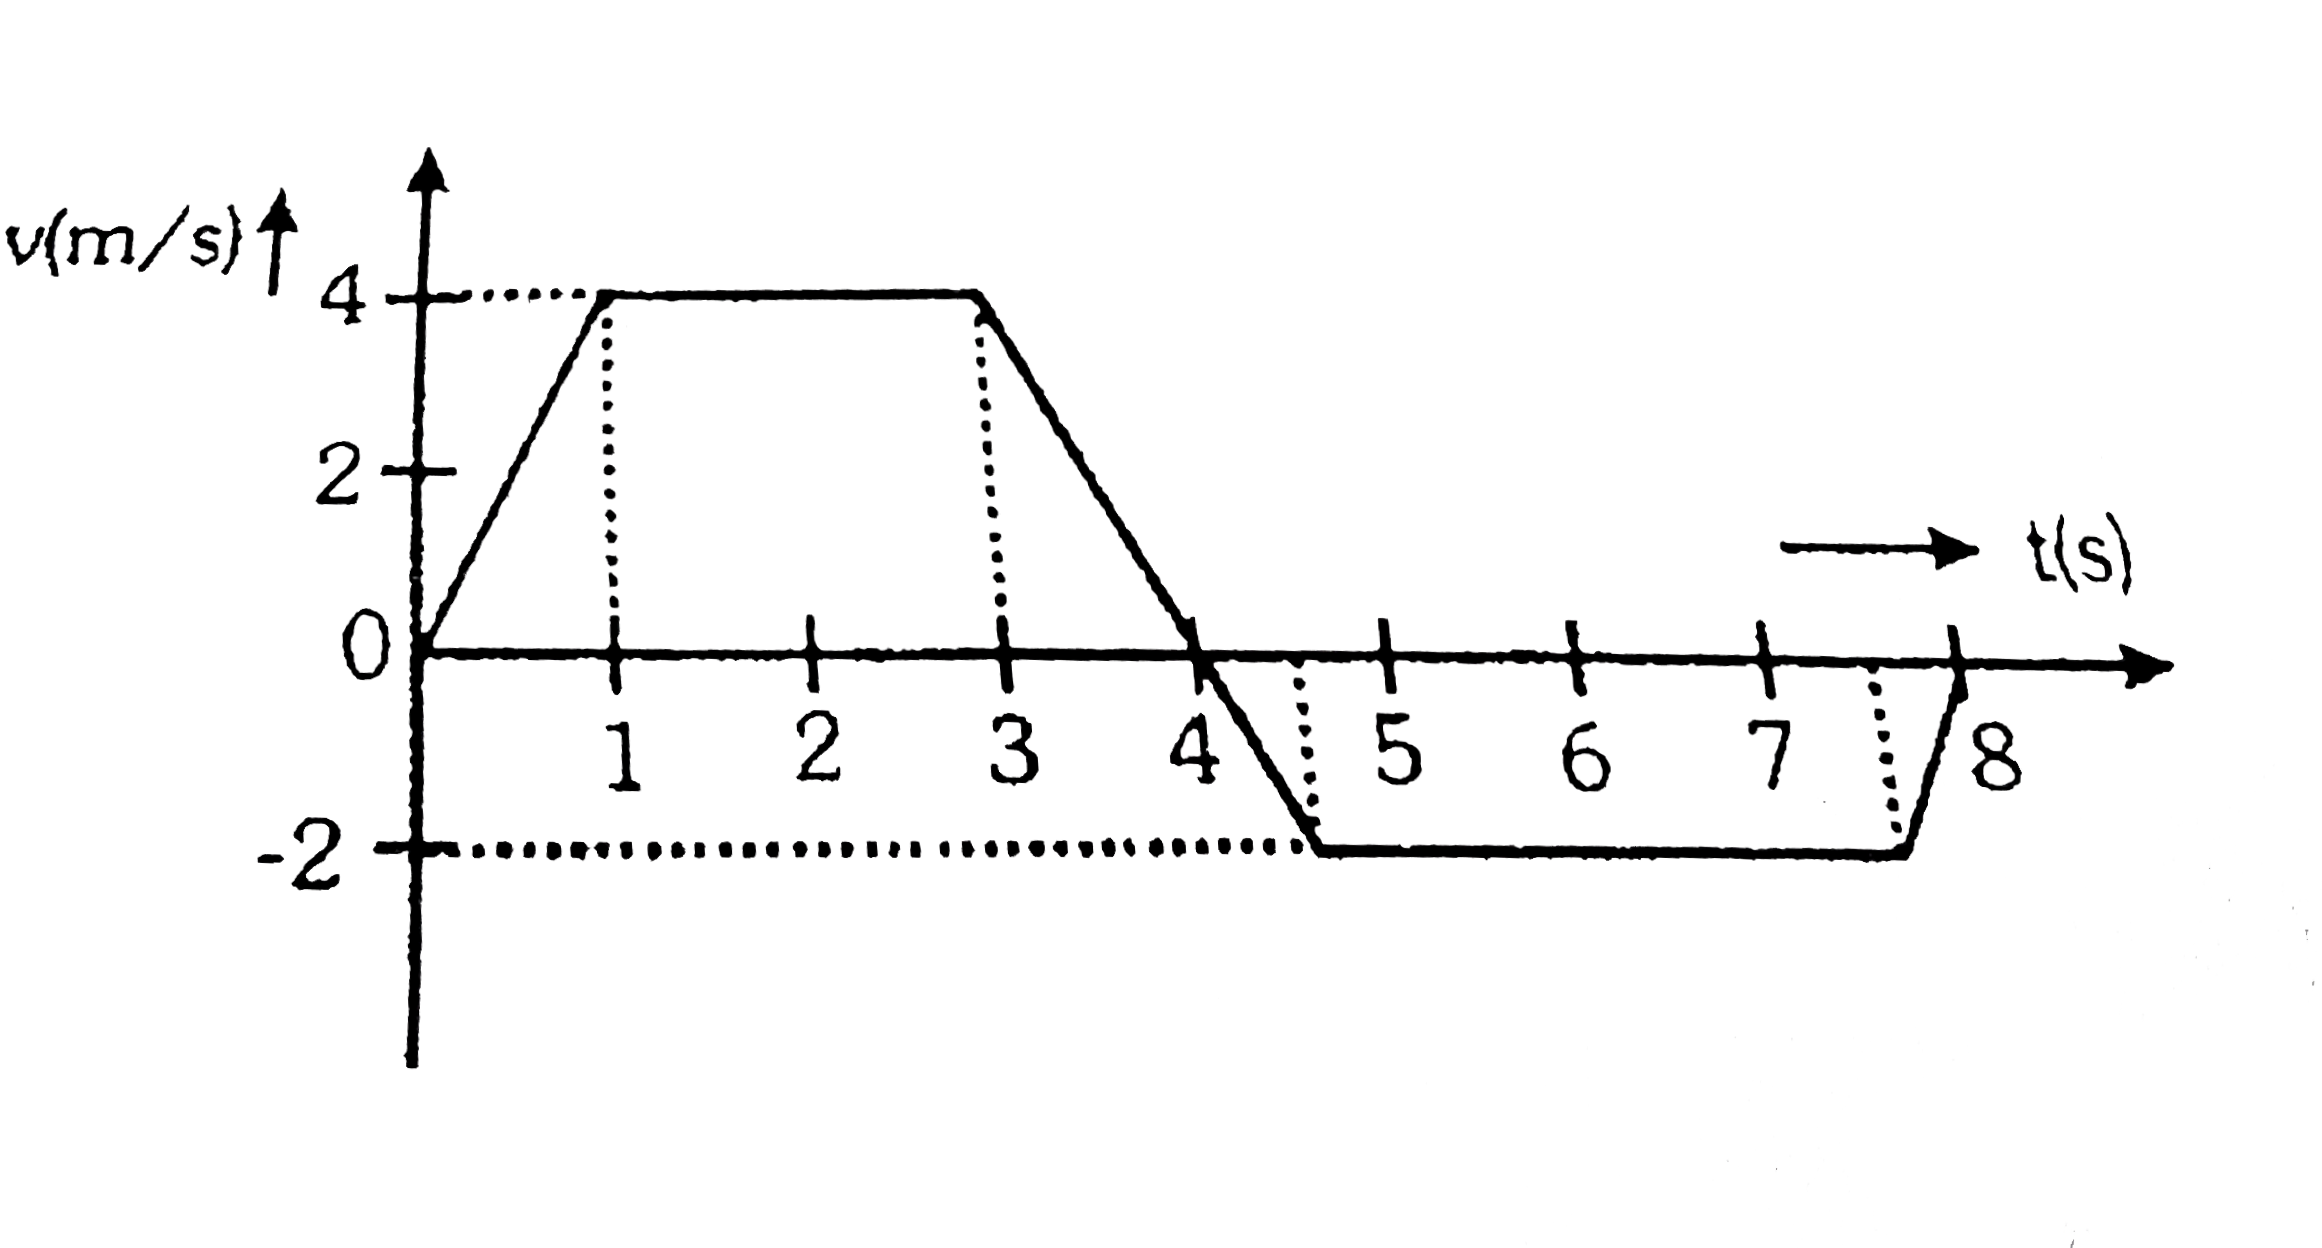
View SolutionThe velocity-time graph of a linear motion is shown in figure. The displacement & distance from the origin after 8 sec is :-
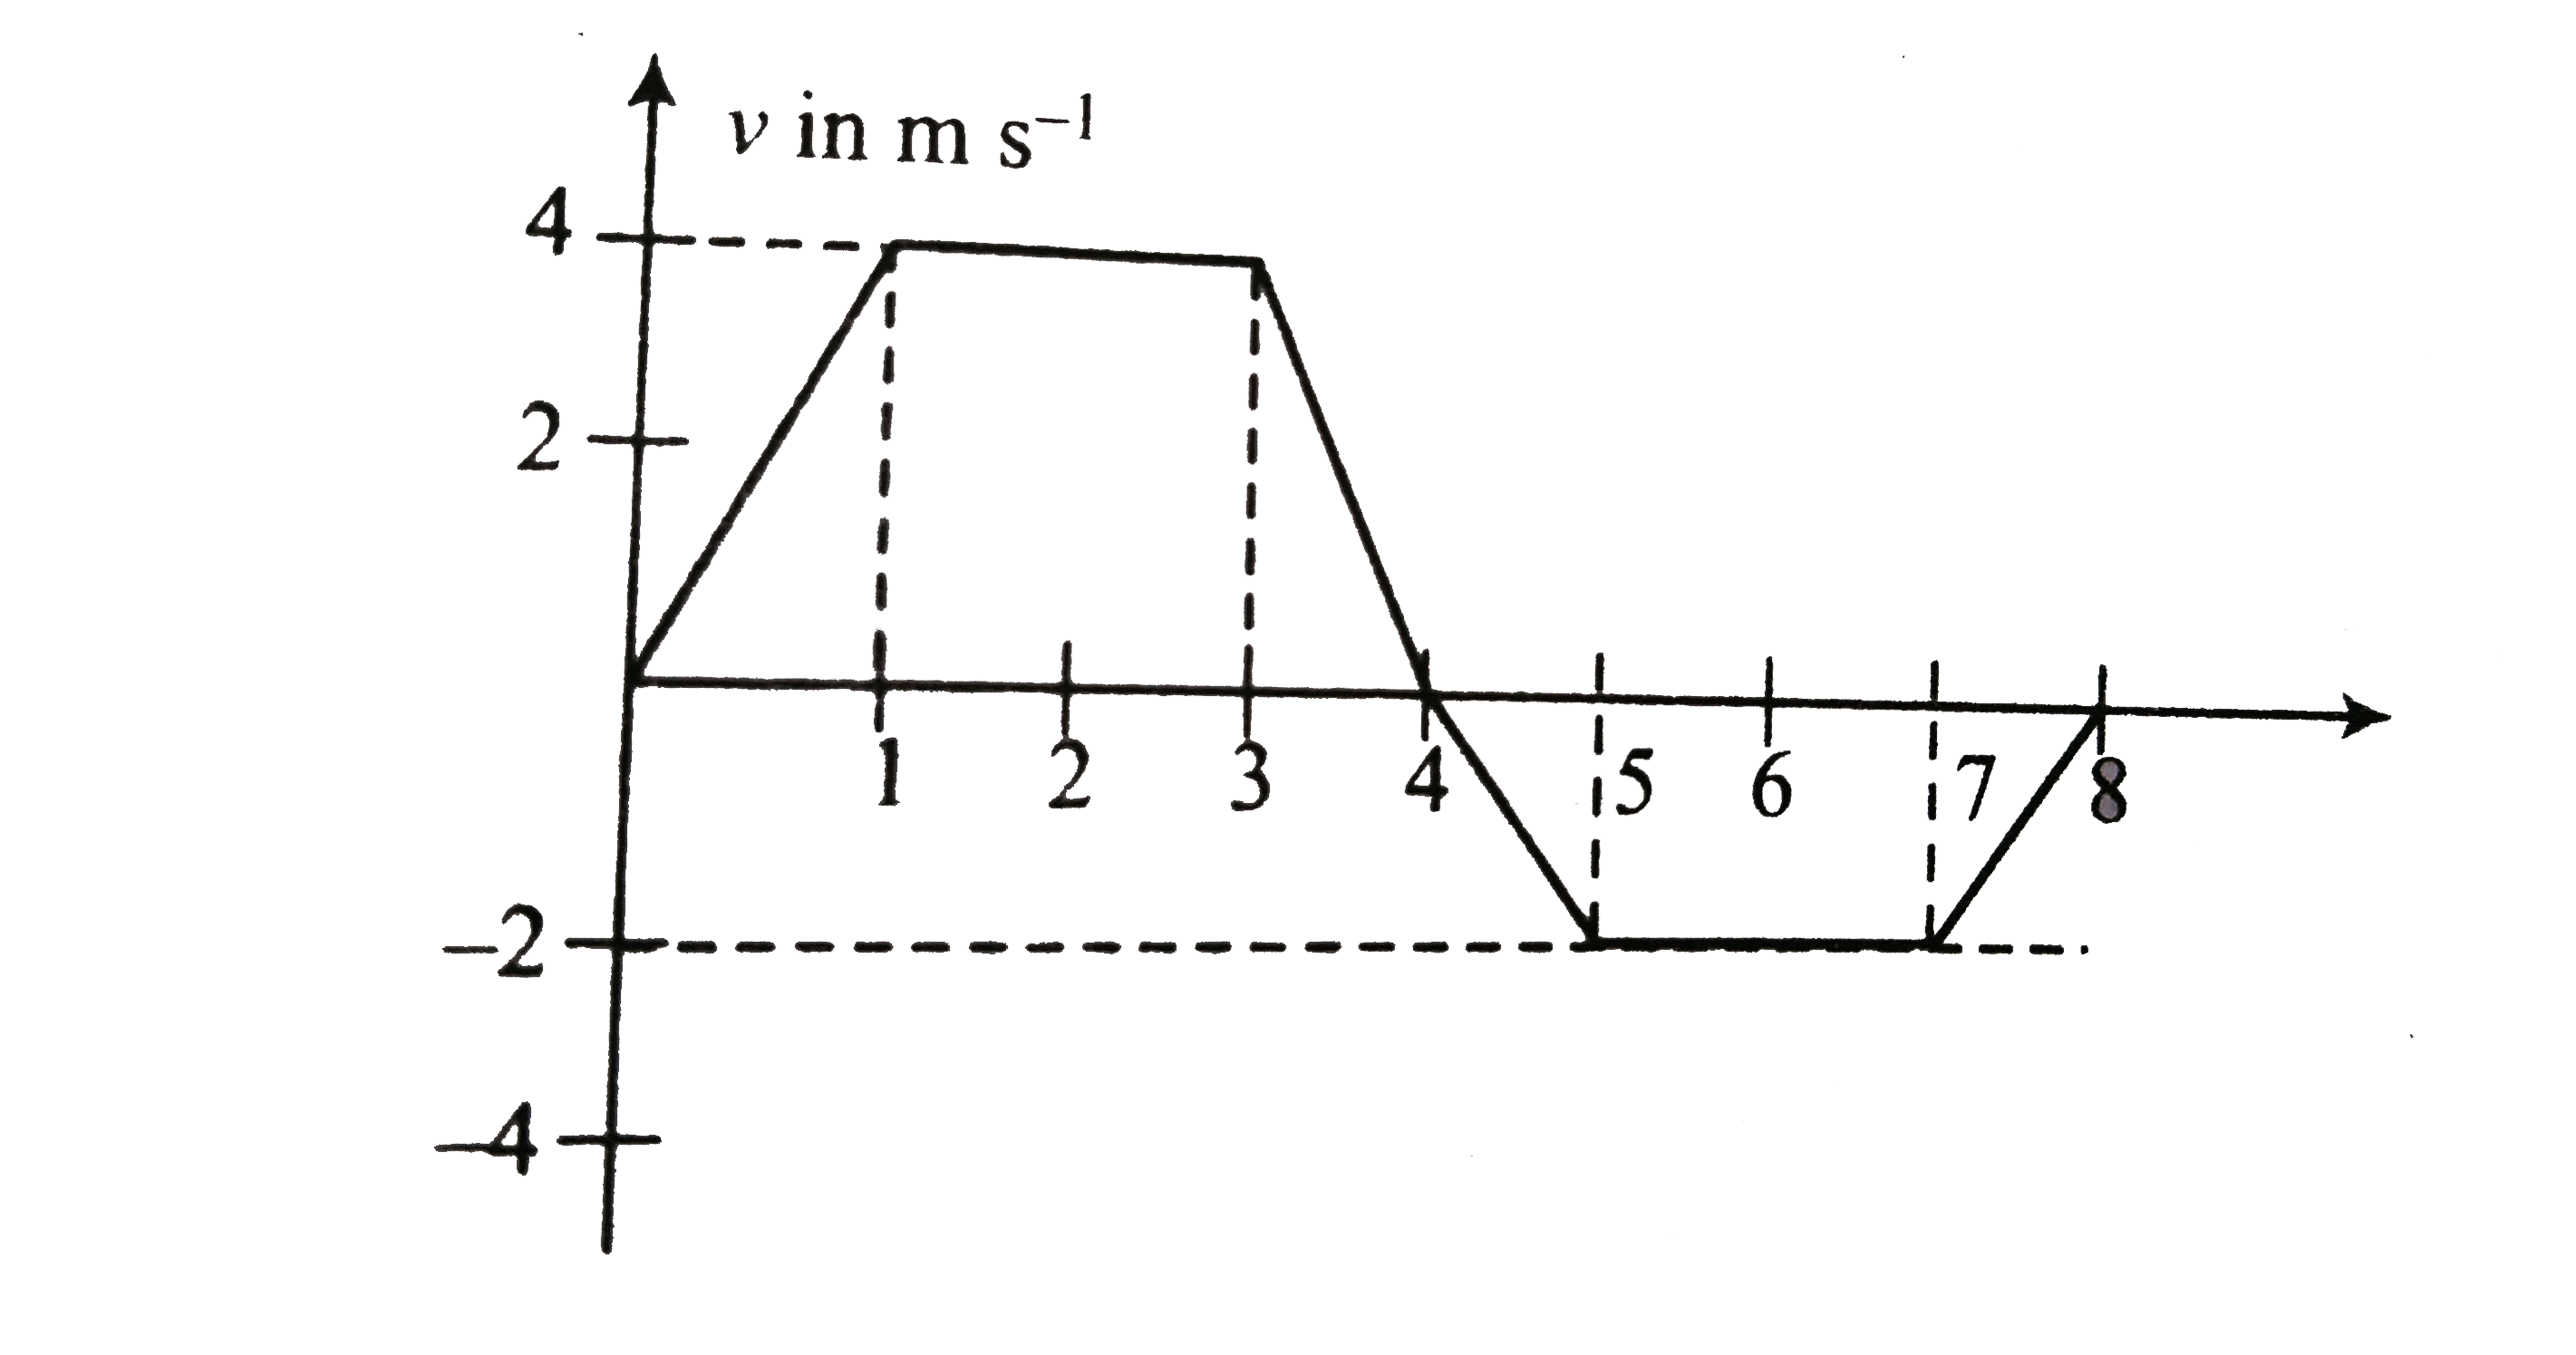
View SolutionThe velocity-time graph of a particle in straight line motion is veloity-time graph of a particle in straight line motion is shown in. The particle starts its motion from origin.
 .
.
The distance of the particle from the origin after 8s is .
View SolutionGraphs are very useful to represent a physical situation. Various quantities can be easily represented on graphs and other quantites can be determined from the graph. For example the slope of velocity-time graph represents instantaneous acceleration. For a motion with constant acceleration slope of velocity-time graph is constant. If acceleration is changing with time, slope with change and thus velocity-time graph will be a non-linear curve. Further the area of velocity-time graph gives displacement.
The average velocity of the car for the entire trip is
View Solution


