The graph given below shows the species-area relationship. Answer the following question as directed:
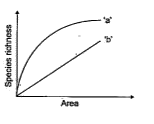
Write the situations as discovered by ecologists when the value of 'Z' (slope of line(s)) lies between 0.1 and 0.2 .
It shows unaffected distribution in an area. It is a normal range.
Similar Questions
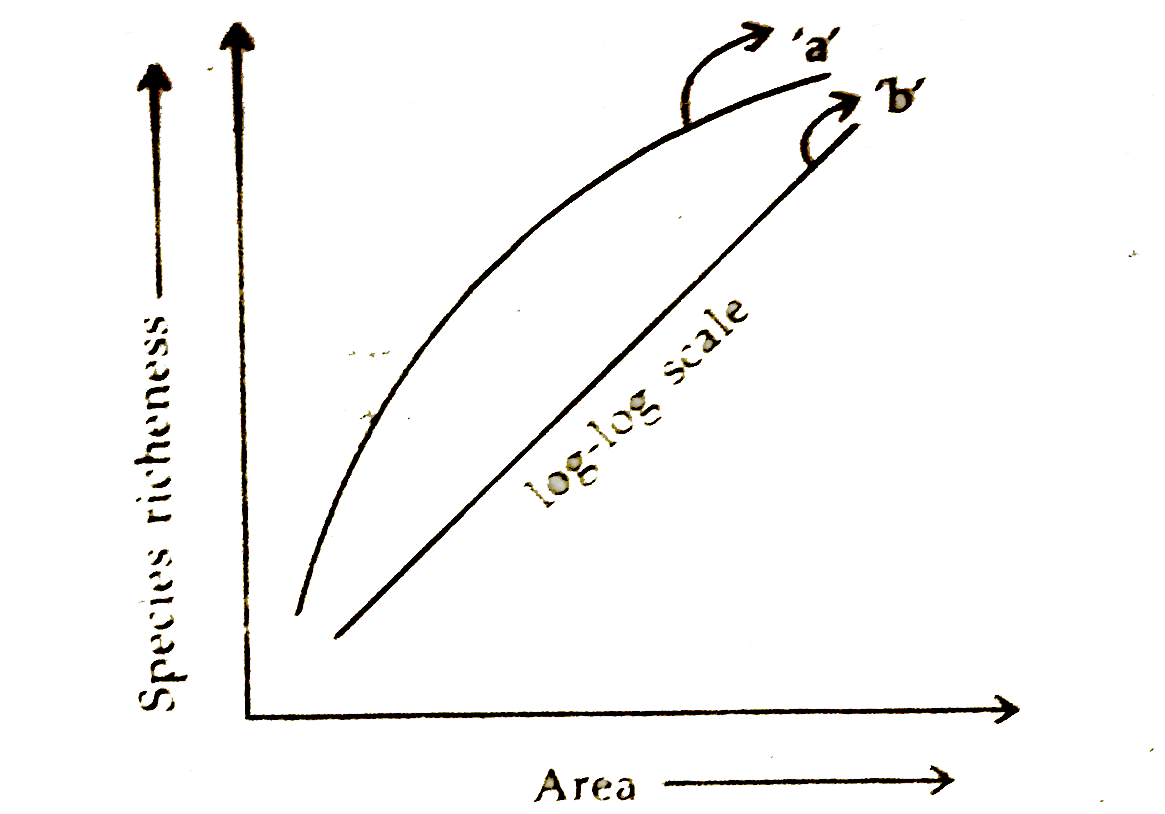
The following graph shows the species area relationship. Answers the Questions as directed.
(a) Name the naturalist who studied the kind of relationship shown in the graph.
Write the observations made by him.
(b) Write the situations as discovered by the ecologists when the value of 'Z' (slope of the line) lies between
(i) 0.1 and 0.2, (ii) 0.6 and 1.2
What does 'Z' stand for ?
(c ) When would the slope of the line 'b' become steeper ?
View Solution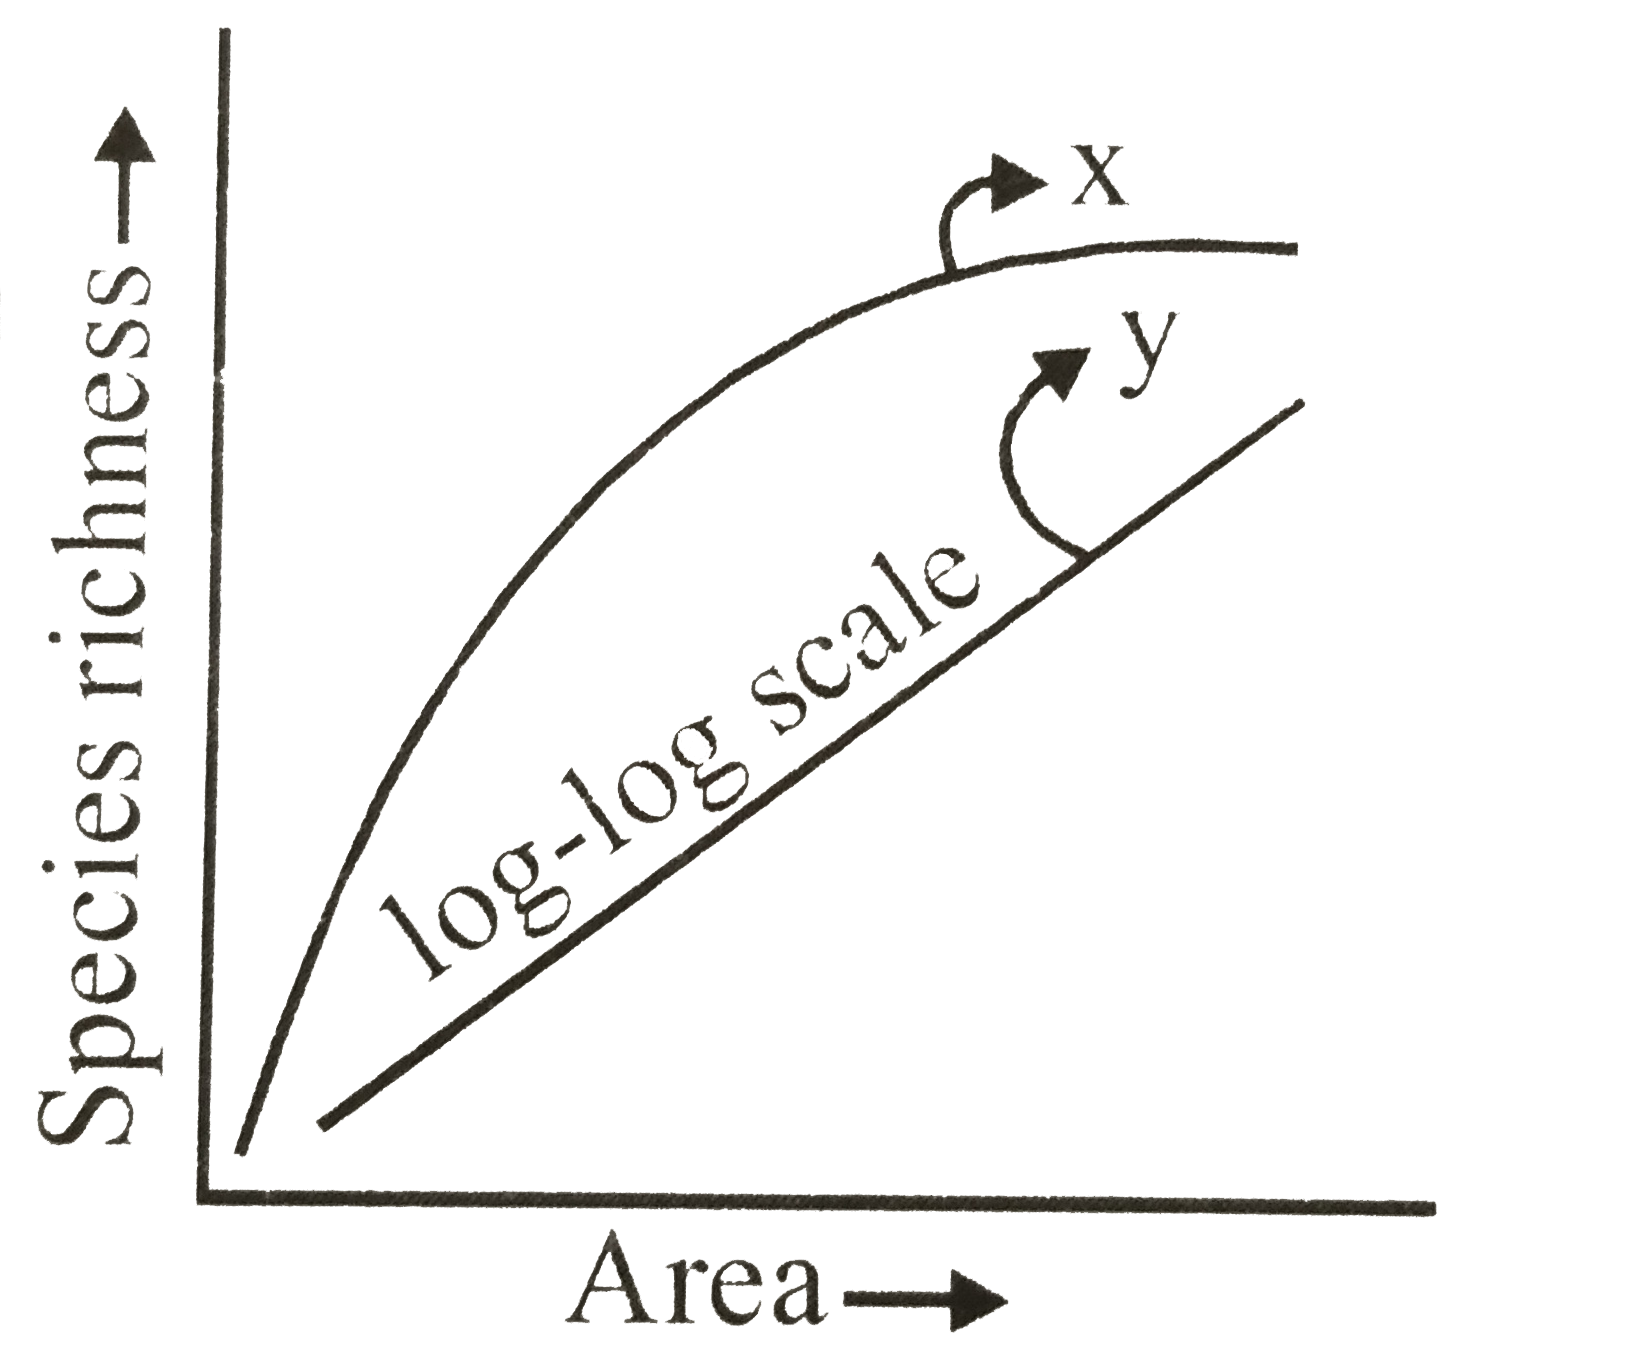
Study the above graph and answer the following questions -
(i) Identify x and y
(ii) The relation between species richness and area can be denoted as generally
(iii) The value of z lies in range of
(iv) On a log scale the relation between species richness and area is
View Solution
Knowledge Check
Consider the following question and decide which of the statements is sufficient to answer the question.
Question:
Find the value of m, slope of a line.
Statements:
1) y=mx+2
2) Line passes through (2, 1)AOnly statement 2 is sufficientBEither statement 1 or 2 is sufficientCOnly statement 1 is sufficientDBoth statements 1 and 2 are sufficientAssertion : If the species-area relationship are analysed among very large areas like the entire continents, the value of Z, i.e., slope of line in the range of 0.1 to 0.2.
Reason : The value of Z, i.e., slope of line of species area relationship lies in the range of 0.6 to 1.2 when analysis is done among small areas.AIf both assertion and reason are true and reason is the correct explanation of assertion.BIf both assertion and reason are true but reason is not the correct explanation of assertion.CIf assertion is true but reason is false.DIf both assertion and reason are false.Which, of the following statements is/are correct?
I, Theoretical value of Poisson’s ratio lies between −1 and +1/2
II. Practical value of Poisson's ratio lies between 0 and +1/2.AOnly IBOnly IIICI and IIDNone of the above
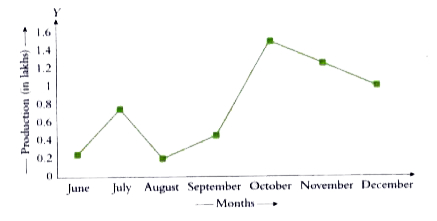
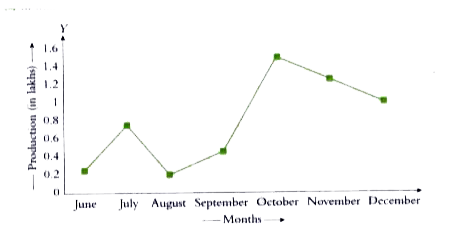
The line graph given below shows the production of a particular model of bike produced in different months. Read the line graph and answer the following questions:
In which month is the production least?
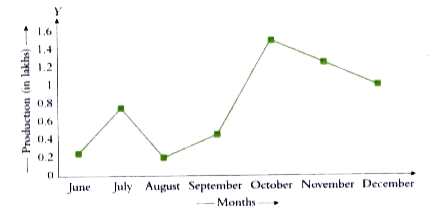
View SolutionThe line graph given below shows the production of a particular model of bike produced in different months. Read the line graph and answer the following questions:
In which two successive months has the production increased?
View SolutionThe line graph given below shows the production of a particular model of bike produced in different months. Read the line graph and answer the following questions:
In which two successive months has the production decreased?
View SolutionThe line graph shows the number of students of a certain university who passed in the given year in their final exams. Study the diagram and answer the following questions.
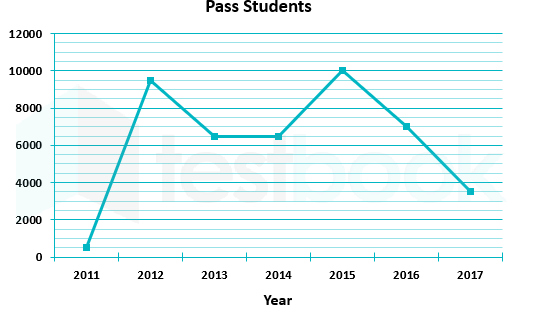
What was the difference in the number of students who passed between the years 2013 and 2016?
View SolutionRead the following information carefully and answer the questions given below
a+b+c=0 such that |a|=3,|b|=5and|c|=7
What is the angle between a and b?
View Solution