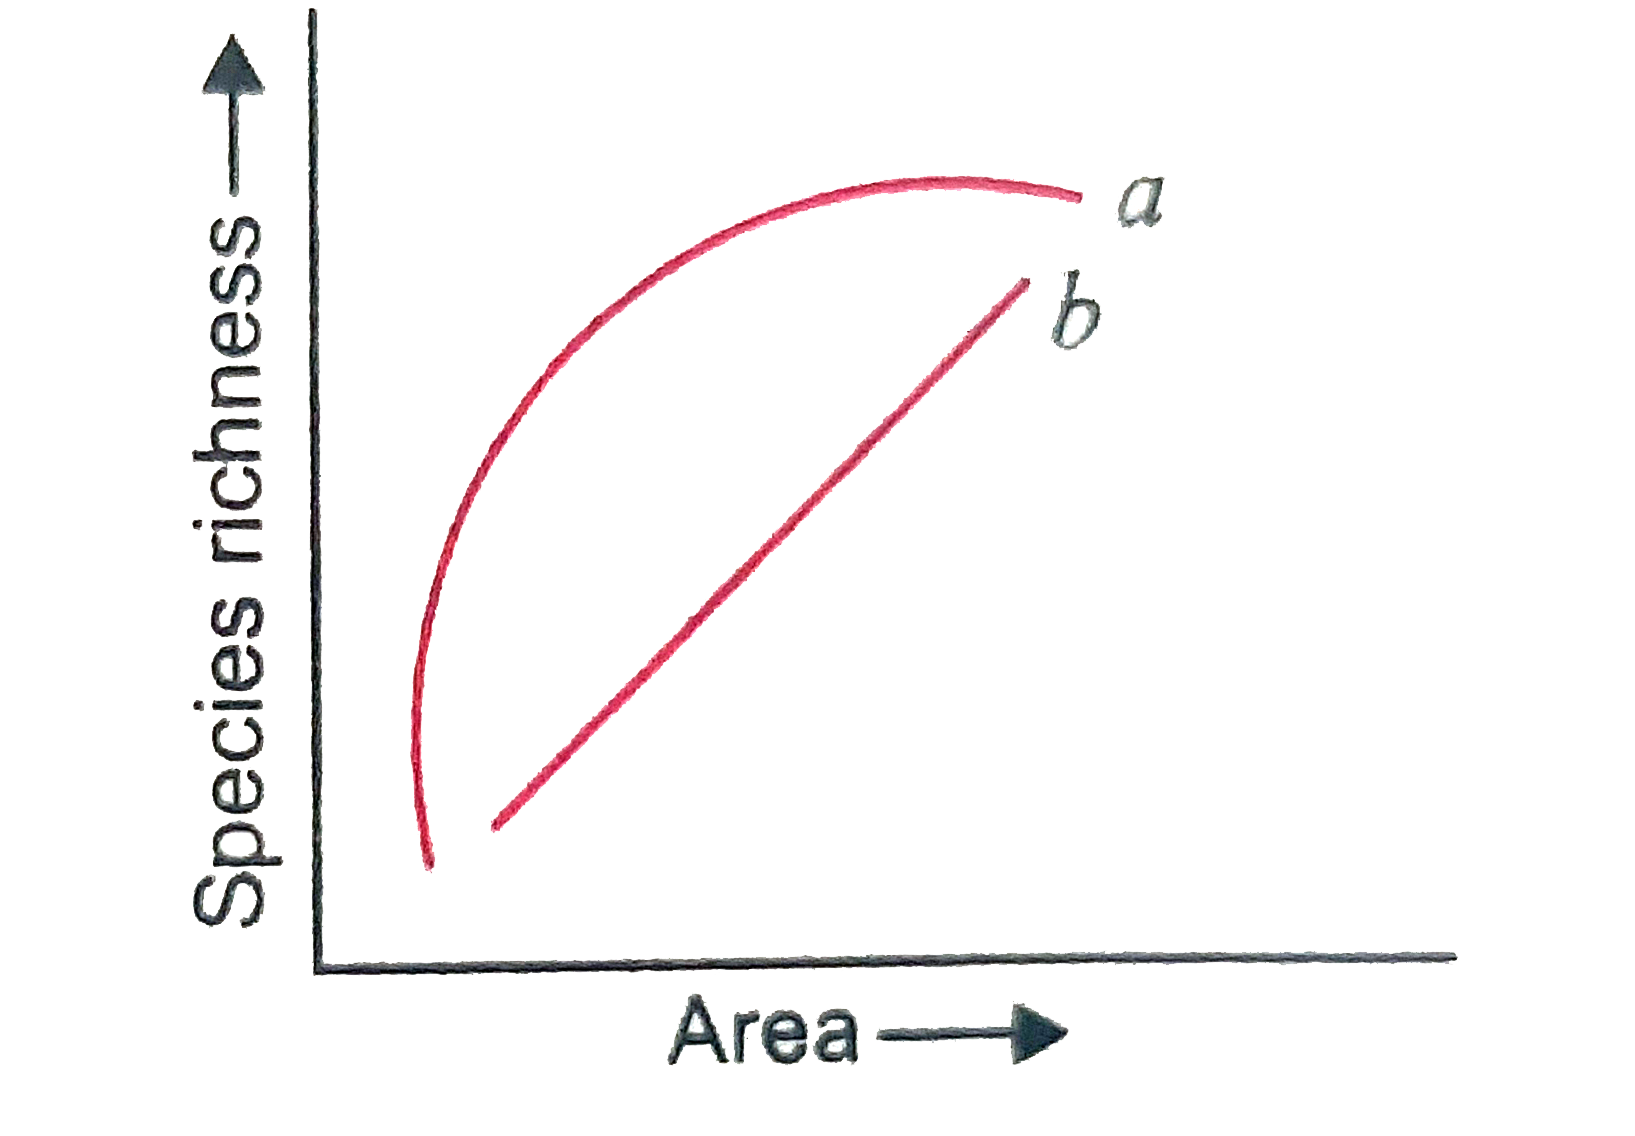
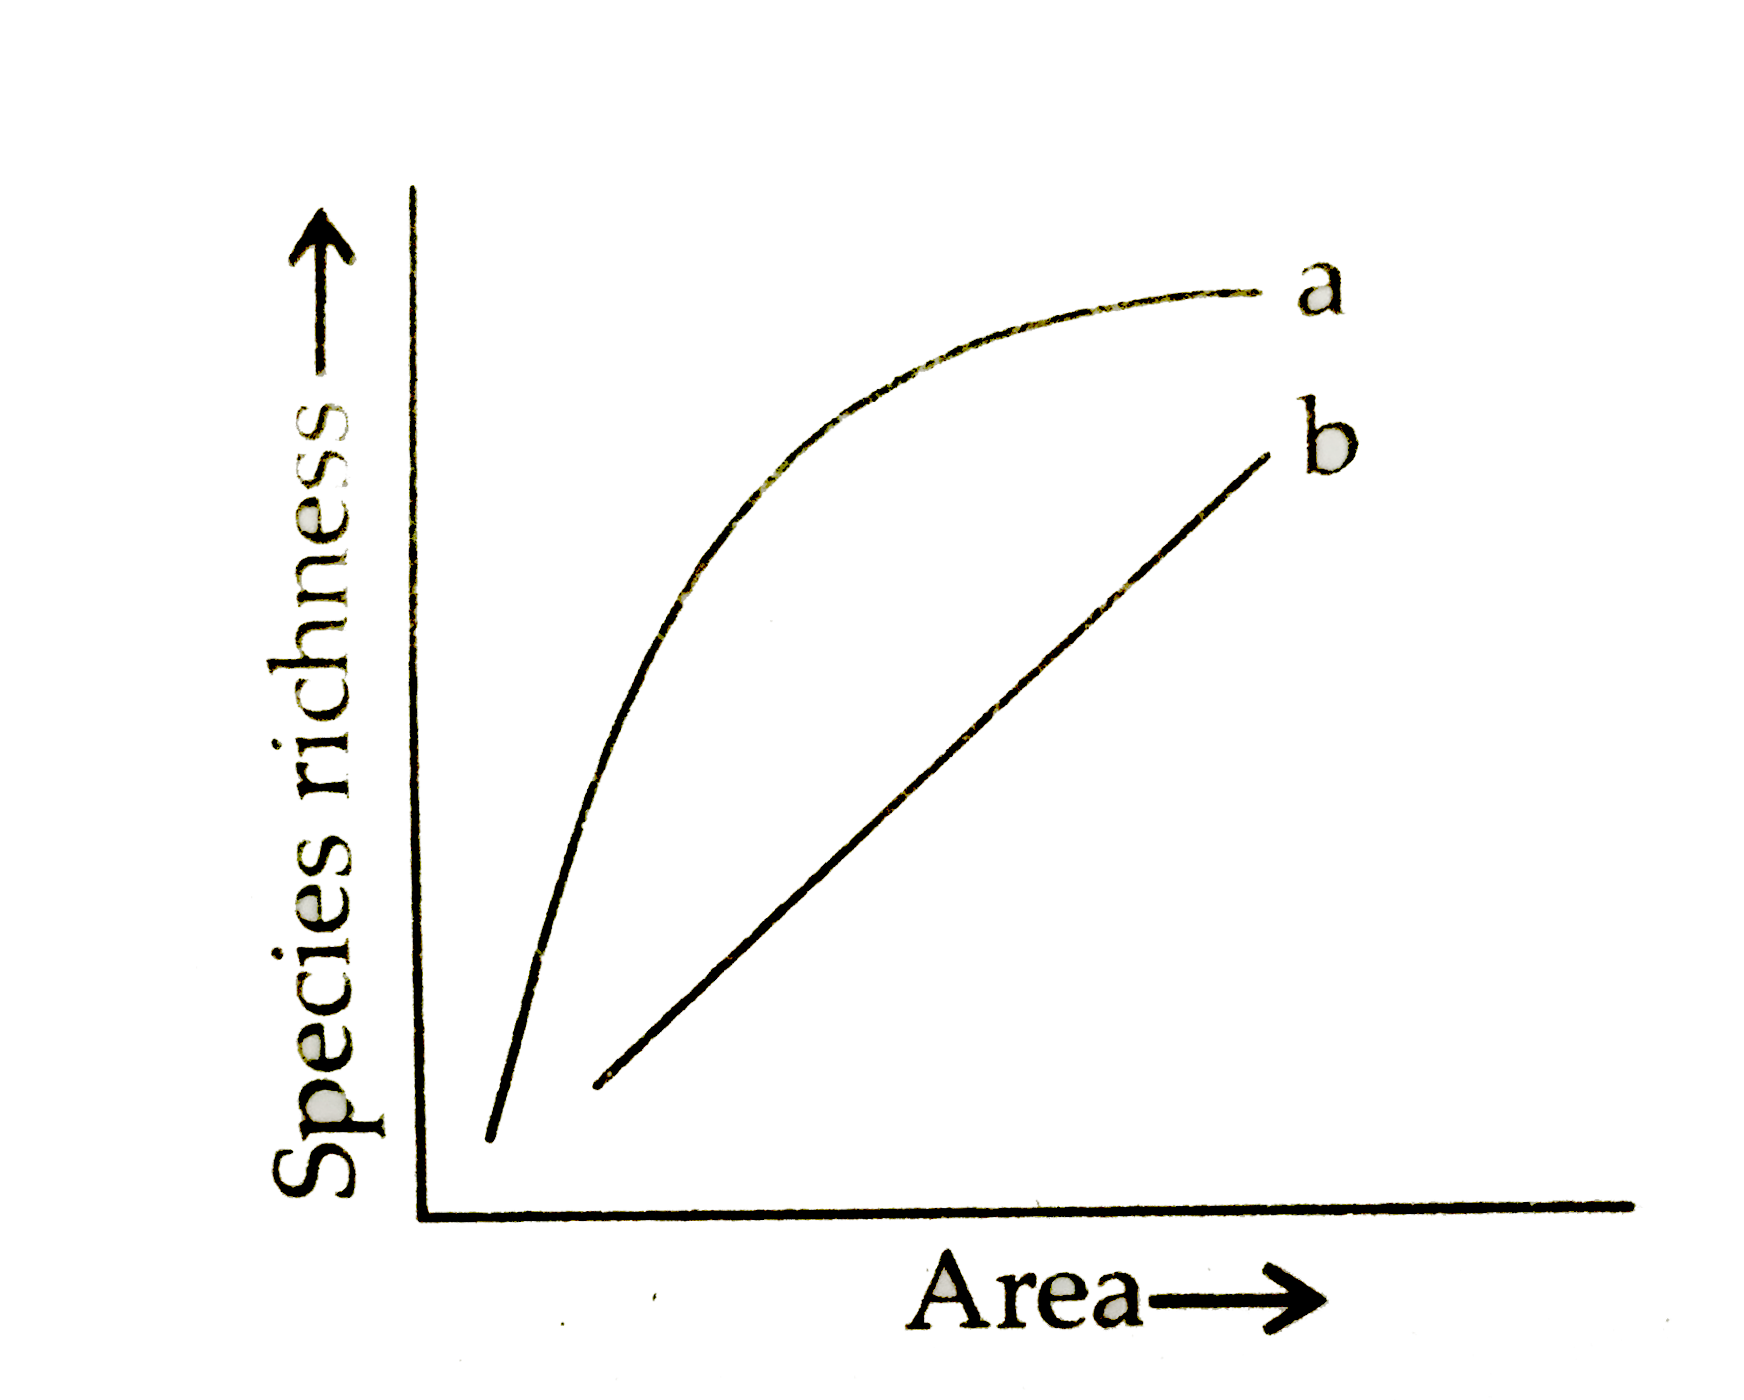
The following graph shows the species area relationship. Answers the Questions as directed.
(a) Name the naturalist who studied the kind of relationship shown in the graph.
Write the observations made by him.
(b) Write the situations as discovered by the ecologists when the value of 'Z' (slope of the line) lies between
(i) 0.1 and 0.2, (ii) 0.6 and 1.2
What does 'Z' stand for ?
(c ) When would the slope of the line 'b' become steeper ?
Video Solution
Text Solution
(a) Alexander Von Humboldt : He observed that within the region species richness increased with increasing explored area but only upto a limit.
(b) i-The slope of regression lines is similar, unaffected by the region or taxa and value of Z lies between 0.1-0.2.
(ii) The slope of regression is steeper when we analyse the species area relationship among very large areas like entire continent. (slope of the line) regression co-efficient between 0.6-1.2. Z-slope of line (regression coefficent).
(c) If species richness is more, the slope of the will become steeper Z values 0.6-1.2 for large areas with rich species diversity, such us mammals in the tropical forests.
|
Topper's Solved these Questions
- XII BOARDSBook:XII BOARDS PREVIOUS YEARChapter:XII BOARDSExercise:SET - I SECTION D
Explore 12 Videos
- XII BOARDSBook:XII BOARDS PREVIOUS YEARChapter:XII BOARDSExercise:[OUTSIDE DELHI : SET-II] SECTION - A
Explore 6 Videos
- XII BOARDSBook:XII BOARDS PREVIOUS YEARChapter:XII BOARDSExercise:SET - I SECTION B
Explore 22 Videos
- SAMPLE PAPER 2019Book:XII BOARDS PREVIOUS YEARChapter:SAMPLE PAPER 2019Exercise:Section E Part B
Explore 3 Videos
Similar Questions
Knowledge Check
In the equation of the species - area relationship , the letter 'C' and 'Z' represent:
AC = Regression coefficient , Z = Y - interceptBC = Slope of the line, Z = Regression coefficientCC = Y - intercept , Z = Slope of the line (regression coefficient)DBoth (B) and (C)In the equation of species-area relationship, the letter 'C' and 'Z' represent
AC = Regression coefficient, Z = y-interceptBC = slope of the line, Z = regression coefficientCC = y-intercept, Z = slope of the line (regression coefficient)DBoth B and COf the following graphs , the one which shows the relationship between the resistance R of multirange moving coil ammeter and its range I is
A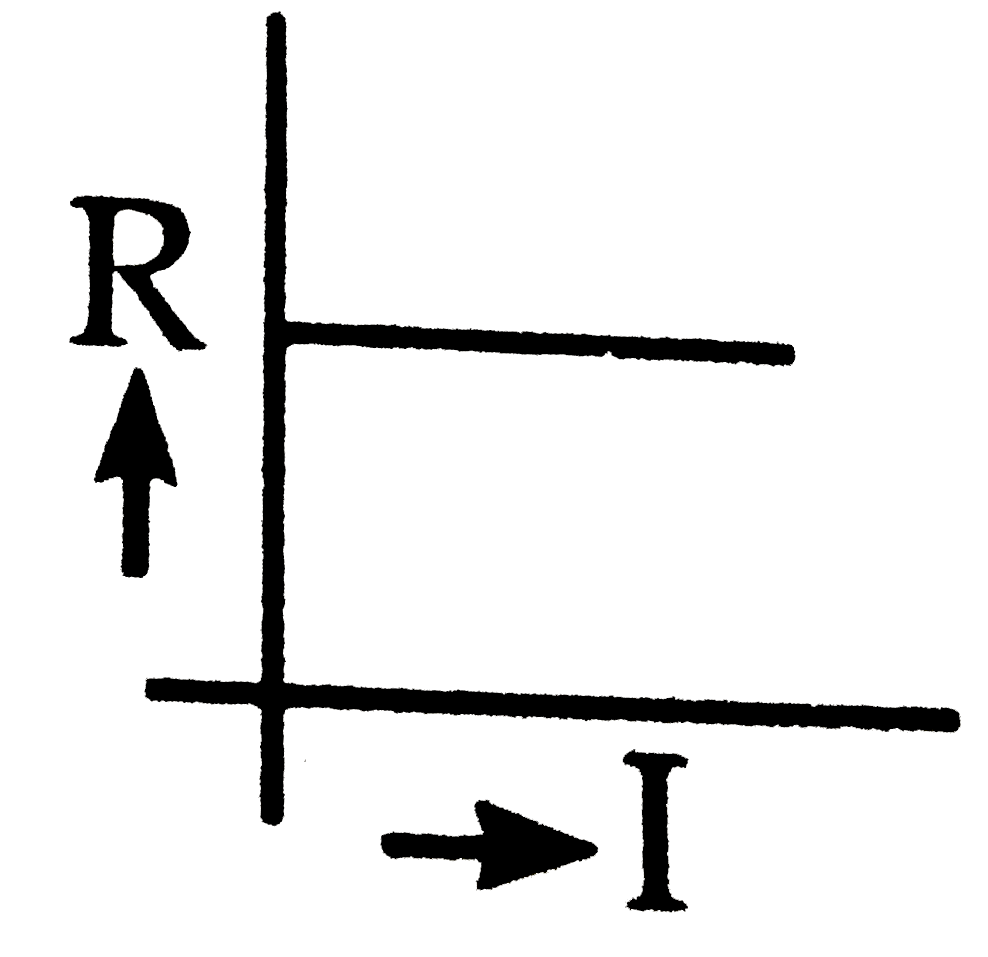 B
B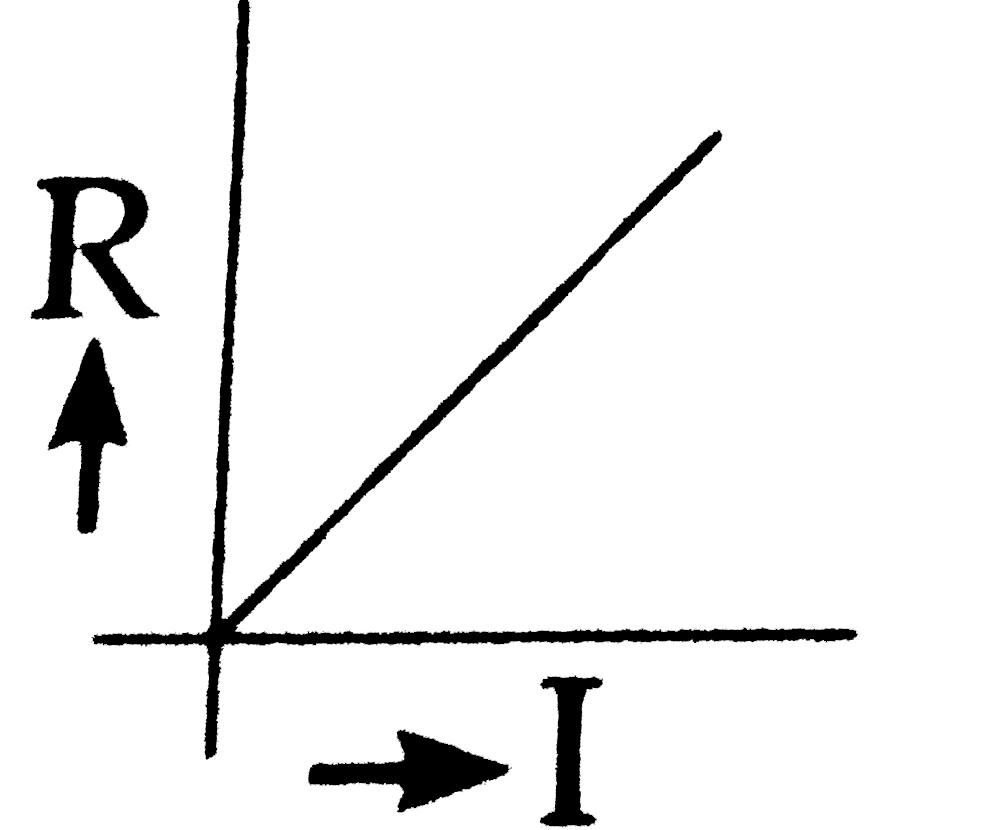 C
C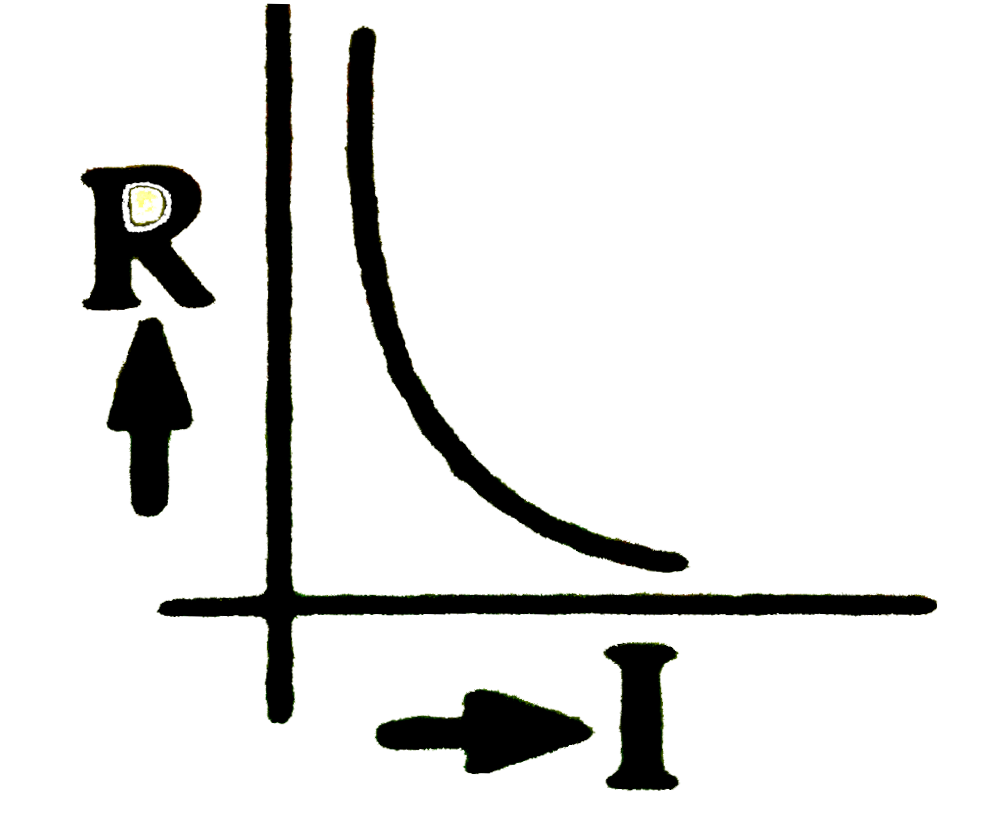 D
D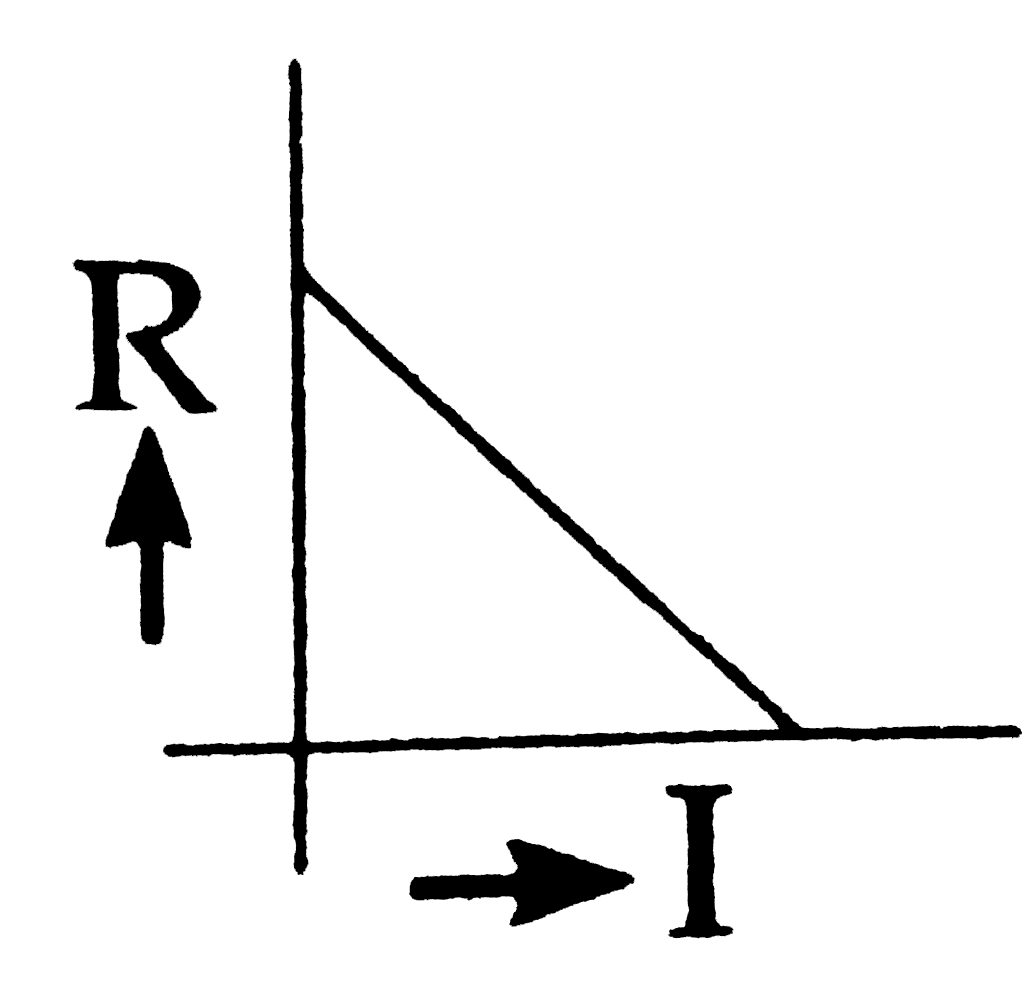
Name the scientist who discovered the relationship between electric current and magnetic field.
View SolutionName the scientist who discovered the relationship between electric current and magnetic field.
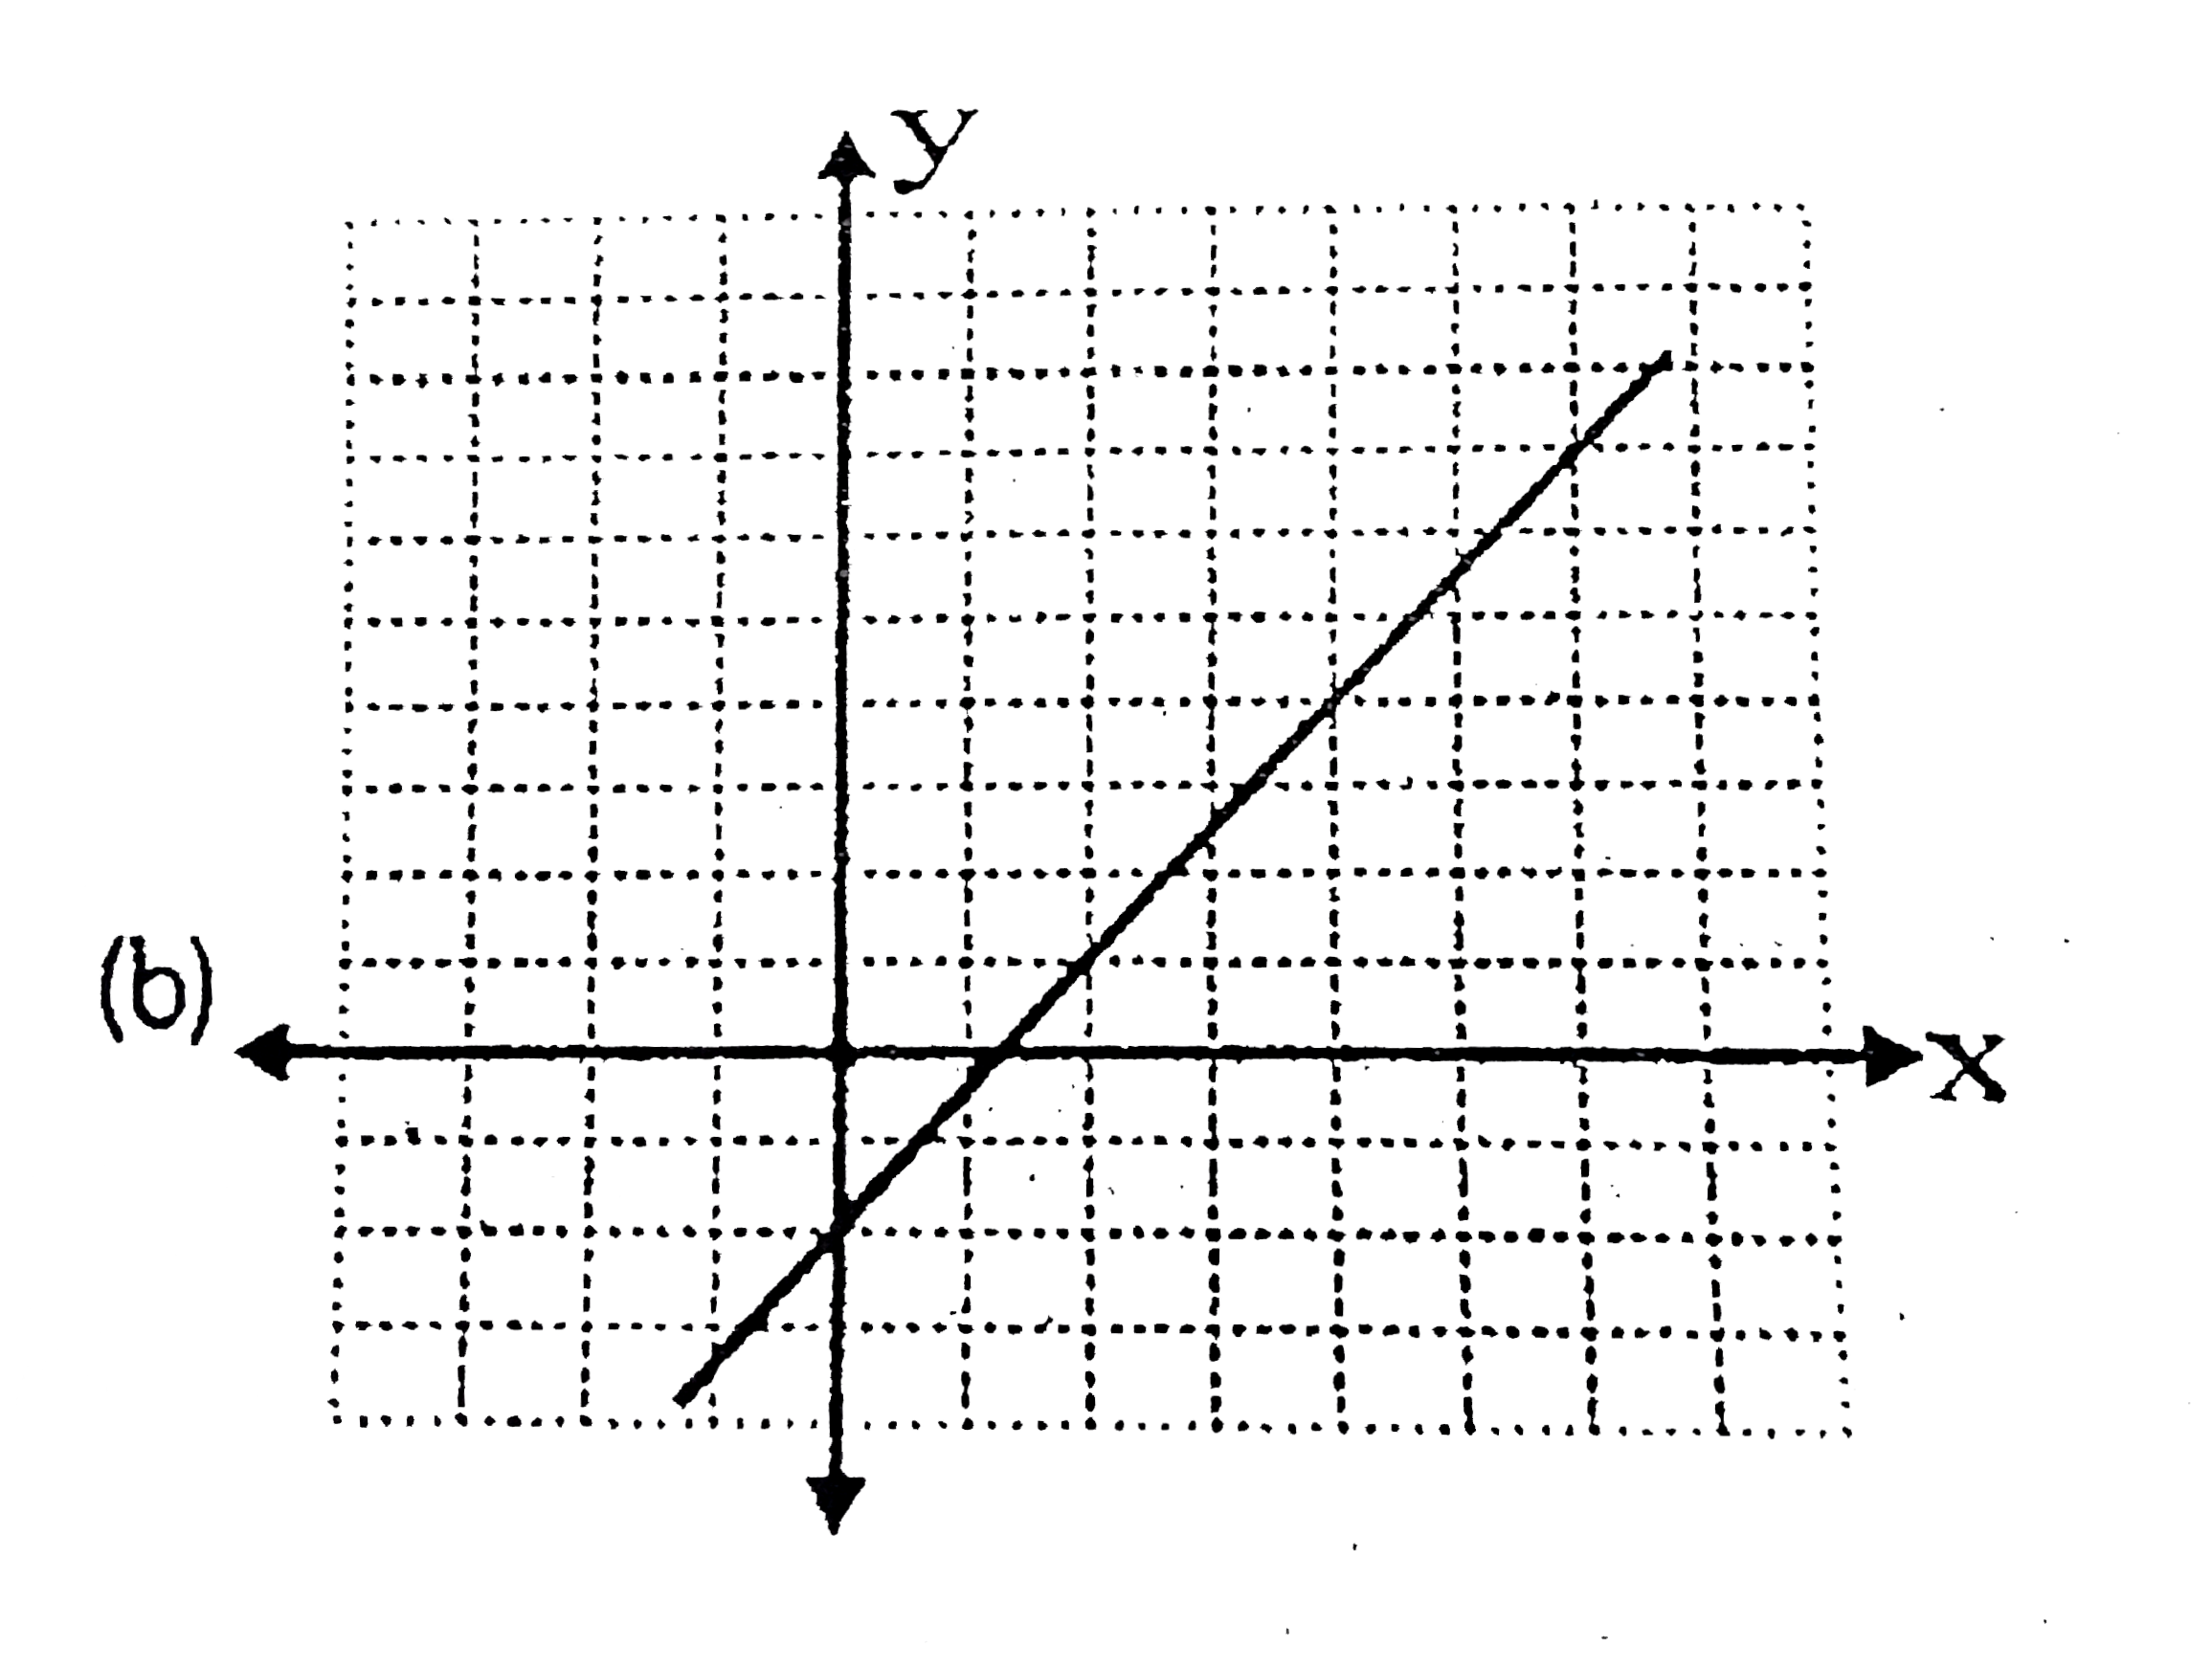
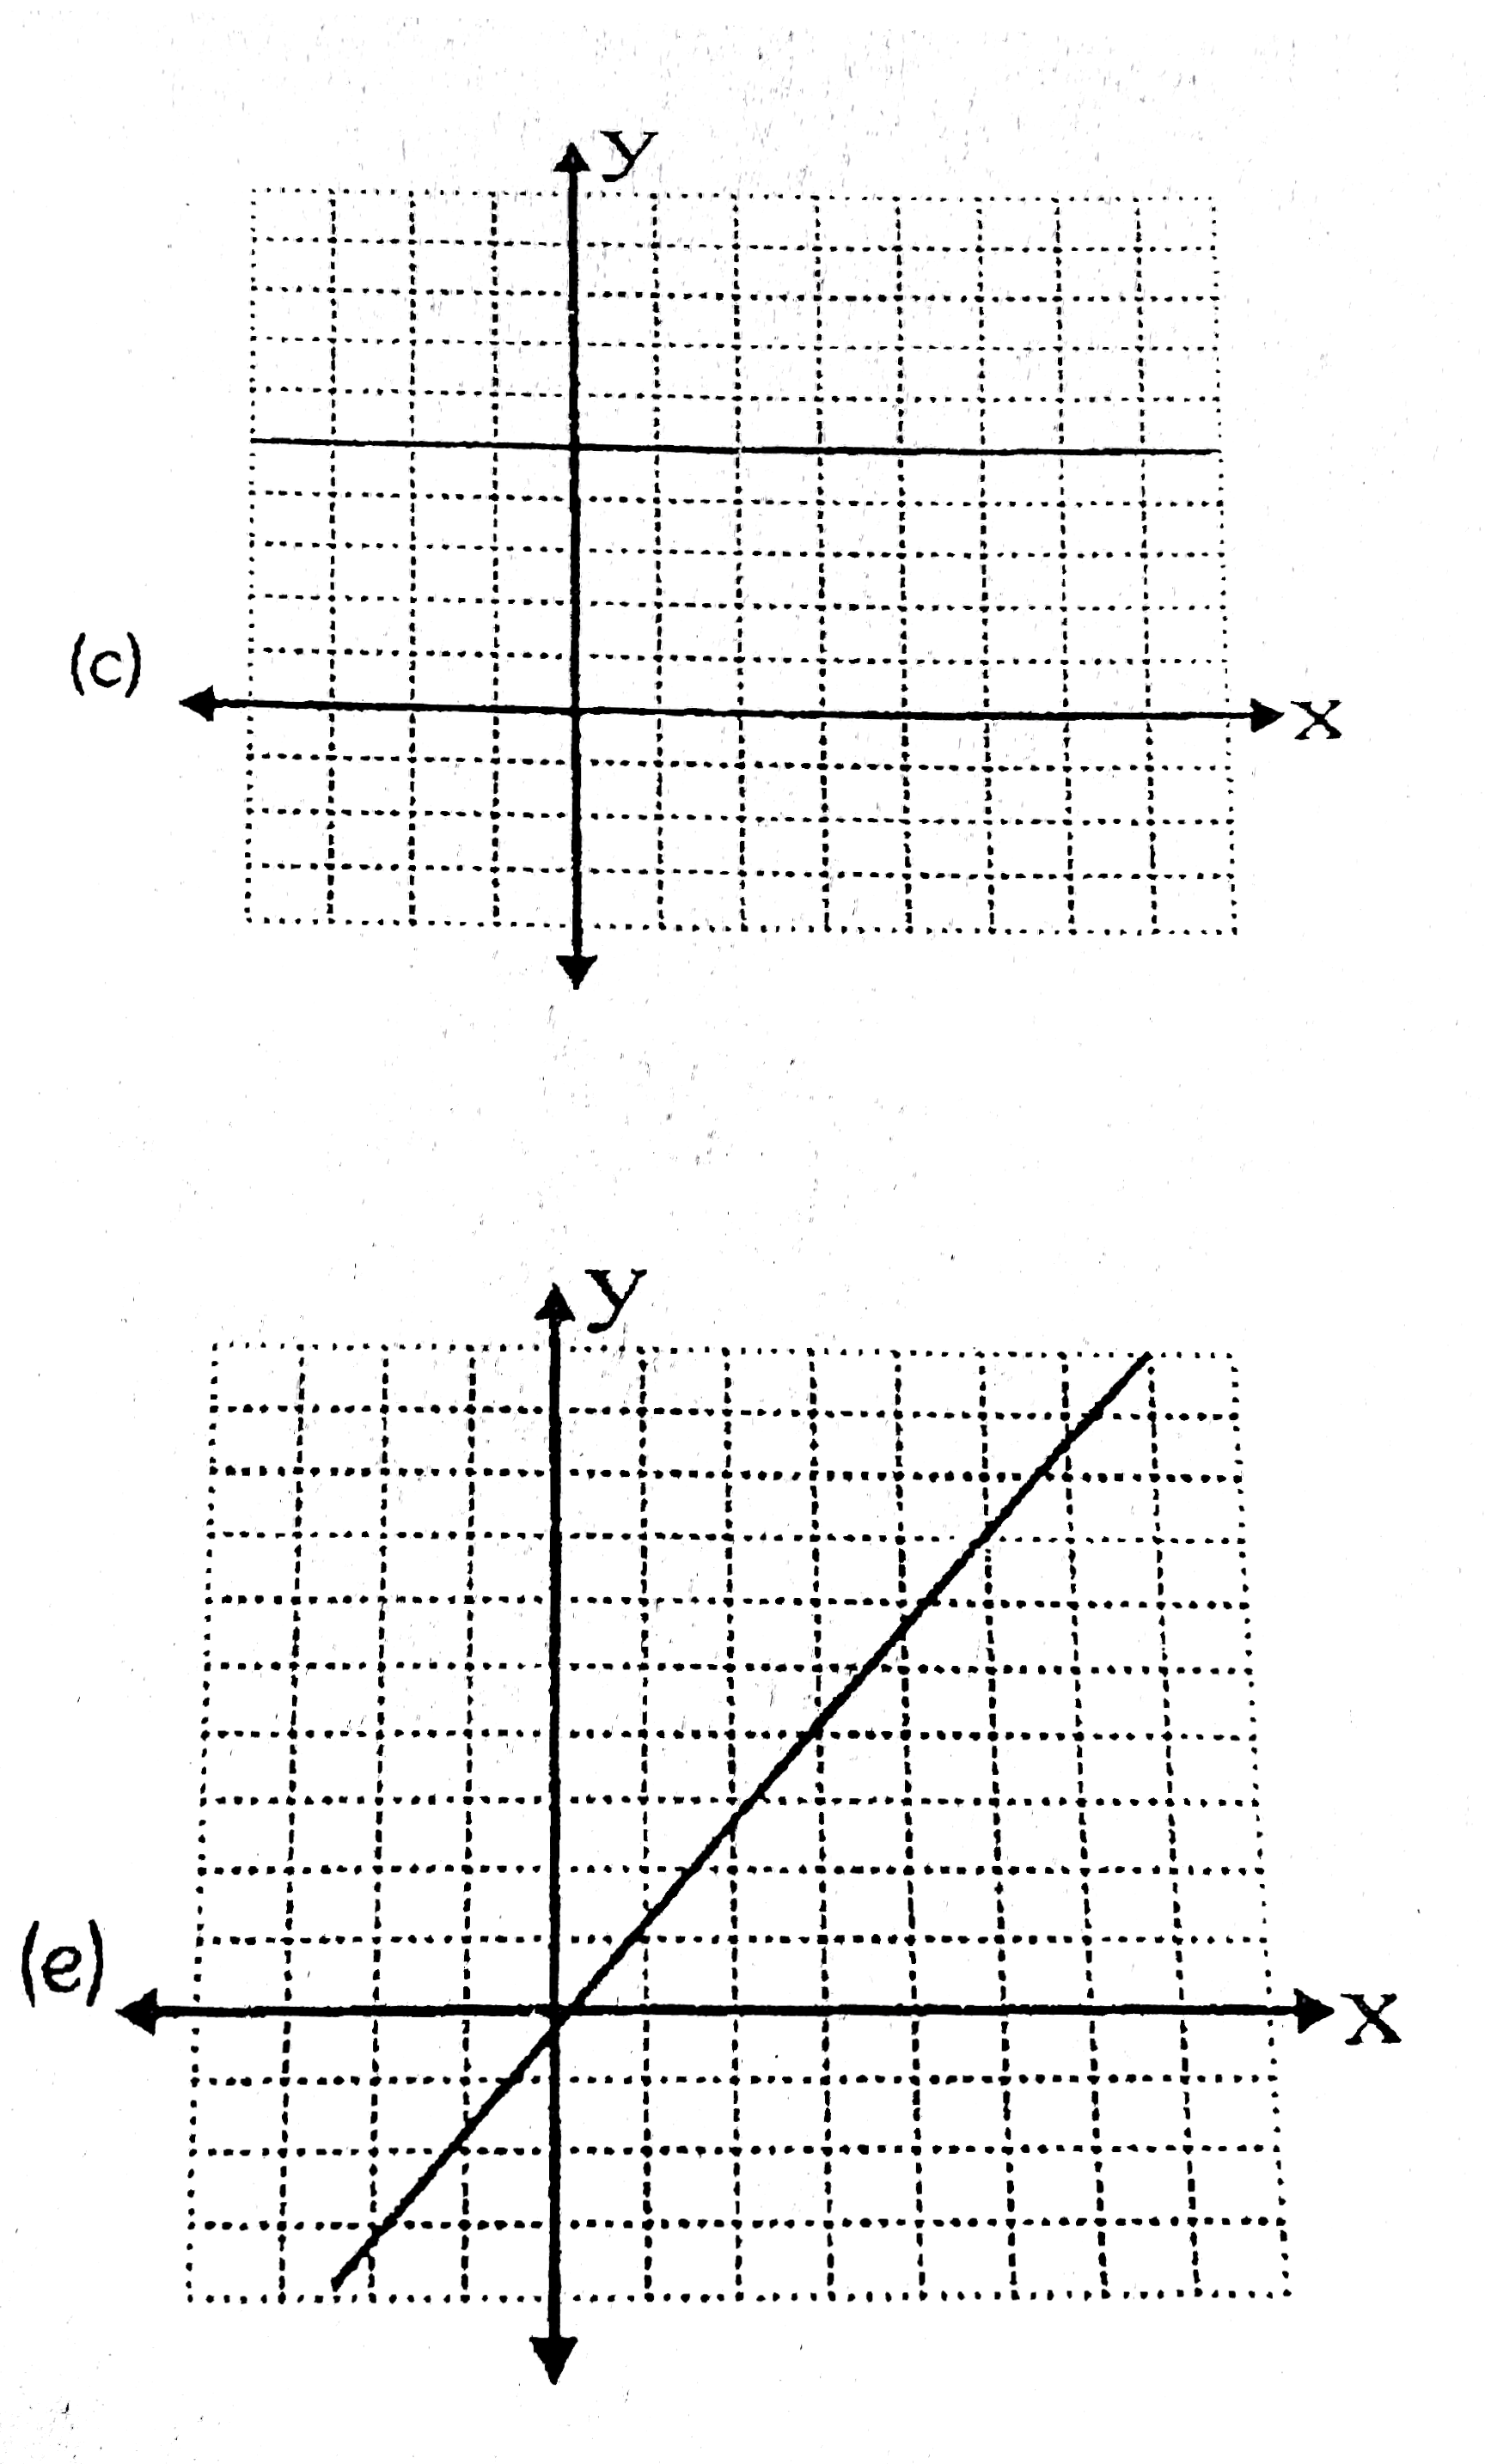
View SolutionWrite equations for the straight lines shown in the following graphs.
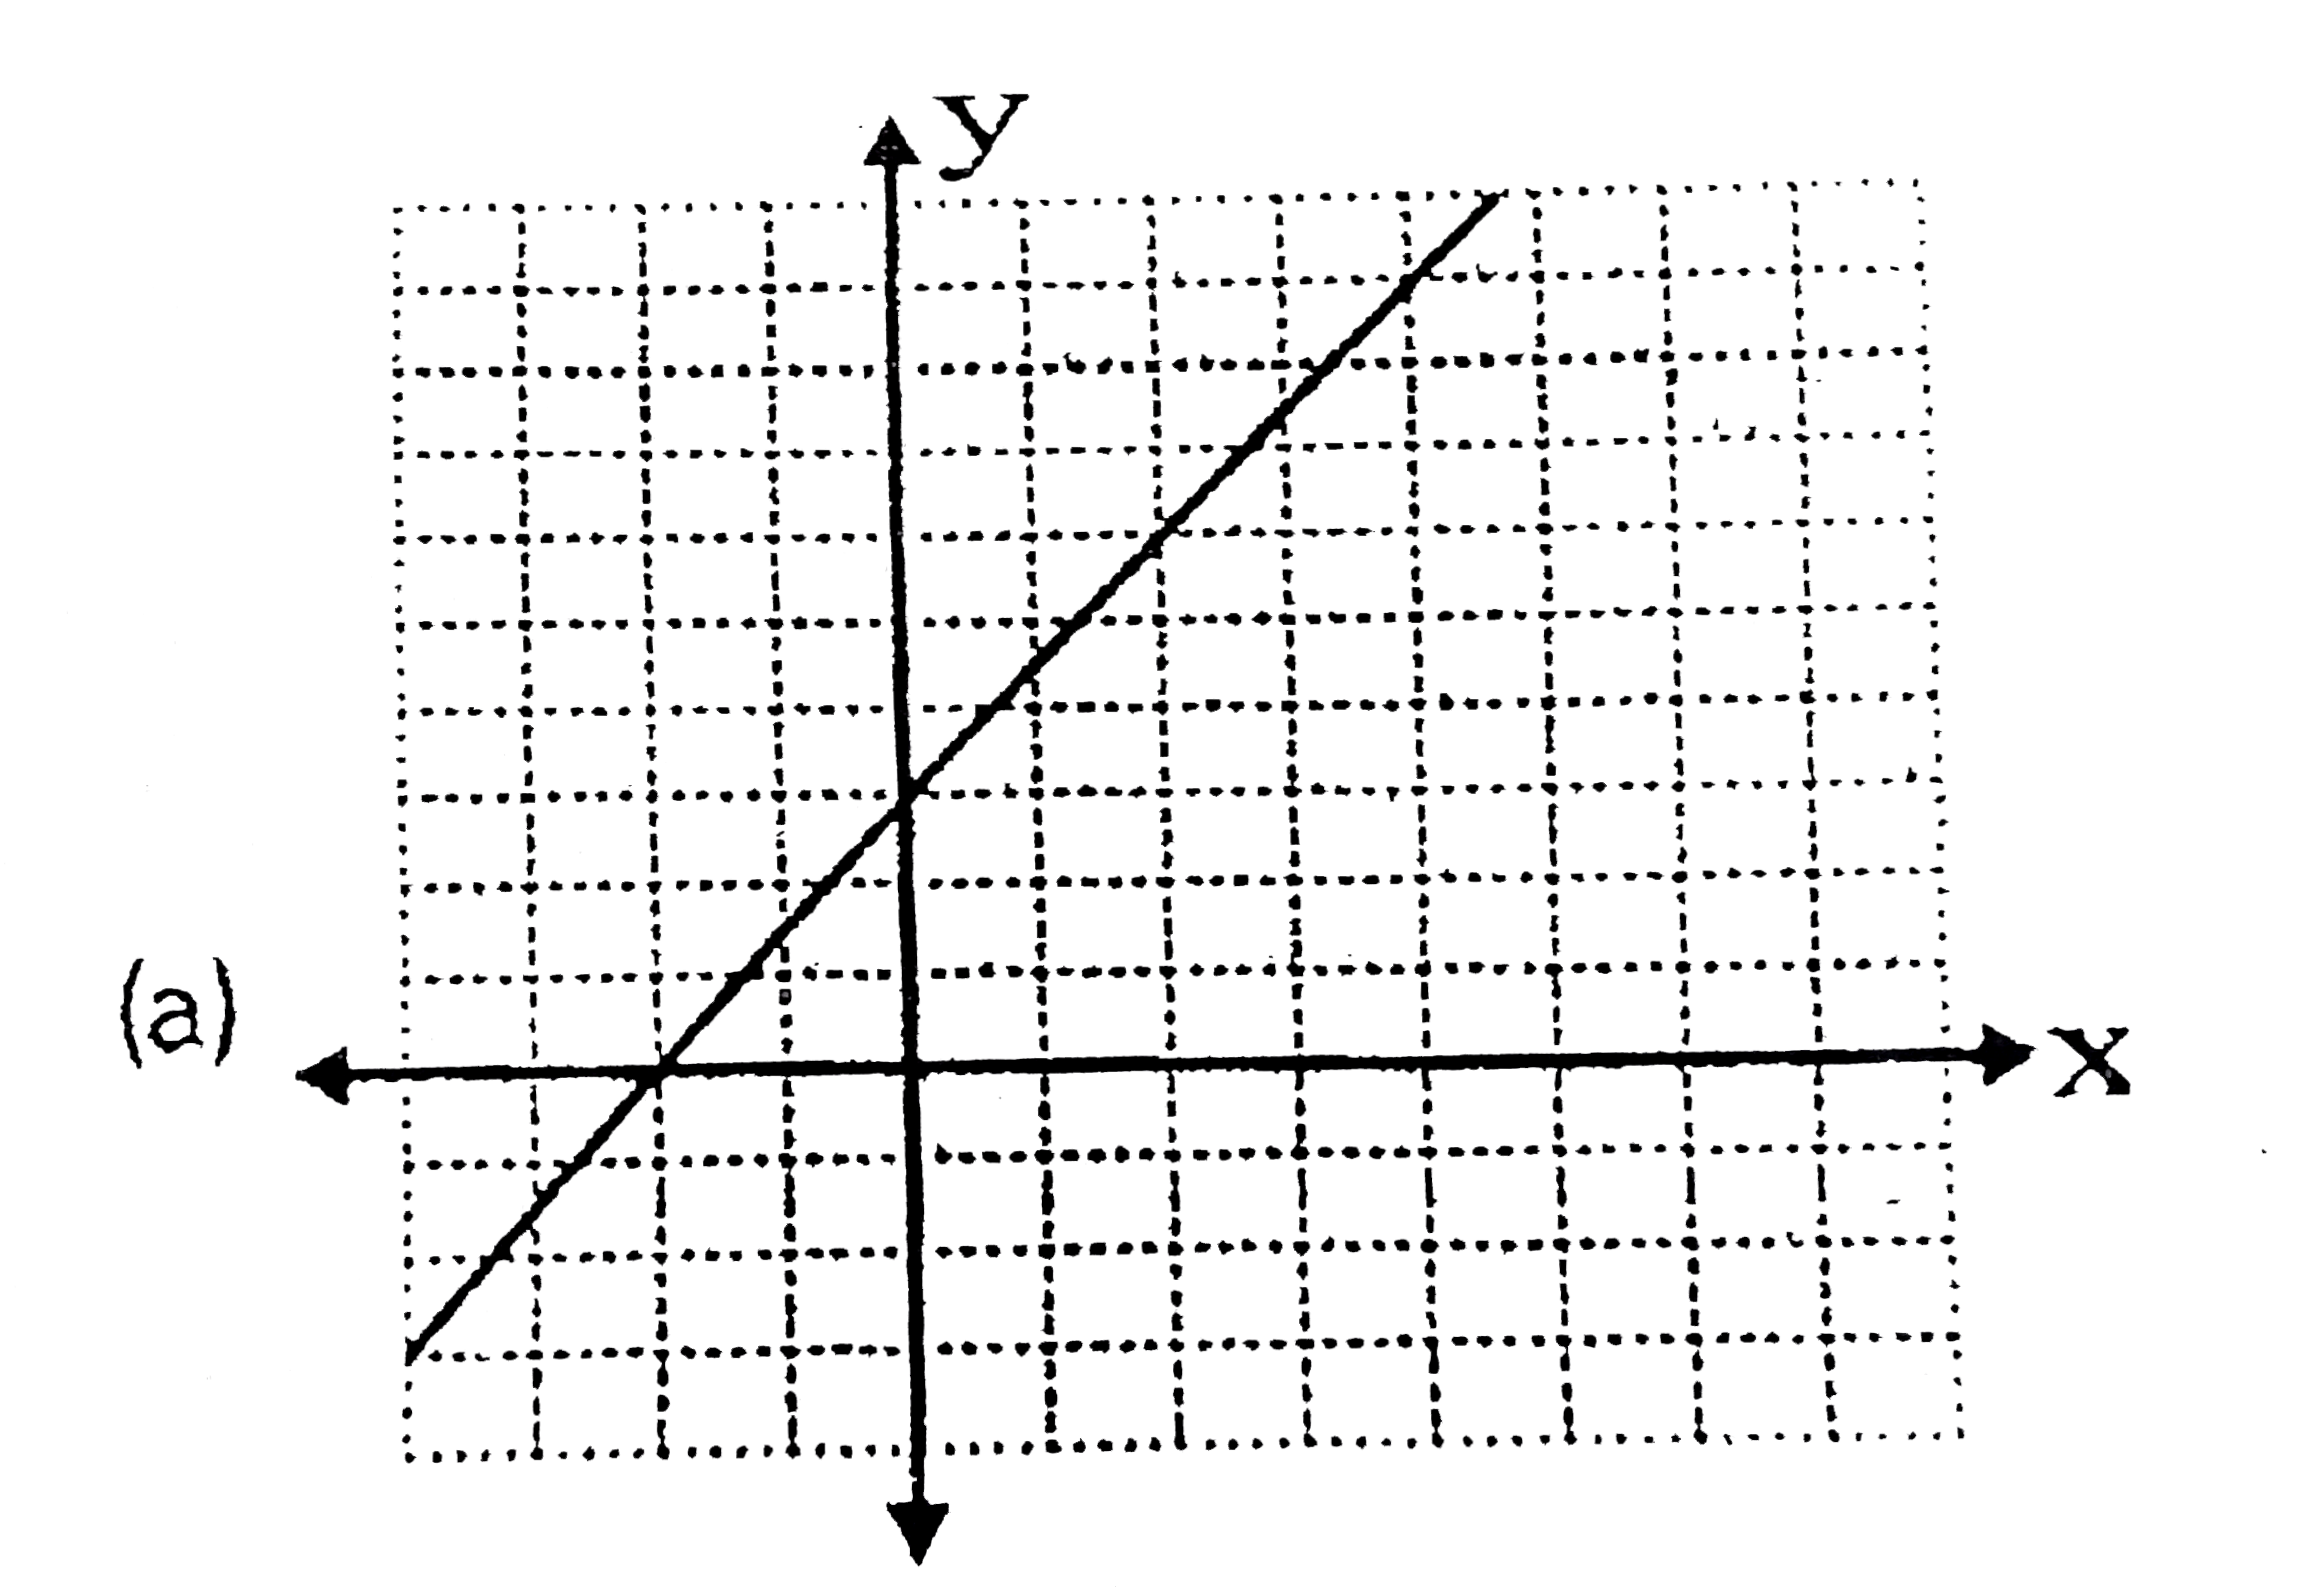

View SolutionLet z1εAandz2εB then the value of |z1−z2| necessarily lies between (A) 3 and 15 (B) 0 and 22 (C) 2 and 22 (D) 4 and 14
View SolutionWhat is the significance of the slope of regression in a species − area relationship?
View Solution


