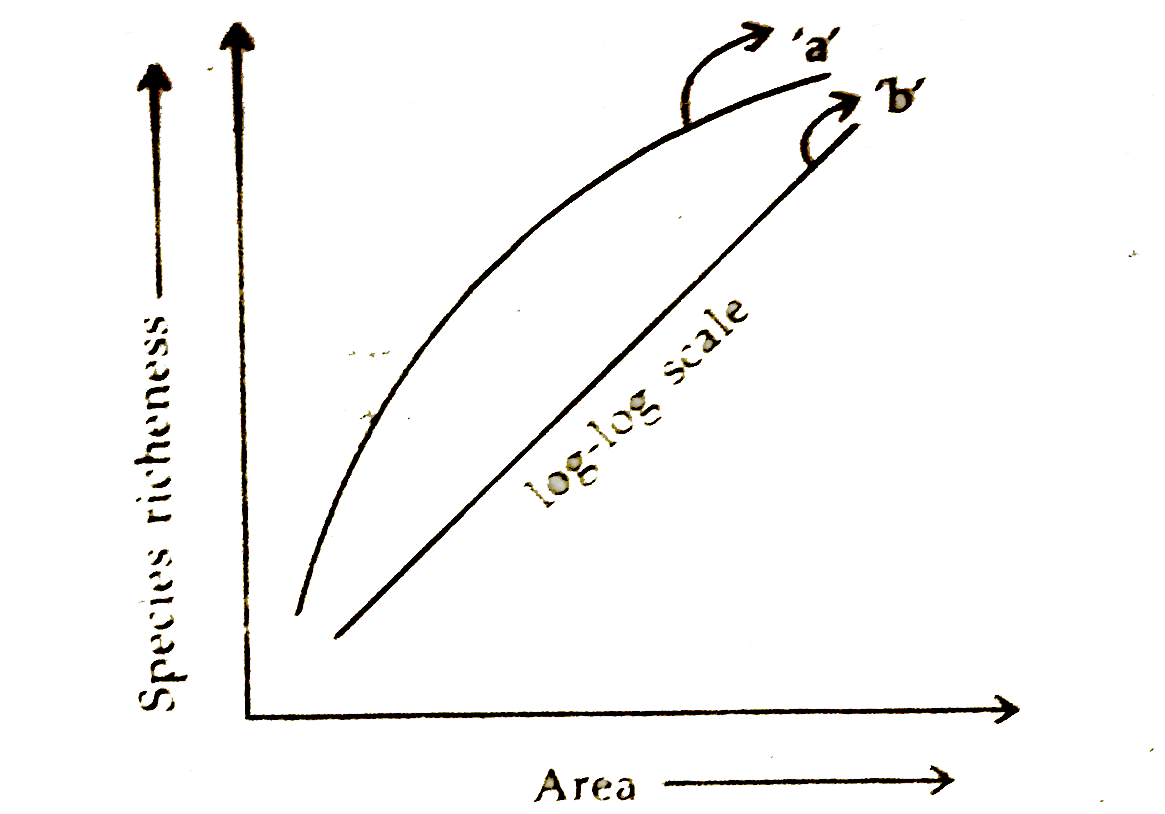
Assertion : If the species-area relationship are analysed among very large areas like the entire continents, the value of Z, i.e., slope of line in the range of 0.1 to 0.2.
Reason : The value of Z, i.e., slope of line of species area relationship lies in the range of 0.6 to 1.2 when analysis is done among small areas.
If both assertion and reason are true and reason is the correct explanation of assertion.
If both assertion and reason are true but reason is not the correct explanation of assertion.
If assertion is true but reason is false.
If both assertion and reason are false.
The correct Answer is:D
Alexander von Humboldt observed that within a region, species richness (number of species per unit area) increases with increasing explored area, but only upto a limit. The relationship between species richness and area turned out to be rectangular hyperbola for a wide variety of texa such as birds, bats, freshwater fish or flowering plants. On a logerithmic scale, the relationship is a straight line.
logS=logC+ZlogA
Here S is species richness, Z is slope of line or regression coefficient, C is Y intercept while A is area.
The value of Z, i.e., slope of line (regression coefficient) of species-area relationships is similar and lies in the range of 0.1 to 0.2 when analysis is done among small areas. However, if the species area relationship is for very large areas like entire continent, the slope of the line is much steep with value of Z in the range of 0.6 to 1.2, e.g., frugivorous birds and mammals of tropical forests of different continents with a steeper line of 1.15. Thus larger the explored area, more is steepness of the slope of line.
Topper's Solved these Questions
Similar Questions
If the points 1+2i and −1+4i are reflections of each other in the line z(1+i)+¯z(1−i)+k=0 then the value of k is
View SolutionFill in the blanks with suitable words in following statements.
(i) Colombia located near the equator has about…….. Species of birds.
(ii) More than 1,25,000 species of………. have been reported in Aamzonian rain forest.
(iii) Favourable and less seasonal enviroments has helped.............organism to gain more niche specialisation.
(iv) Value of slope of regression (Z) of species-area relationship lies in the range of............molluscs in New York state.
View Solution
Knowledge Check
The species-area relationships among very large areas like entire continents
AThe slope of the line to be much steeperBZ values lies in the range of 0.1 to 0.2CZ values lies in the range of 0.6 to 1.2DBoth A and CIf we analyse the species-area relationships among very large areas like the entire continents, then slope of line becomes much steeper in the range of
A0.1 to 0.6B0.1 to 0.2C0.6 to 1.2D0.2 to 0.6During the analysing the surface area relationship among very large area like entire continents, the slope of the line is found much steeper and the Z values ranges
A0.1to0.2B1.15to3C0D0.6to1.2
If the area of the triangle with vertices x,0,1,1 and 0,2 1, 4 sq units,then the value of x is :
View SolutionThe following graph shows the species area relationship. Answers the Questions as directed.
(a) Name the naturalist who studied the kind of relationship shown in the graph.
Write the observations made by him.
(b) Write the situations as discovered by the ecologists when the value of 'Z' (slope of the line) lies between
(i) 0.1 and 0.2, (ii) 0.6 and 1.2
What does 'Z' stand for ?
(c ) When would the slope of the line 'b' become steeper ?

View SolutionFind the values of k if area of tringle is 4 sq. units and dvertices are : (i) (k,0), (4,0), (0,2)
View Solution'If the area bounded by the graph of y=xe−ax(a>0) and the abscissa axis is 19 then the value of ' a ' is equal to
View SolutionIf the area of the triangle with vertices (x, 0), (1,1) and (0,2) is 4 sq units, then the value of x is
View Solution

