Study graph carefully and answer the following questions.
The Bar graph shows the total production of Car and Bike in given years by a company and the Line graph shows the per unit selling price of Car in given years.
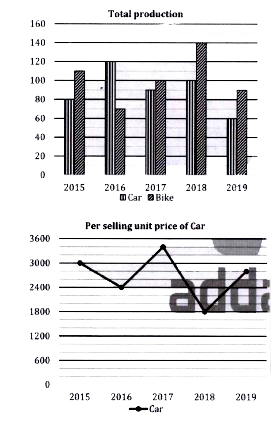
If ratio of per unit selling price of Car and Bike in 2018 is 3:4, then Find the ratio of revenue made by Bike to Car in the year 2018?
15:28
8:5
5:8
28:15
The correct Answer is:D
Step by step video, text & image solution for Study graph carefully and answer the following questions. The Bar graph shows the total production of Car and Bike in given years by a company and the Line graph shows the per unit selling price of Car in given years. If ratio of per unit selling price of Car and Bike in 2018 is 3:4, then Find the ratio of revenue made by Bike to Car in the year 2018? by Maths experts to help you in doubts & scoring excellent marks in Class 14 exams.
Updated on:21/07/2023Topper's Solved these Questions
- DATA INTERPRETATIONBOOK - ADDA247CHAPTER - DATA INTERPRETATIONEXERCISE - Mains Questions
33 Videos
- DATA INTERPRETATIONBOOK - ADDA247CHAPTER - DATA INTERPRETATIONEXERCISE - Previous Year Questions
56 Videos
- DATA INTERPRETATIONBOOK - ADDA247CHAPTER - DATA INTERPRETATIONEXERCISE - Prelims Questions (Level-1)
54 Videos
- BOAT AND STREAM BOOK - ADDA247CHAPTER - BOAT AND STREAM EXERCISE - Previous Year Question
22 Videos
- DATA SUFFICIENCY BOOK - ADDA247CHAPTER - DATA SUFFICIENCY EXERCISE - PREVIOUS YEAR QUESTIONS
25 Videos
Similar Questions
Study the given Venn diagram carefully and answer the following question.
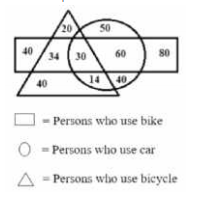 How many persons use both a bicycle and a bike but not a car?
View SolutionStudy the following information carefully and answer the given questions: The following bar graph shows the price per square feet of lands in different years
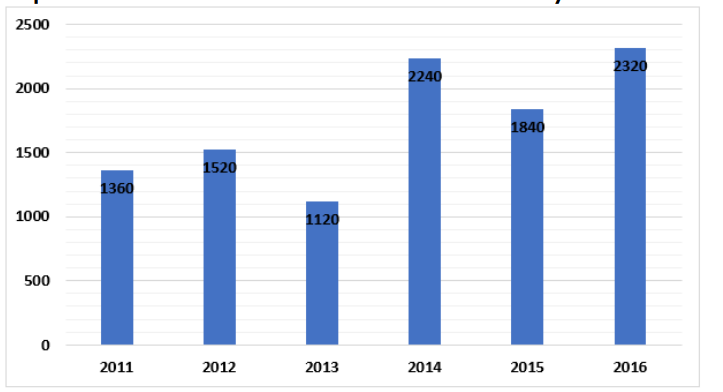
Find the average price per square feet of land in all the given years except 2015?
View Solution
Knowledge Check
Study the graph carefully and answer the following questions.
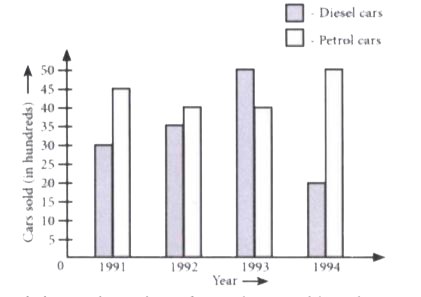
Find the mean sale of Petrol cars.A4735B5745C5740D4375Study the graph carefully and answer the following questions.
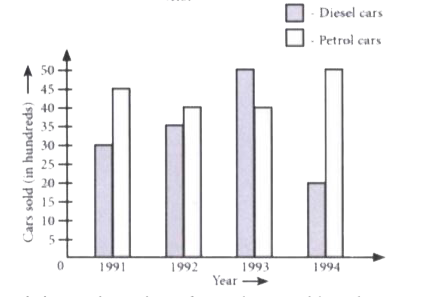
How many cars were sold during the year 1991?A9000B6500C7500D7000Study the graph carefully and answer the following questions.
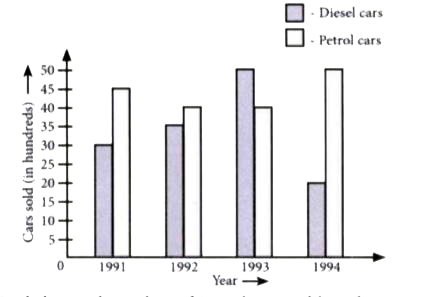
Find the total number of Diesel cars sold in the year 1992 and 1994 together.A2500B5500C1500D4500
Study the following graph carefully and answer the given questions.
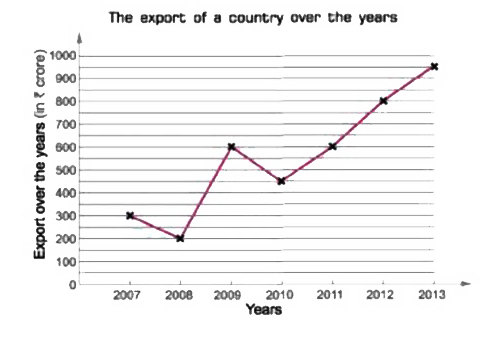
Exports in 2009 is approximately what per cent of that of year 2010 ?
View SolutionStudy the given Venn diagram carefully and answer the following question .
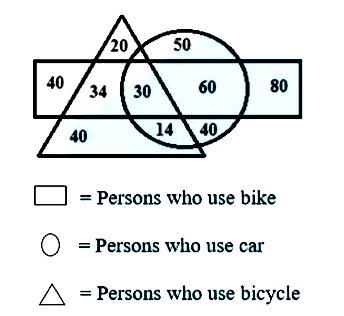
How many persons use both a bicycle and a bike but not a car ?
View SolutionStudy the following graph carefully and answer the given questions :-
The following graph shows the % profit of two companies over the years :-
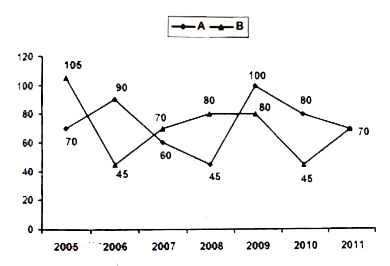
In which of the following years the ratio of expenditure to income was the least for company B?
View SolutionStudy the following graph carefully and answer the given questions :-
The following graph shows the % profit of two companies over the years :-
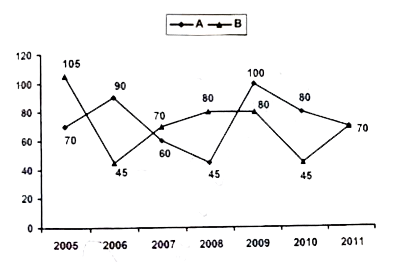
If the total expenditure of company A in 2007 was Rs 150 lakhs what was the total income ?
View SolutionStudy the following graph carefully and answer the questions that
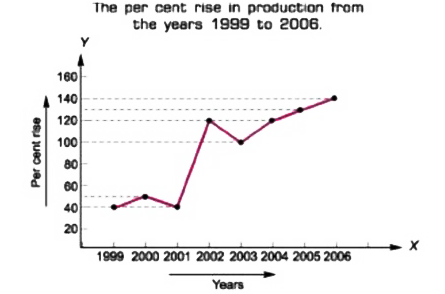
If the production in year 1998 was 1000 units , how much was the production in year 2002 ?
View Solution
