Study graph carefully and answer the following questions.
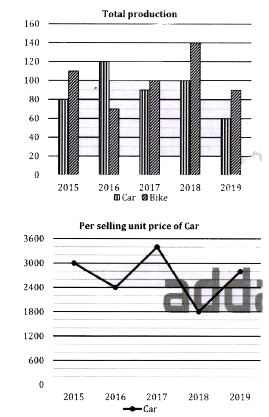
The Bar graph shows the total production of Car and Bike in given years by a company and the Line graph shows the per unit selling price of Car in given years.

The selling price of a bike in 2020 is 100/7 % less than the selling price of a car in 2019. If profit on selling one Bike is 25% and total manufactured Bikes in 2020 are 120, then Find cost price of Bike in 2020?
Rs.1960
Rs. 1820
Rs. 1920
Rs. 1840
The correct Answer is:C
Step by step video, text & image solution for Study graph carefully and answer the following questions. The Bar graph shows the total production of Car and Bike in given years by a company and the Line graph shows the per unit selling price of Car in given years. The selling price of a bike in 2020 is 100/7 % less than the selling price of a car in 2019. If profit on selling one Bike is 25% and total manufactured Bikes in 2020 are 120, then Find cost price of Bike in 2020? by Maths experts to help you in doubts & scoring excellent marks in Class 14 exams.
Updated on:21/07/2023Topper's Solved these Questions
- DATA INTERPRETATIONBOOK - ADDA247CHAPTER - DATA INTERPRETATIONEXERCISE - Mains Questions
33 Videos
- DATA INTERPRETATIONBOOK - ADDA247CHAPTER - DATA INTERPRETATIONEXERCISE - Previous Year Questions
56 Videos
- DATA INTERPRETATIONBOOK - ADDA247CHAPTER - DATA INTERPRETATIONEXERCISE - Prelims Questions (Level-1)
54 Videos
- BOAT AND STREAM BOOK - ADDA247CHAPTER - BOAT AND STREAM EXERCISE - Previous Year Question
22 Videos
- DATA SUFFICIENCY BOOK - ADDA247CHAPTER - DATA SUFFICIENCY EXERCISE - PREVIOUS YEAR QUESTIONS
25 Videos
Similar Questions
Knowledge Check
If cost price is Rs 50 less than the selling price and profit is 10%, then what is the selling price (in Rs)?
AA)450BB)500CC)550DD)600If cost price is Rs. 150 less than the selling price and profit is 20%, then what is the selling price (in Rs.)?
A750B800C850D900If cost price is Rs. 150 less than the selling price and profit is 20%, then what is the selling price (in Rs.)?
A750B800C850D900
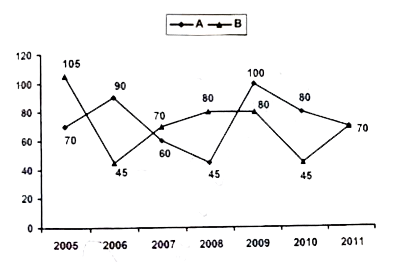
Study the following graph carefully and answer the given questions :-
The following graph shows the % profit of two companies over the years :-

If the total expenditure of company A in 2007 was Rs 150 lakhs what was the total income ?
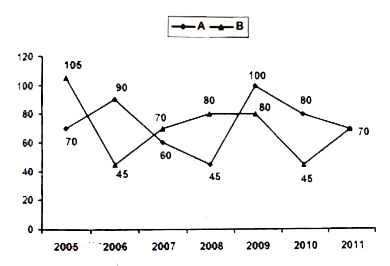
View SolutionStudy the following graph carefully and answer the given questions :-
The following graph shows the % profit of two companies over the years :-

In which of the following years the ratio of expenditure to income was the least for company B?
View SolutionIf the ratio of cost price and selling price of an article is 4:5, then the percentage of profit will be
View SolutionDifference between the cost price and selling price of an itme is ₹ 240. If there is 20 % profit, then find the selling price.
View SolutionIf the ratio of cost price and selling price of an article is 4:5, then the percentage of profit will be
View Solution
