Following line graph shows the ratio of export to import of company A and company B over the year
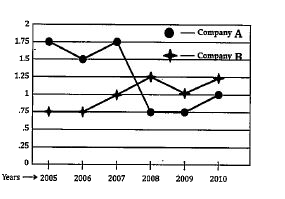
If the exports of company B in 2008 was Rs 237 Crore, what was the amount of imports in that years?
189.6 crore
243 crore
281 crore
316 crore
The correct Answer is:A
Step by step video, text & image solution for Following line graph shows the ratio of export to import of company A and company B over the year If the exports of company B in 2008 was Rs 237 Crore, what was the amount of imports in that years? by Maths experts to help you in doubts & scoring excellent marks in Class 14 exams.
Updated on:21/07/2023Topper's Solved these Questions
- DATA INTERPRETATIONBOOK - ADDA247CHAPTER - DATA INTERPRETATIONEXERCISE - Basic Questions
30 Videos
- DATA INTERPRETATIONBOOK - ADDA247CHAPTER - DATA INTERPRETATIONEXERCISE - Prelims Questions (Level-1)
54 Videos
- BOAT AND STREAM BOOK - ADDA247CHAPTER - BOAT AND STREAM EXERCISE - Previous Year Question
22 Videos
- DATA SUFFICIENCY BOOK - ADDA247CHAPTER - DATA SUFFICIENCY EXERCISE - PREVIOUS YEAR QUESTIONS
25 Videos
Similar Questions
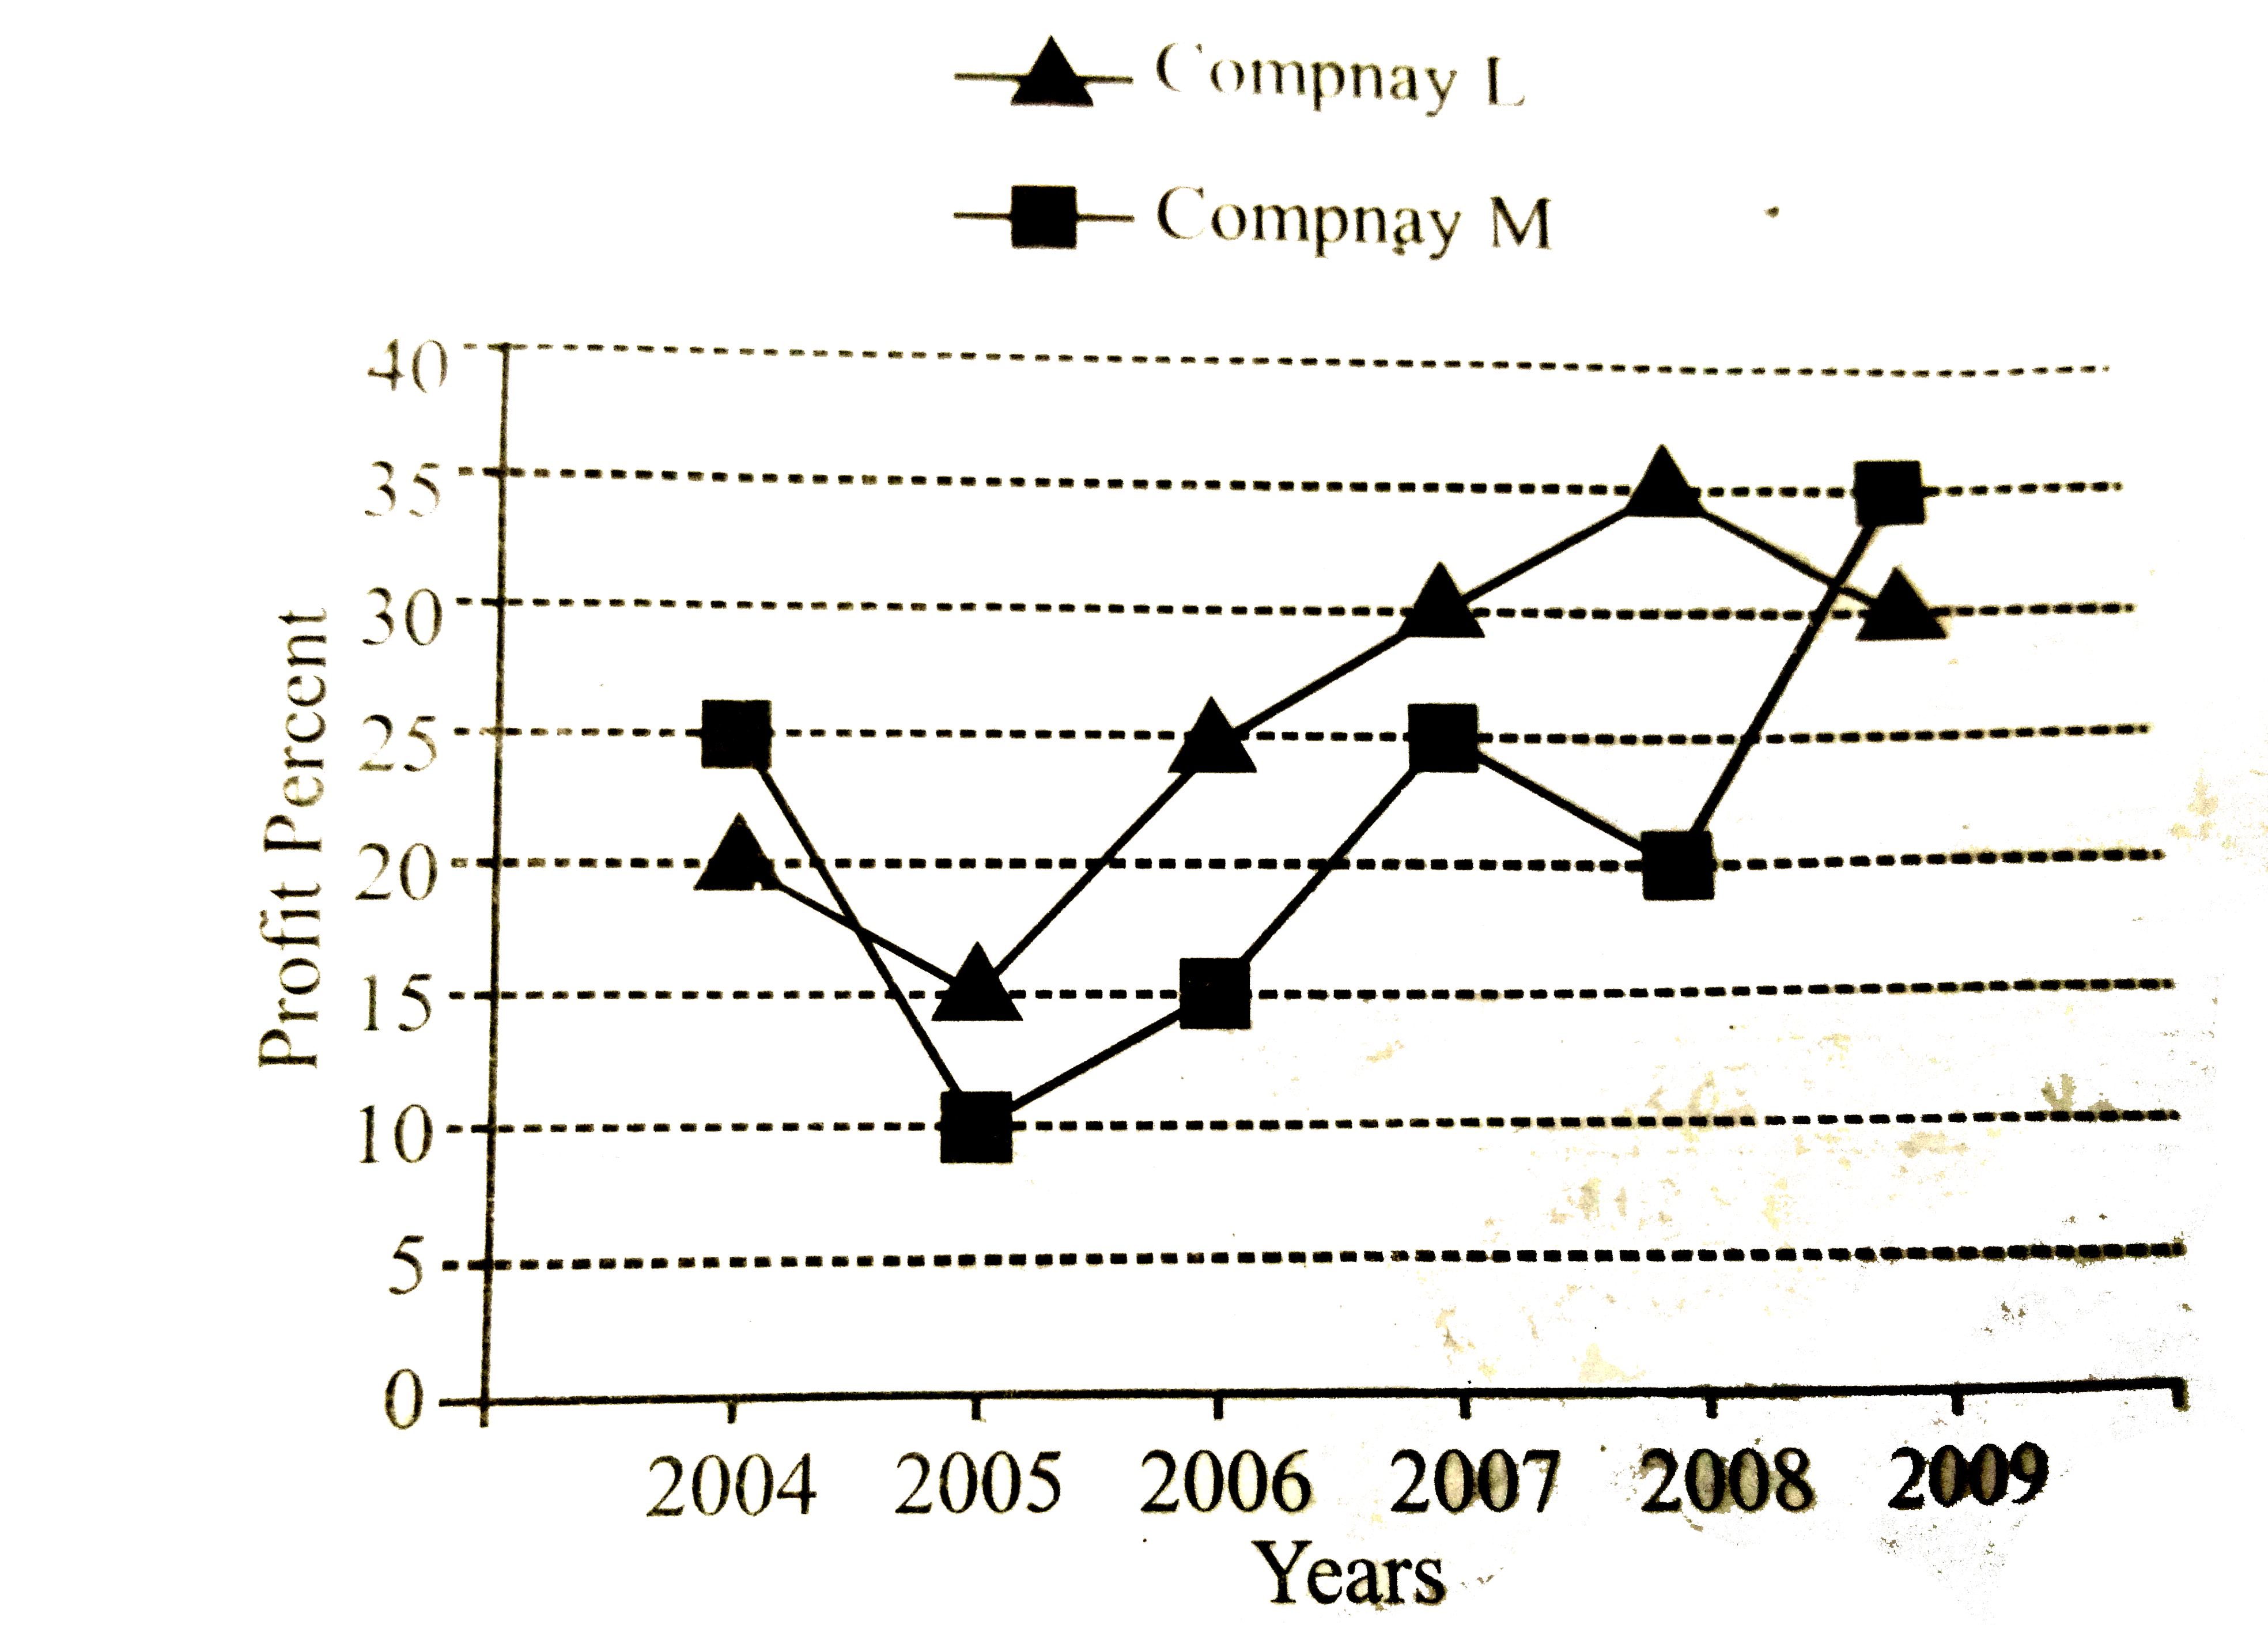
If the profit earned by Company L in the year 2008 was Rs. 3.63 lakhs, what was the amount of prorfit earned by it in the year 2006?
View SolutionThe line chart given below show the ratio of imports to exports for a country for 5 consecutive years Y1, Y2, Y3, Y4 and Y5.
If the exports for year Y3 is Rs.35000 crore, then what will be imports (in crores) for the year Y3?
View Solution
Knowledge Check
Study the following graph carefully and answer the given questions :-
The following graph shows the % profit of two companies over the years :-
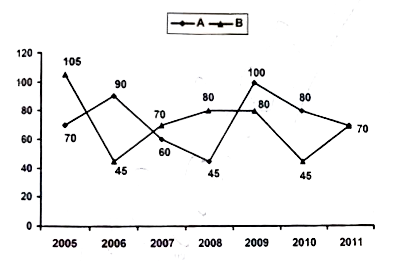
If the total income of company B in 2011 was Rs 200 lakhs what was the expenditure of company A in the same year ?A114.25 lakhB120.10 lakhC100.52 lakhDCan't be determined
If the profit earned by Company L in the year 2008 was Rs. 3.63 lakhs, what was the amount of prorfit earned by it in the year 2006?AX 2.16 lakhB1.98 lakhCX2.42 lakhDcannot be determinedStudy the following graph carefully and answer the given questions :-
The following graph shows the % profit of two companies over the years :-
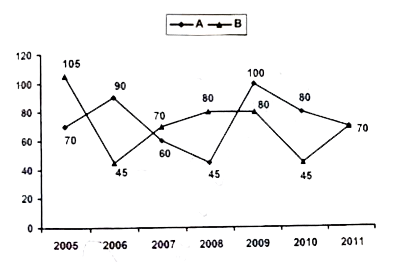
If the total expenditure of company A in 2007 was Rs 150 lakhs what was the total income ?AA) Rs 240 lakhsBB) Rs 250 lakhsCC) Rs 260 lakhsDD) Data inadequate
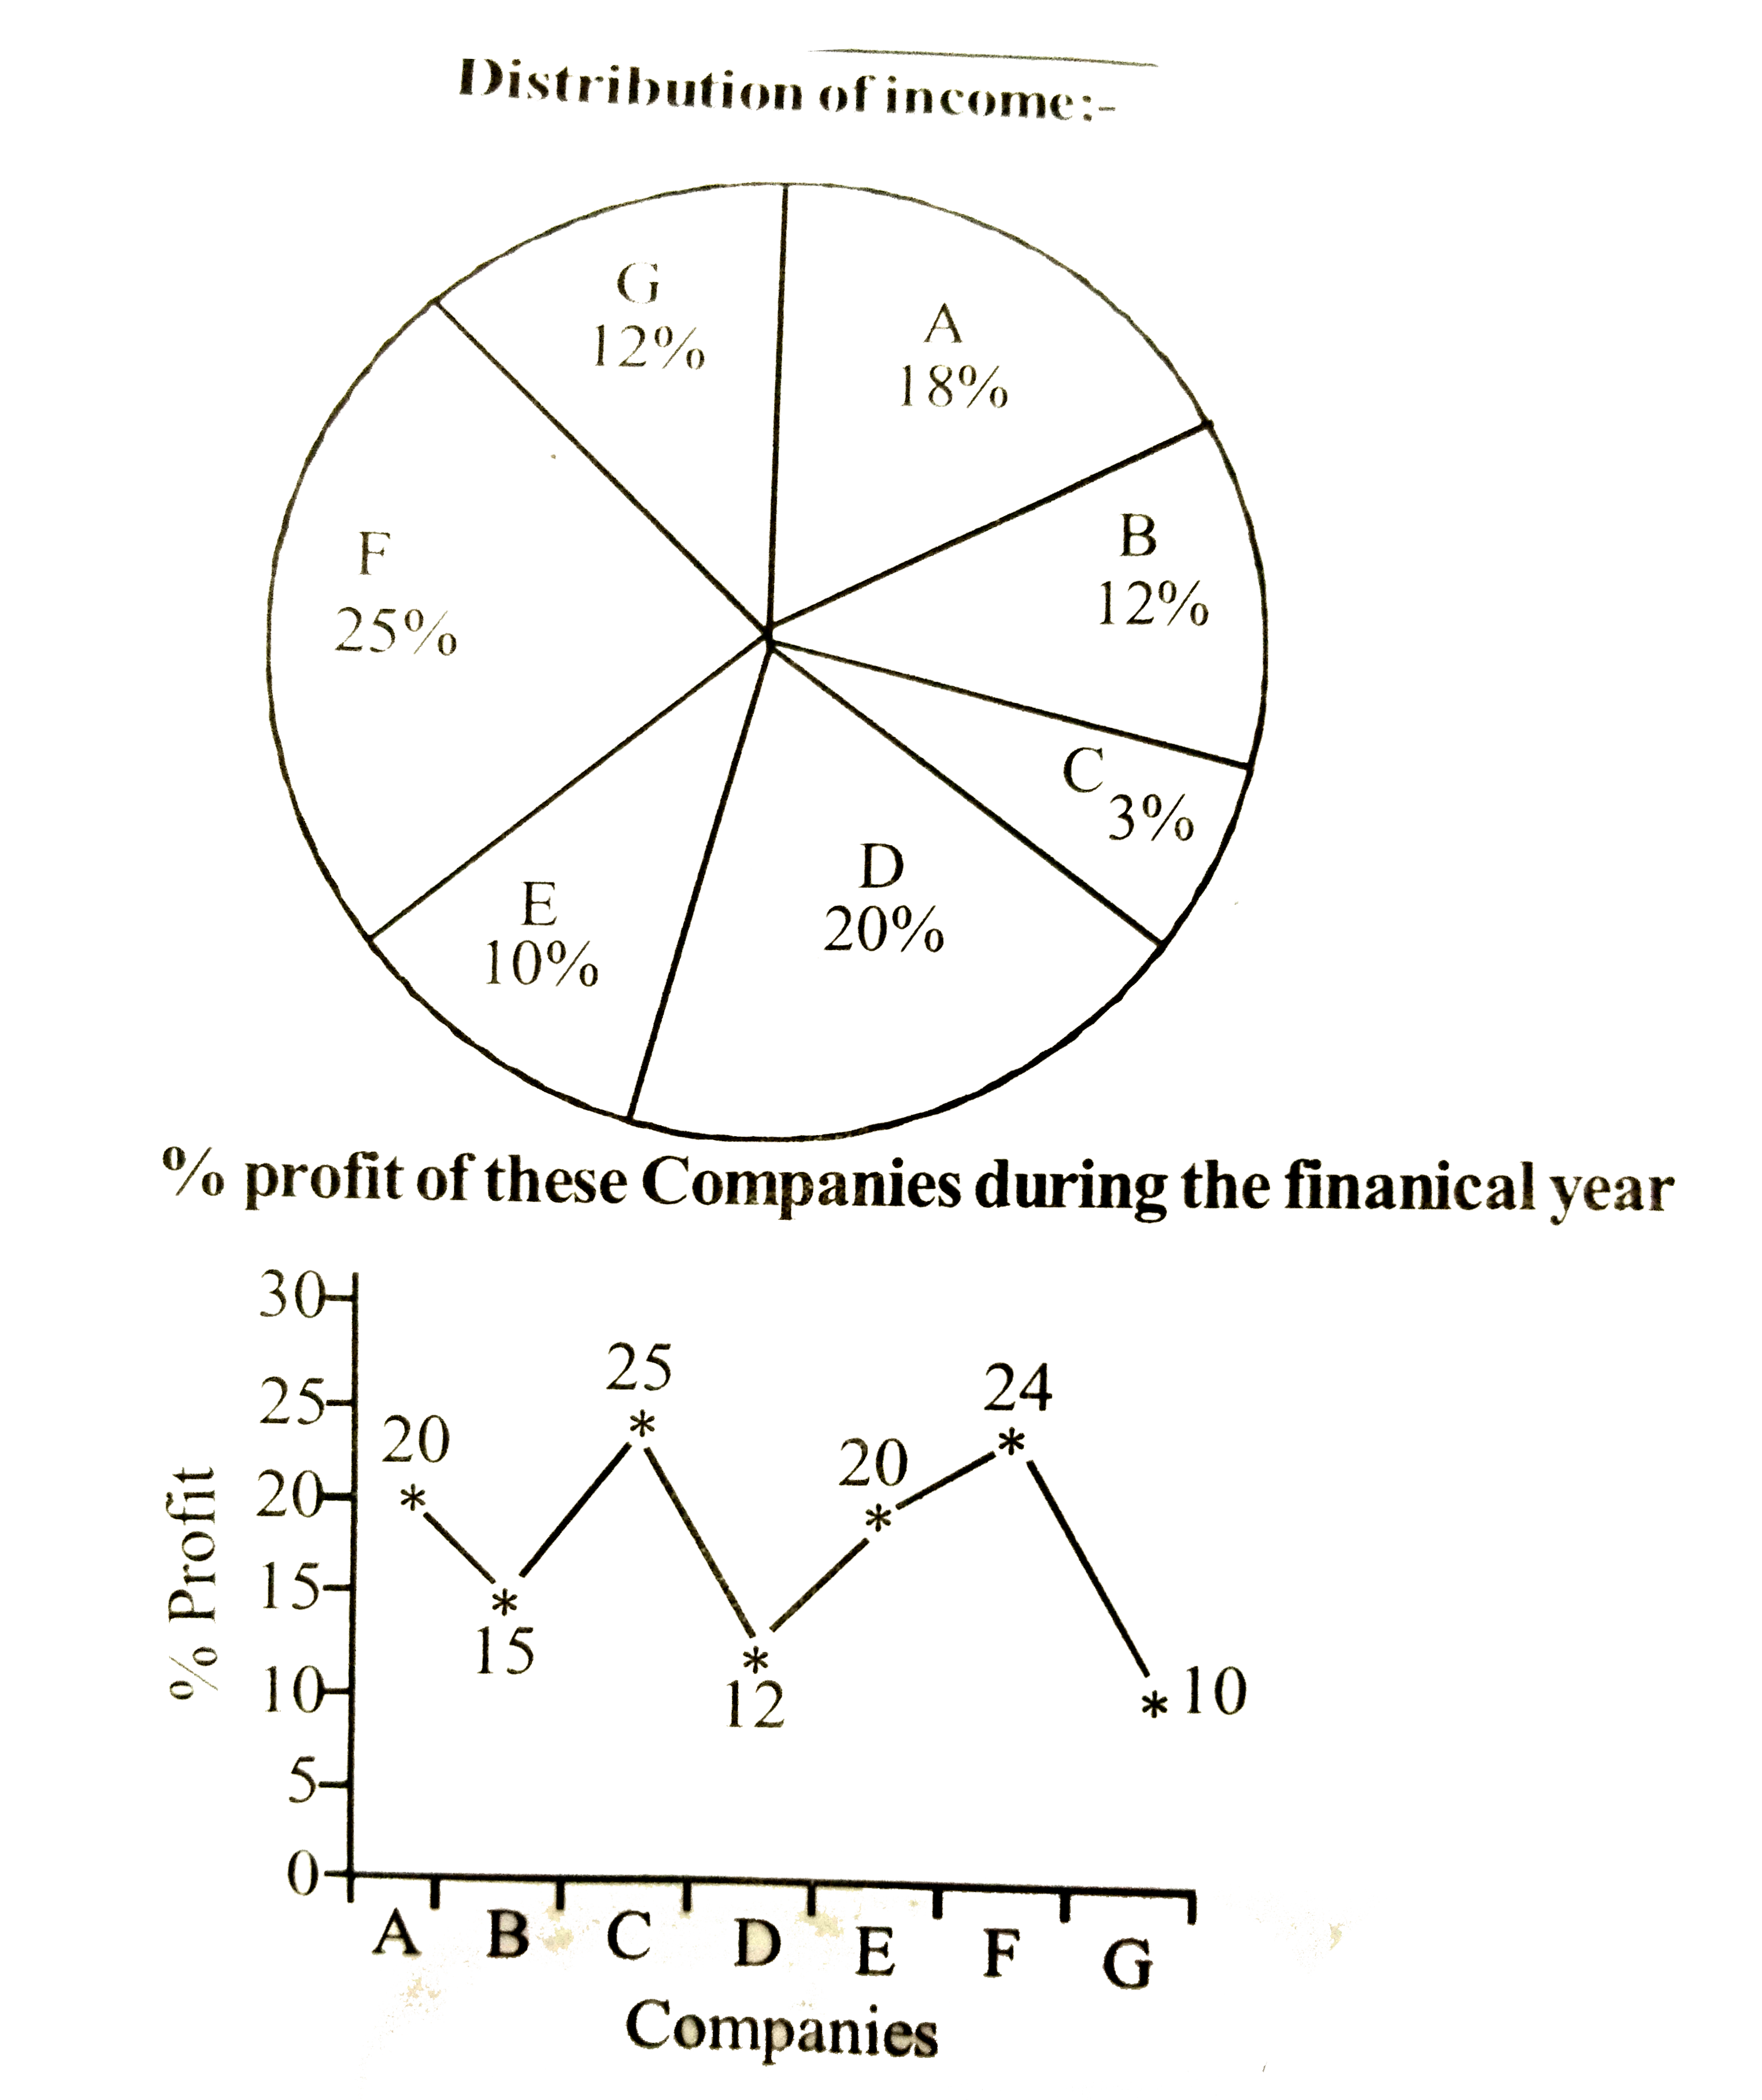
If in the given financial year income of company 'D' was Rs. 535 cr, what was the approximate expenditure of company 'B' in that year ?
View SolutionStudy the following graph and answer the questions.
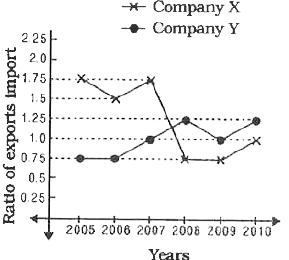
In 2005, the exports of company X were double that of company Y in that year. If the imports of company X during the year were Rs 180 crores, what was the amount (in crore Rs) on imports of company Y during the year ?
View SolutionThe following line graph shows the ratio of imports and exports of a company during a period of 1995-2001. Study the graph carefully and answer the questions.
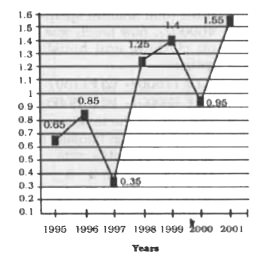
In which year was the ratio of imports to exports maximum ?
View SolutionThe following line graph gives the ratio of the amounts of imports by a company to the amount of exports from that company over the period from 1995 to 2001.
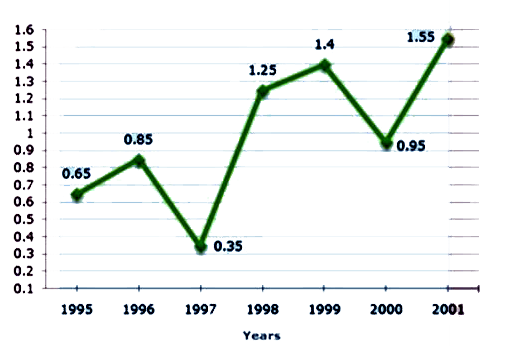
What was the percentage increase in imports from 1997 to 1998 ?
View SolutionThe following line graph gives the ratio of the amounts of imports by a company to the amount of exports from that company over the period from 1995 to 2001.
Ratio of Value of Imports to Exports by a Company Over the Years.
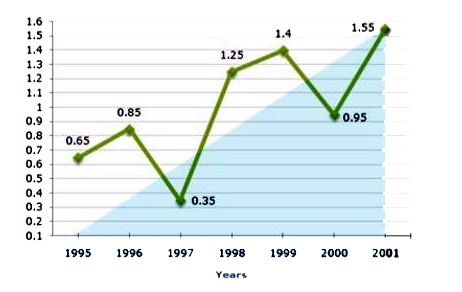
In which year, the imports were minimum proportionate to the exports of the company ?
View Solution
