The following line graph gives the ratio of the amounts of imports by a company to the amount of exports from that company over the period from 1995 to 2001.
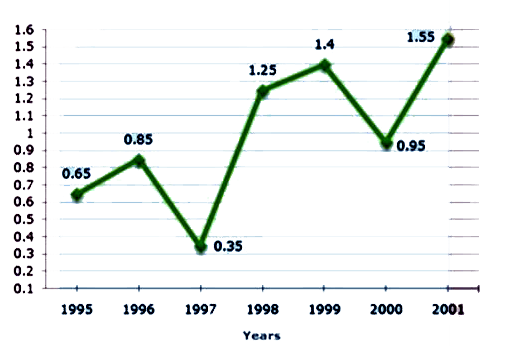
What was the percentage increase in imports from 1997 to 1998 ?
28
Data inadequate
72
56
The correct Answer is:A
Step by step video, text & image solution for The following line graph gives the ratio of the amounts of imports by a company to the amount of exports from that company over the period from 1995 to 2001. What was the percentage increase in imports from 1997 to 1998 ? by Maths experts to help you in doubts & scoring excellent marks in Class 14 exams.
Topper's Solved these Questions
- BOOK - SSC SELECTION POSTCHAPTER - PREVIOUS YEAR PAPER GRADUATION LEVEL (16 OCT 2019)EXERCISE - Quantitative Aptitude Basic Arithmetic Skill25videos
PREVIOUS YEAR PAPER GRADUATION LEVEL (16 OCT 2019)
- BOOK - SSC SELECTION POSTCHAPTER - SSC PREVIOUS YEAR PAPER GRADUATION LEVEL (15 OCT 2019) EXERCISE - SECTION : QUANTITATIVE APTITUDE BASIC ARITHMETIC SKILL25videos
SSC PREVIOUS YEAR PAPER GRADUATION LEVEL (15 OCT 2019)
Similar Questions
Knowledge Check
- Question 1 - Select One
The following line graph gives the ratio of the amounts of imports by a company to the amount of exports from that company over the period from 1995 to 2001.
Ratio of Value of Imports to Exports by a Company Over the Years.
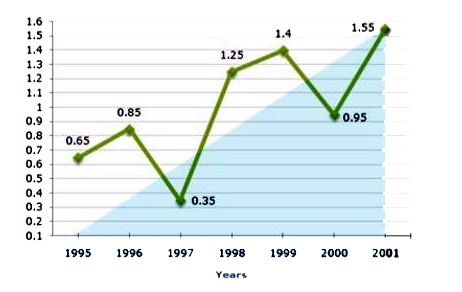
In which year, the imports were minimum proportionate to the exports of the company ?A1996B1995C2000D1997 - Question 2 - Select One
A table below shows the production and imports of circle oil (in '000 tonnes). Domestic production of crude oil is total of on-share and off-shore production, which is supplemented by imports to meet the total demand of crude oil in the country.

What was the approx-percentage increase in imports of crude oil from 2001 to 2003 :A49%B65%C43%Dnone of these - Question 3 - Select One
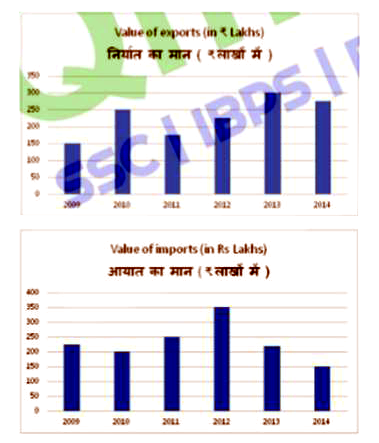
Following is a data regarding export and import of a company over the years. Answer the question given below.
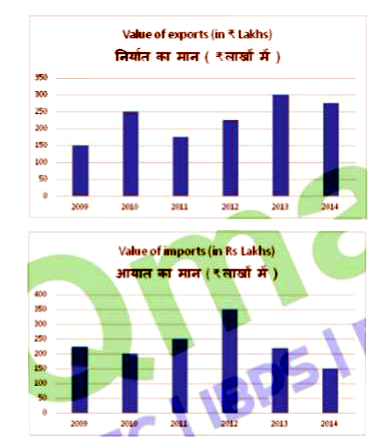
What was the percentage increase in imports fromyear 2011 to 2012?A25%B40%C20%D50%
The bar graph given below shows the data of the production of paper (in lakh tonnes) by three different companies P, Q and R over the years.
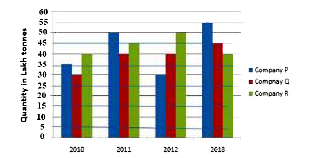
What is the percentage increase in the productionby company Q from 2010 to 2013?View SolutionStudy the following graph carefully and answer the questions given below it -----
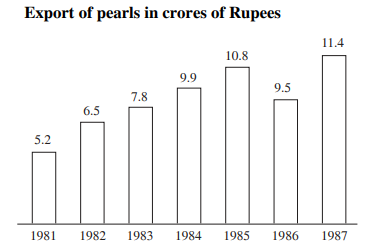
What was the percentage increase in export from 1986 to 1987 ?View SolutionThe following line graph shows the ratio of imports and exports of a company during a period of 1995-2001. Study the graph carefully and answer the questions.
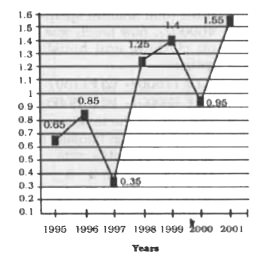
In which year was the ratio of imports to exports maximum ?View SolutionThe following line graph shows the ratio of imports and exports of a company during a period of 1995-2001. Study the graph carefully and answer the questions.
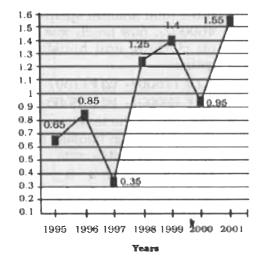
If the value of imports by the company in 1995 was Rs. 247 crores, what was the value of its exports in 1995?View SolutionFollowing is a data regarding export and import of a company over the years. Answer the question given below.
What was the percentage decline in the value of exports from 2010 to 2011?View Solution

