The Line graph shows the number of people (Boys + girls) visited five (A, B, C, D & E) different parks and the number of girls visited out of total people visited these five parks. Read the data carefully and answer the questions.
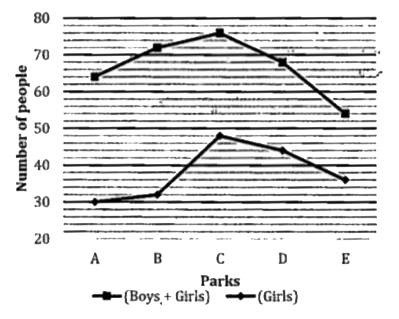
If total number of people visited in park F are 18 more than total number of people visited in park C and D together and out of total people visited in park F, 4/9 th are girls, then find number of boys visited in park F?
90
92
96
84
The correct Answer is:A
Step by step video & image solution for The Line graph shows the number of people (Boys + girls) visited five (A, B, C, D & E) different parks and the number of girls visited out of total people visited these five parks. Read the data carefully and answer the questions. If total number of people visited in park F are 18 more than total number of people visited in park C and D together and out of total people visited in park F, 4/9 th are girls, then find number of boys visited in park F? by Maths experts to help you in doubts & scoring excellent marks in Class 14 exams.
Updated on:21/07/2023Topper's Solved these Questions
Similar Questions
Knowledge Check
3,00,000 people visited a park in 200 days and same number of people visited the park everyday. How many people visited the park in 1 day?
A15000B150C1500D3000In a city 20% people are literates. If the number of literate people is 5000, then what is the total number of people?
A25000B35000C20000D40000Study the following graph carefully and answer the questions given below it :-
Number of people working in various departments of two different organisation:
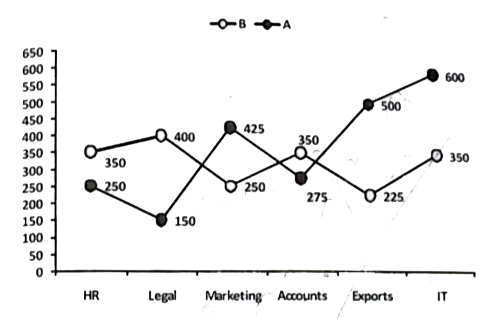
What is the total number of people working in organisation B?A1925B1950C1975D1875
3,16,160 people visited a park in 256 days. How many people visited the park in 1 day?
View Solution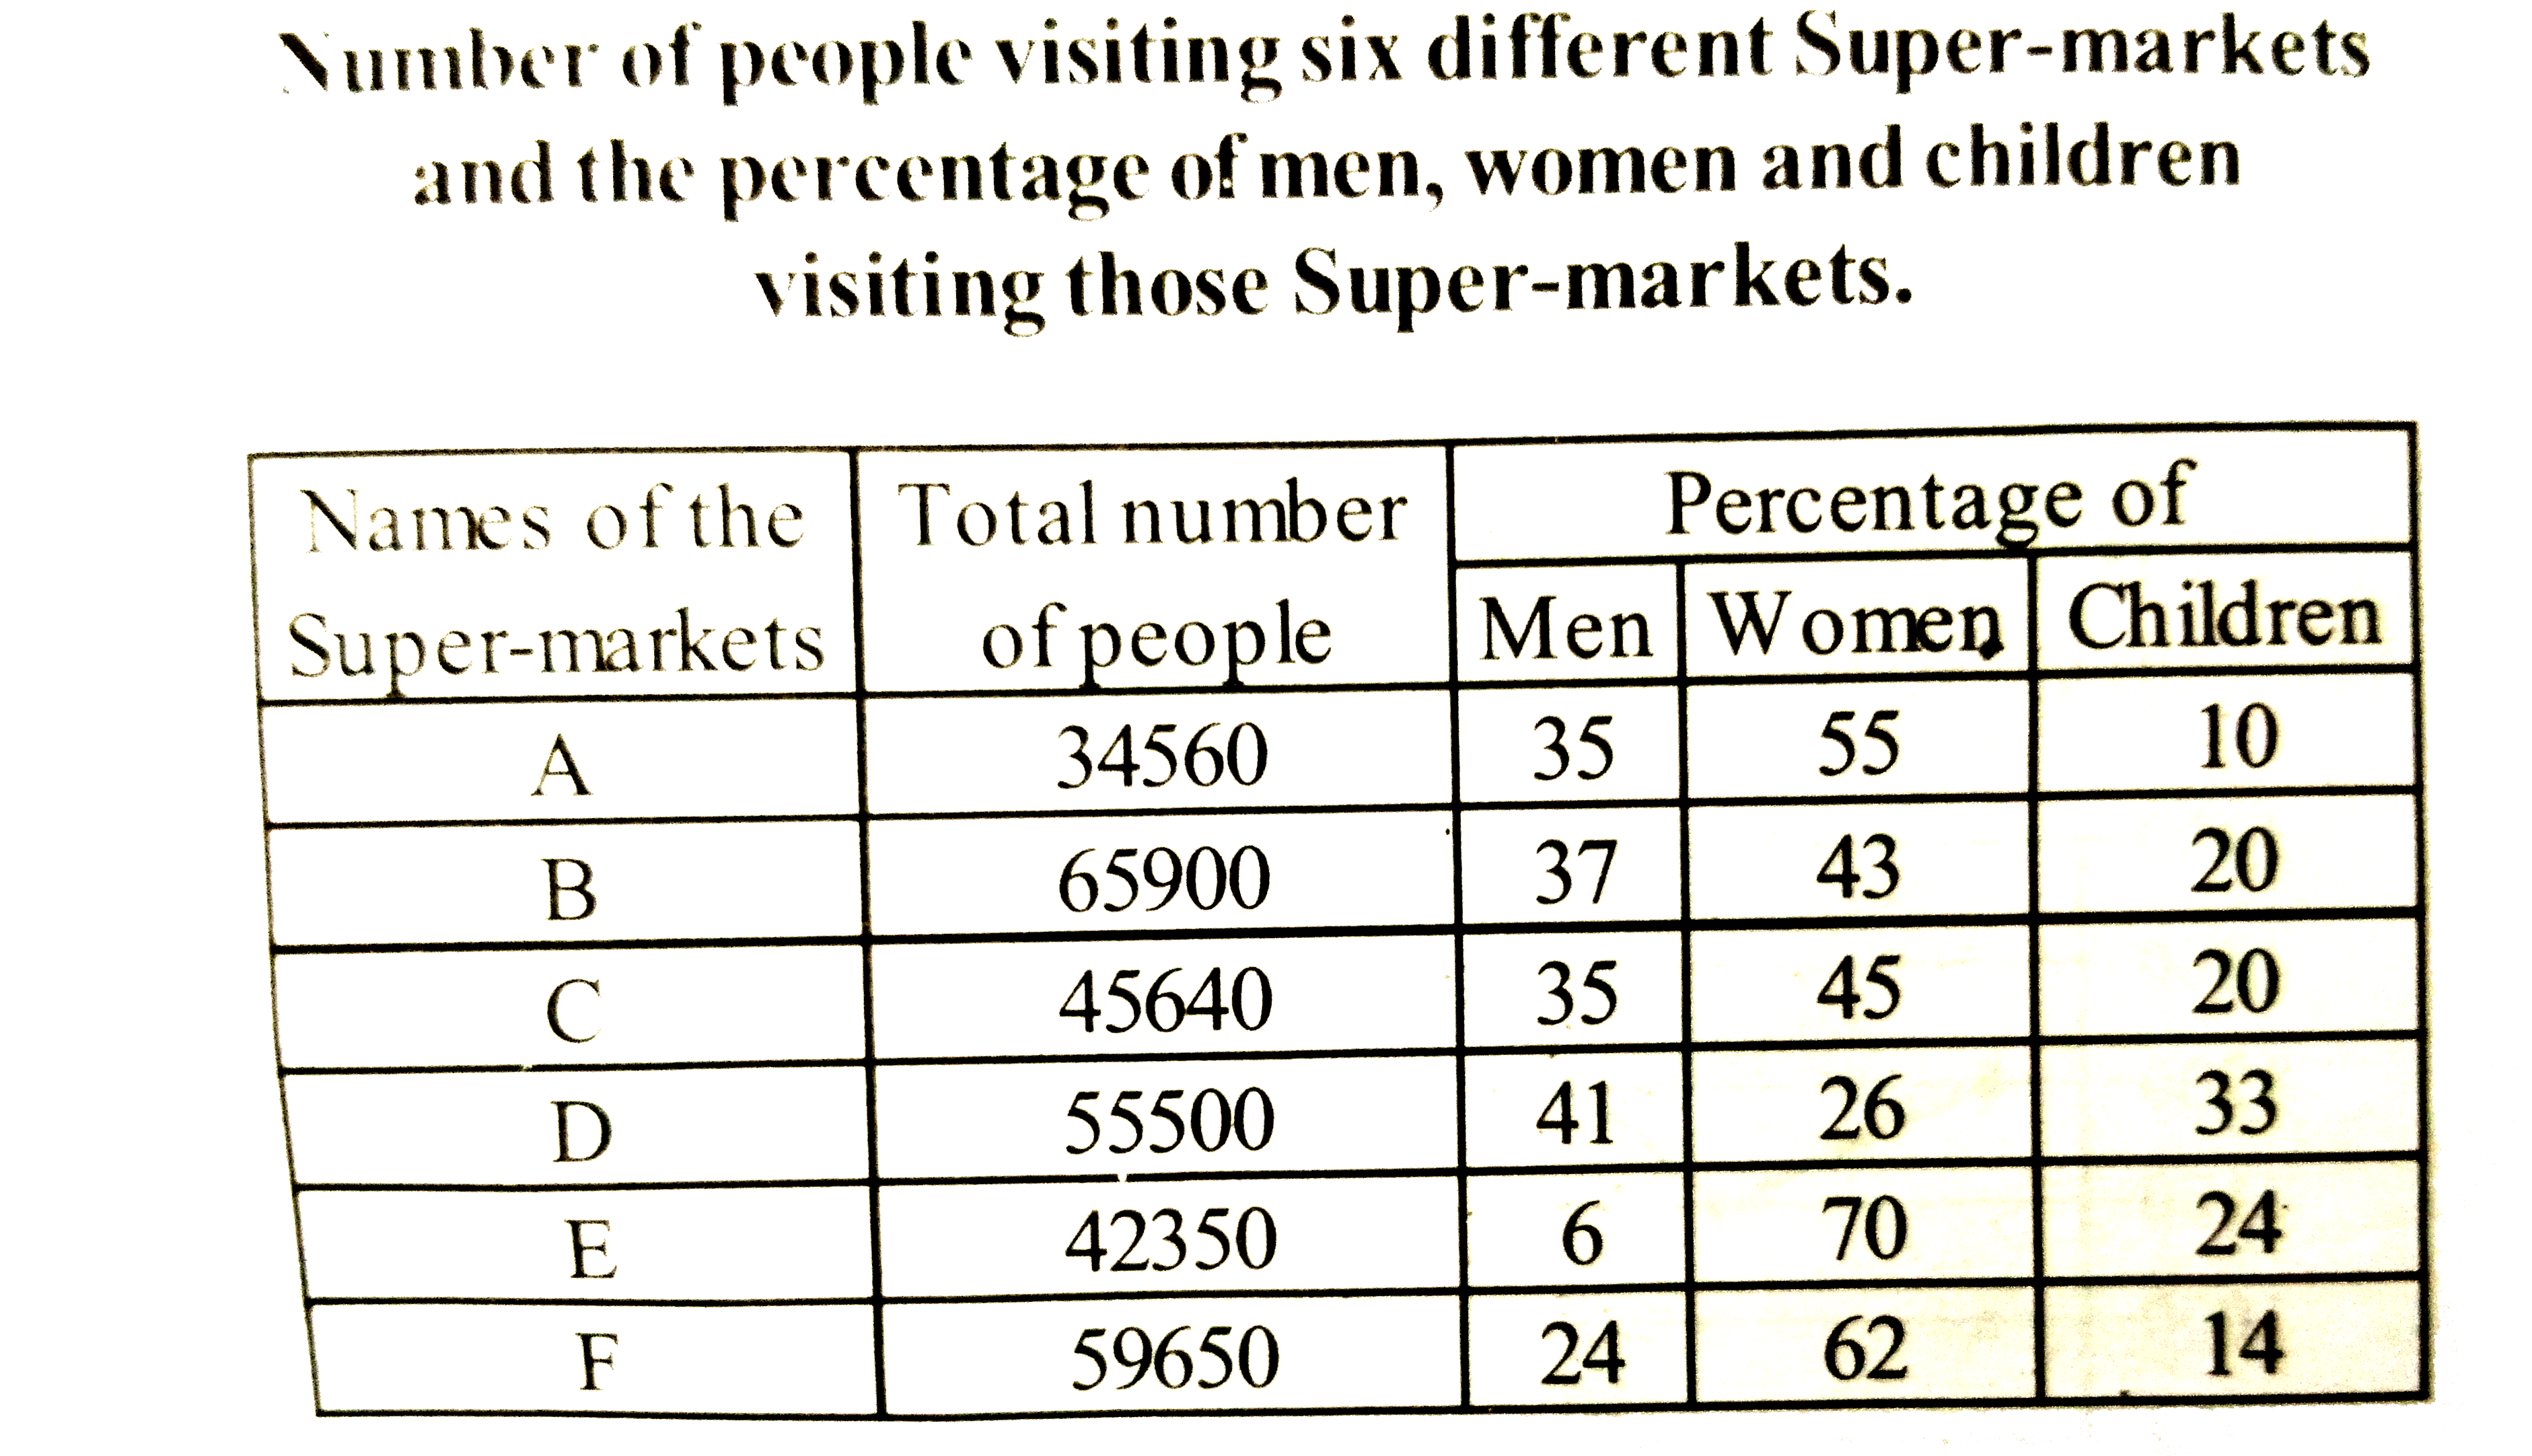
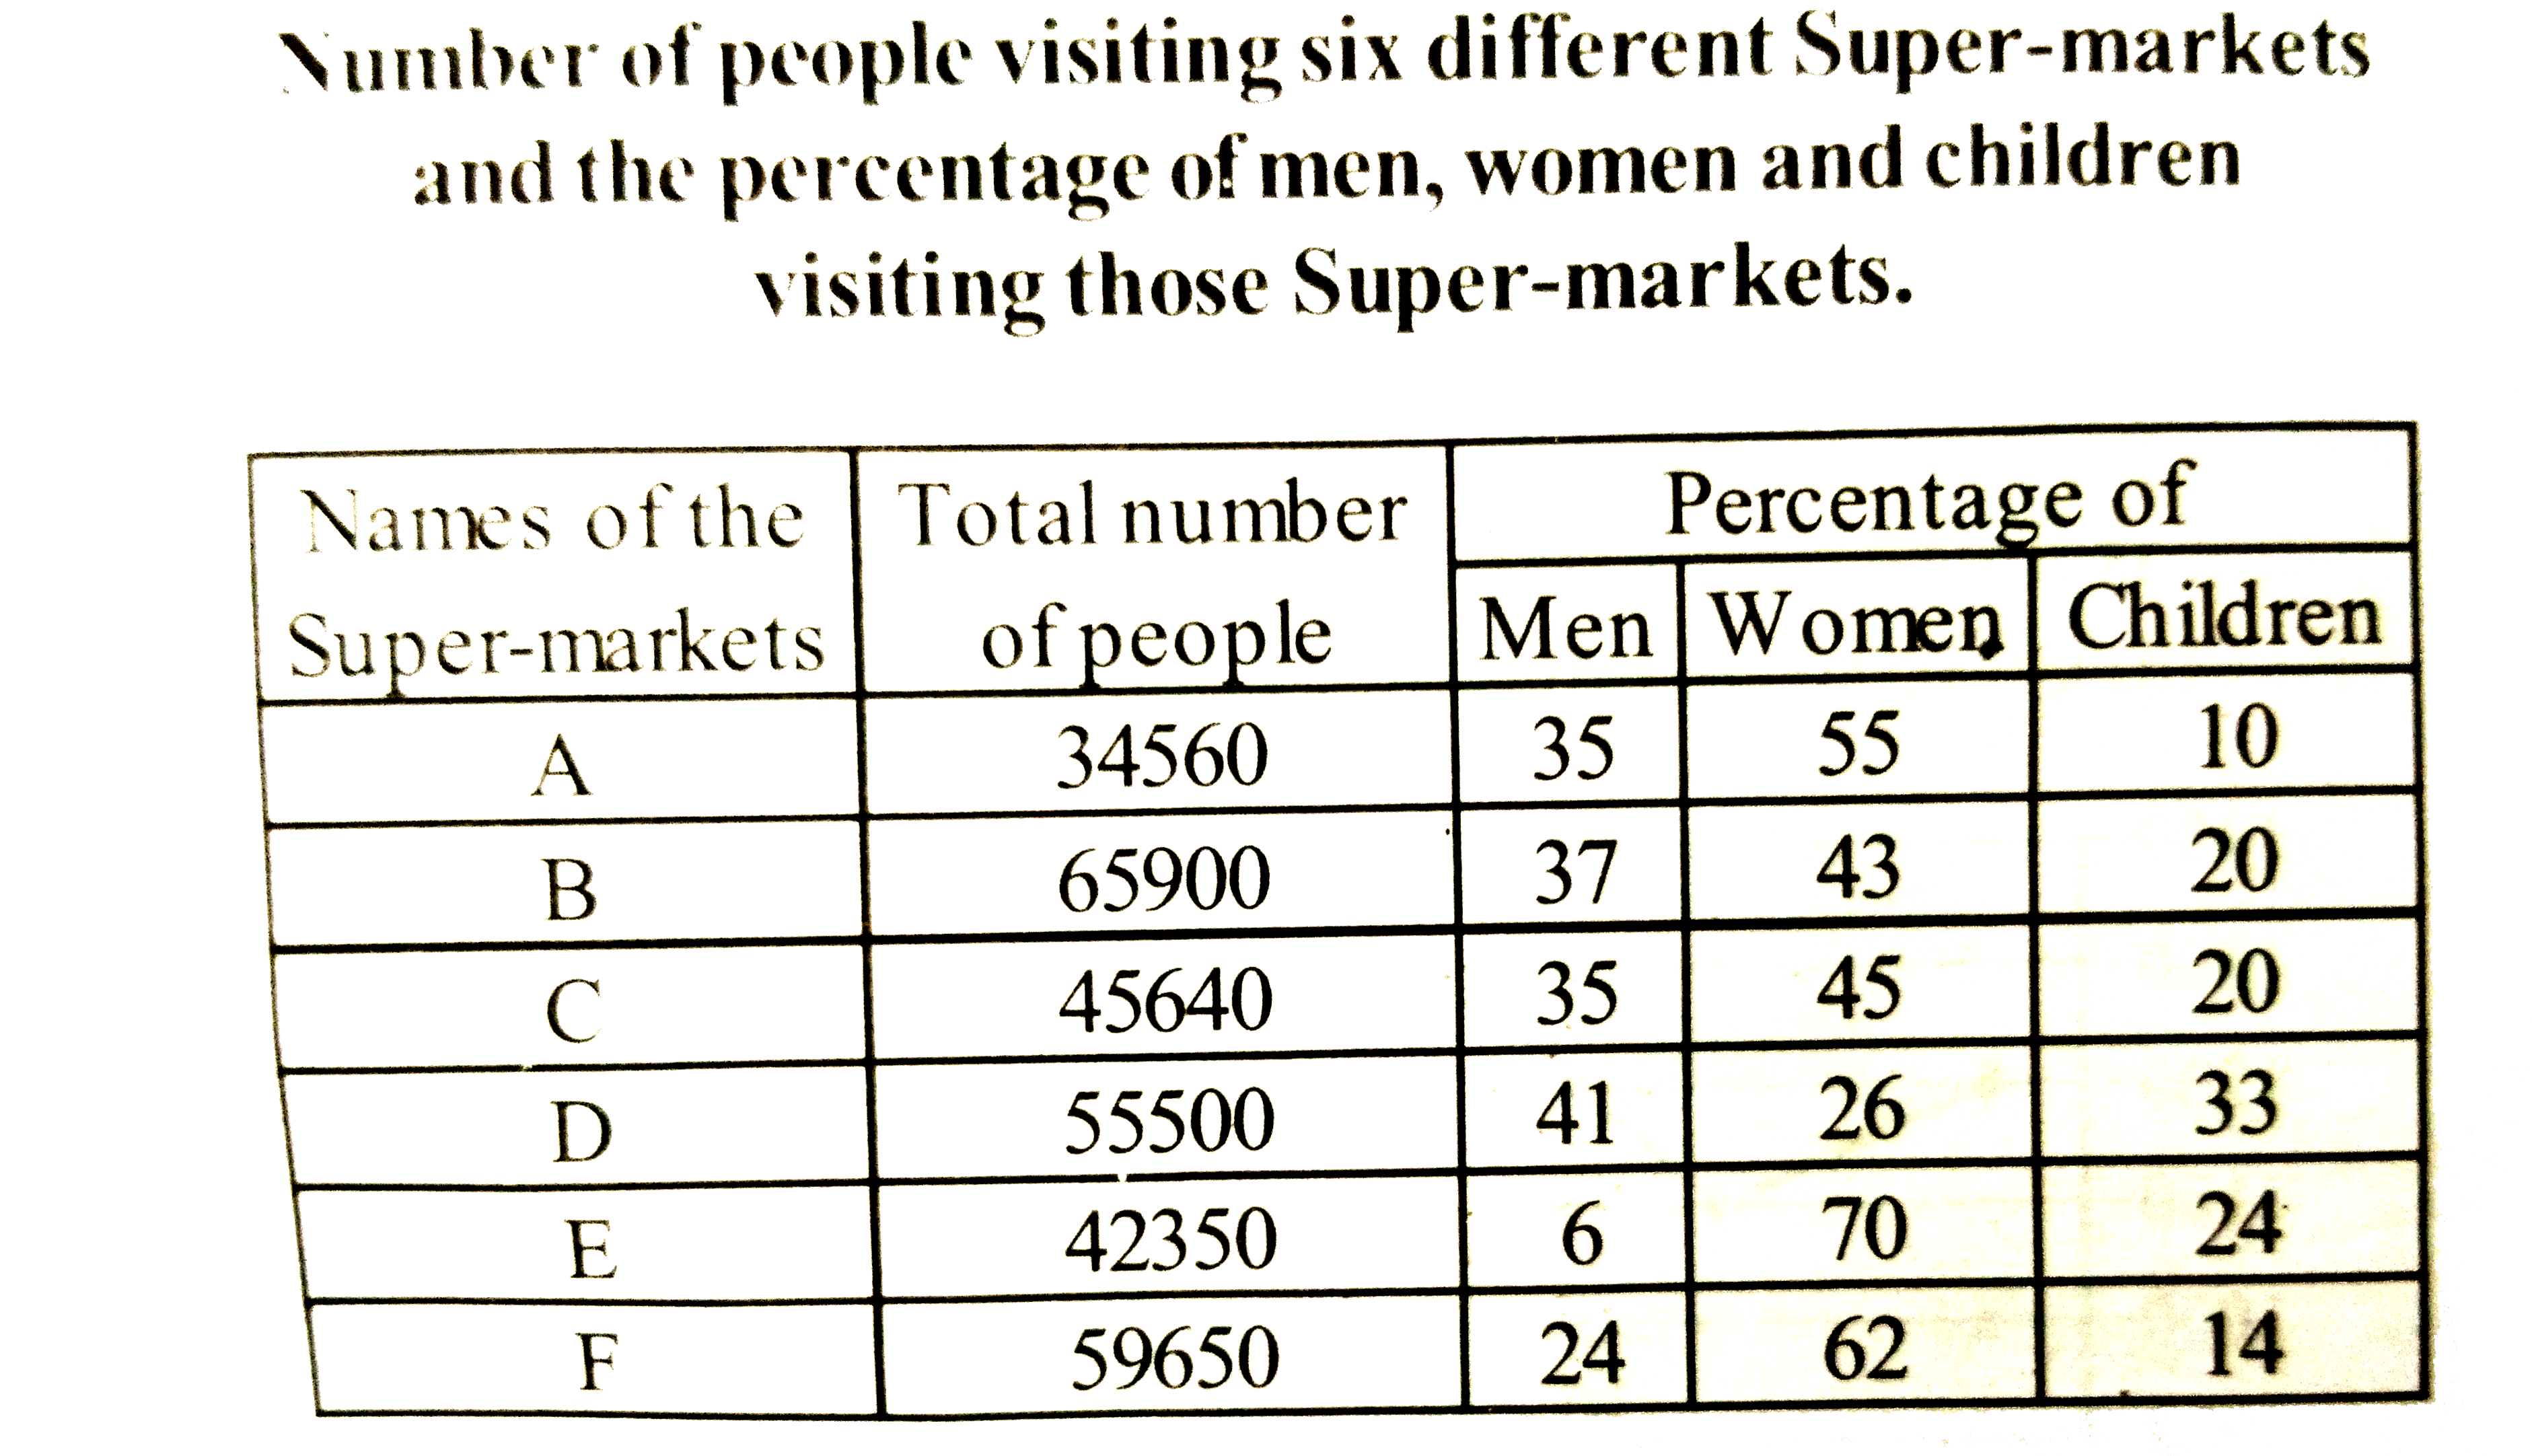
Number of men visiting Super-market D from approximtely what percent of the total number of people visiting all the Super-markets together ?
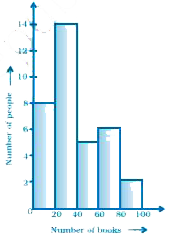
View SolutionDirections: The following bar graph shows the number of pages in five different books (viz. A, B, C, D and E). Study the graph carefully and answer the following questions.
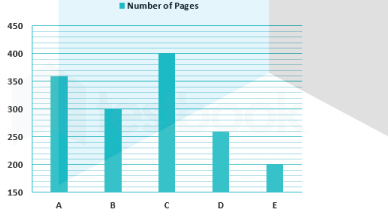
What is the ratio of total number of pages in book B and E together to the total number of pages in book C and D together?
View Solution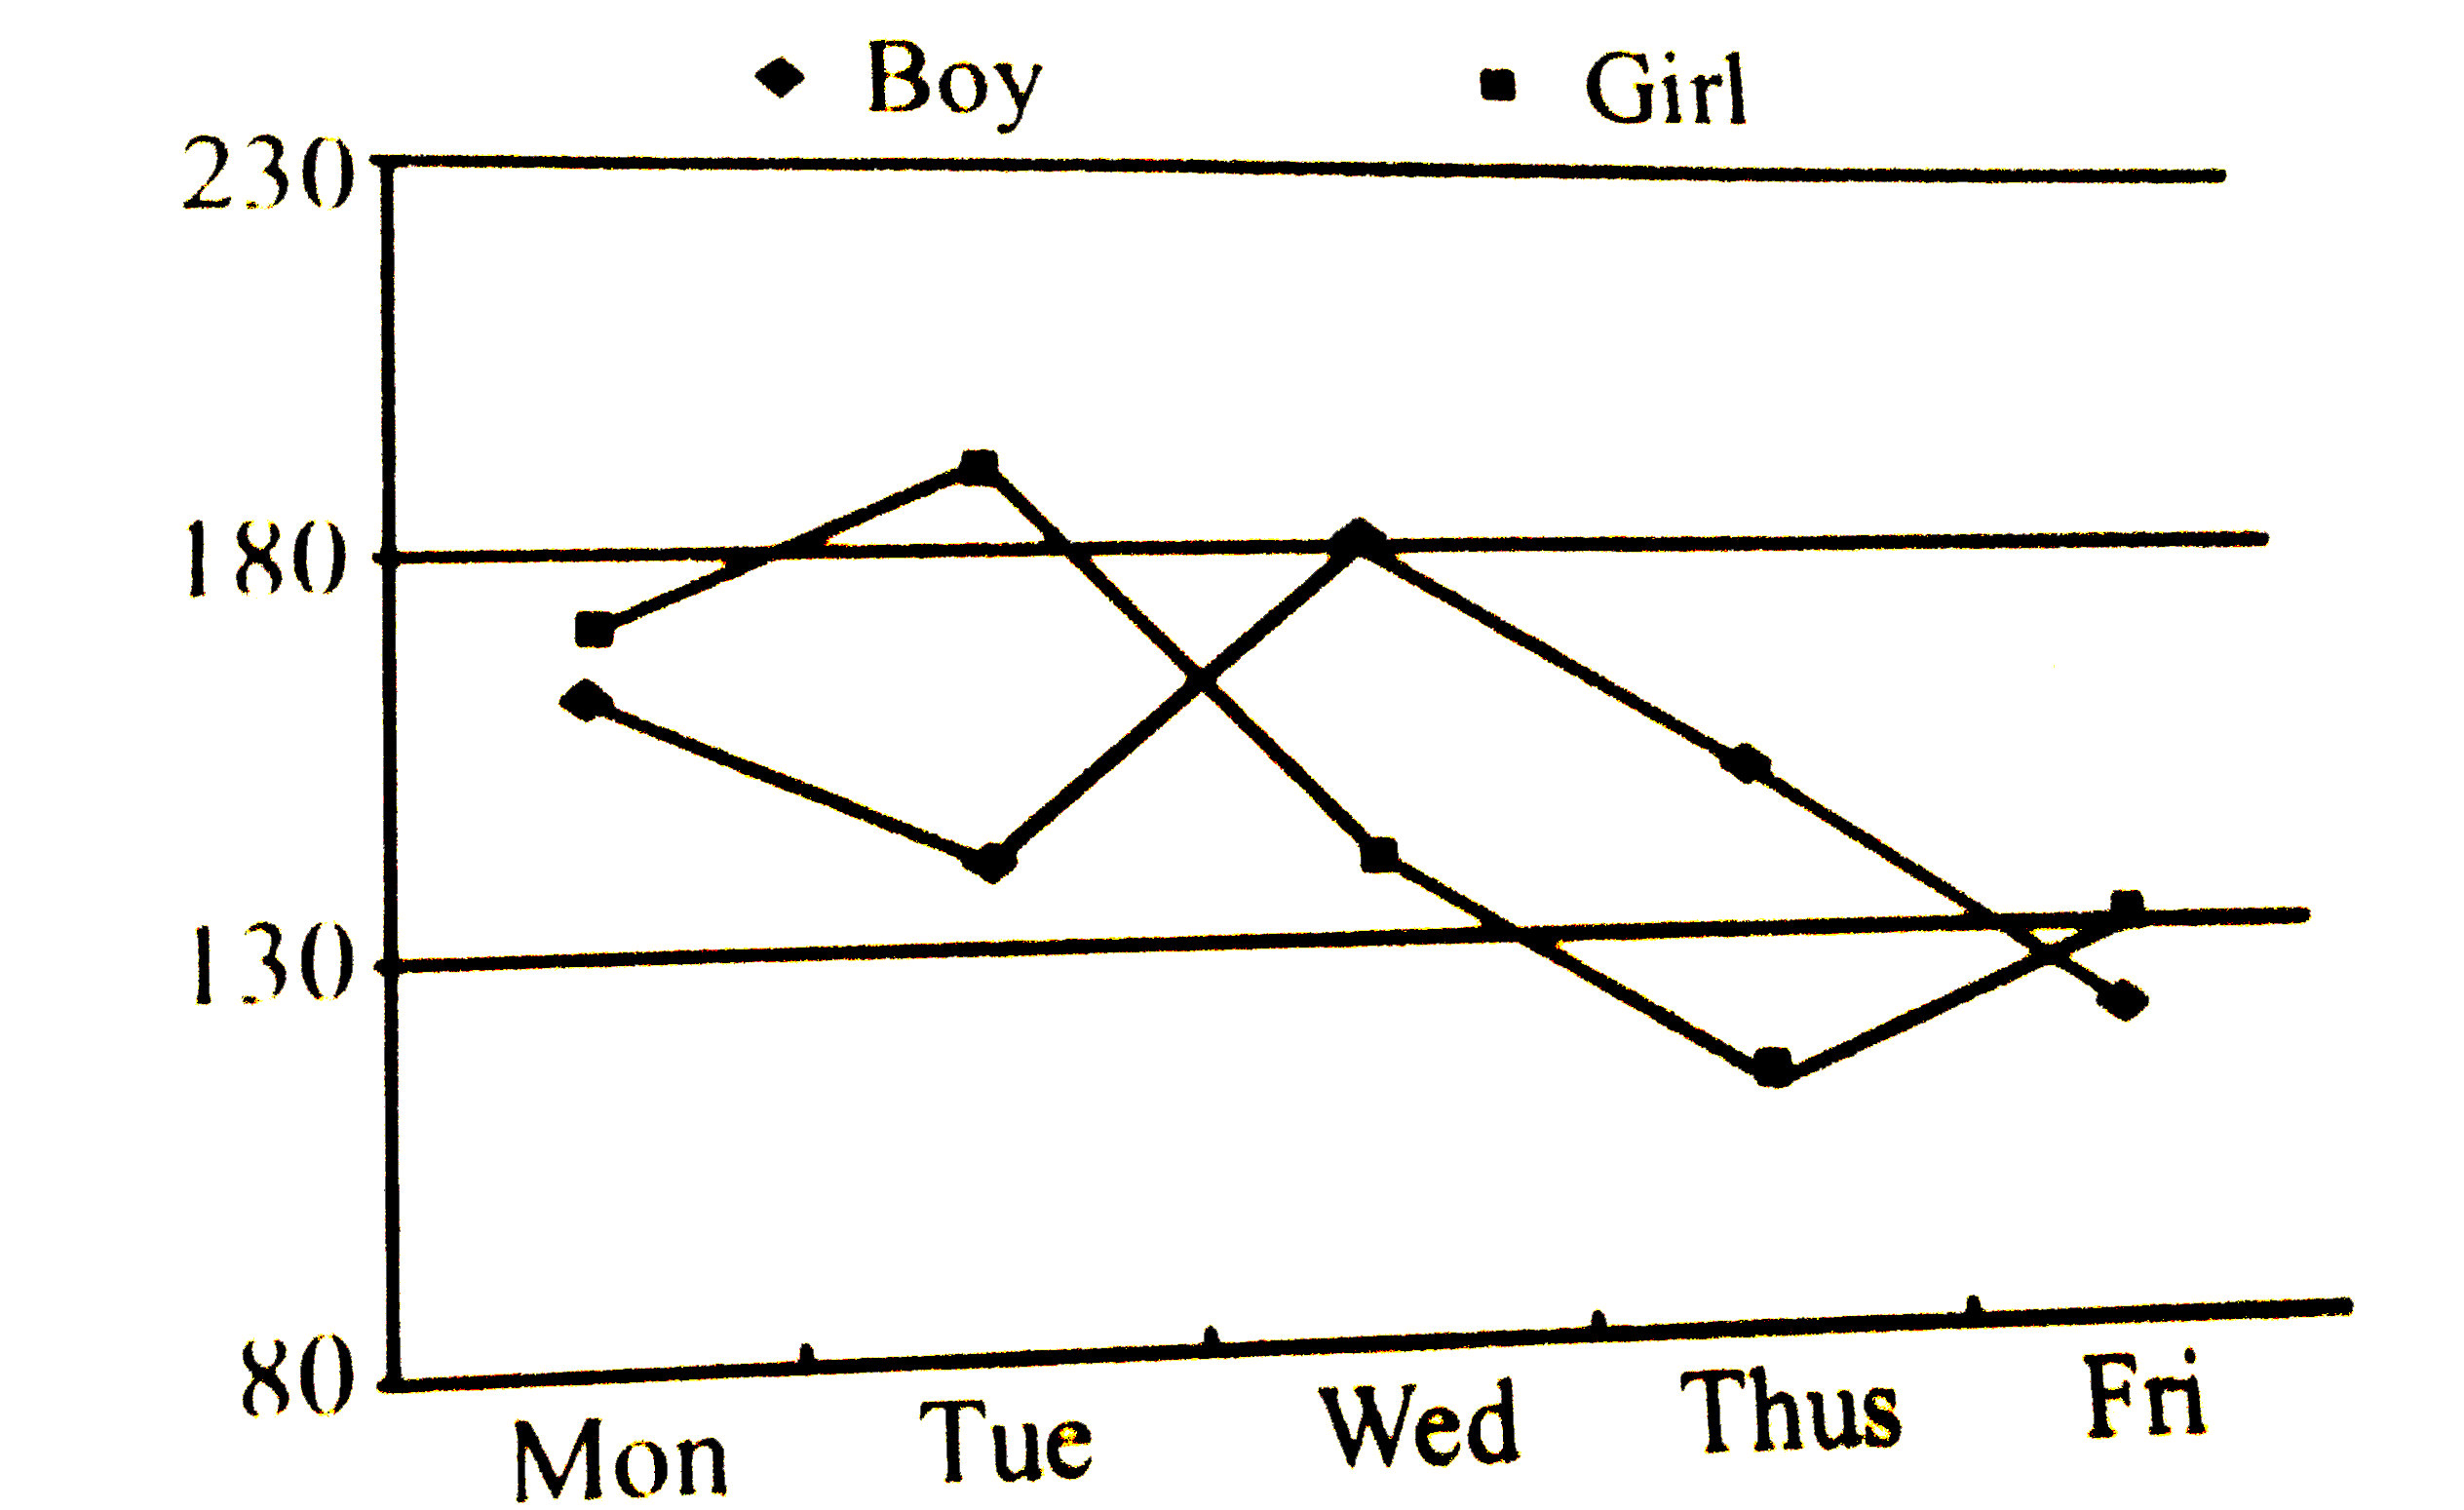
Find the ratio of the total number of boys visited the place on Tusedsay and Thursday together to the total number of girsl visited the place on Monday and Friday together ?
View Solution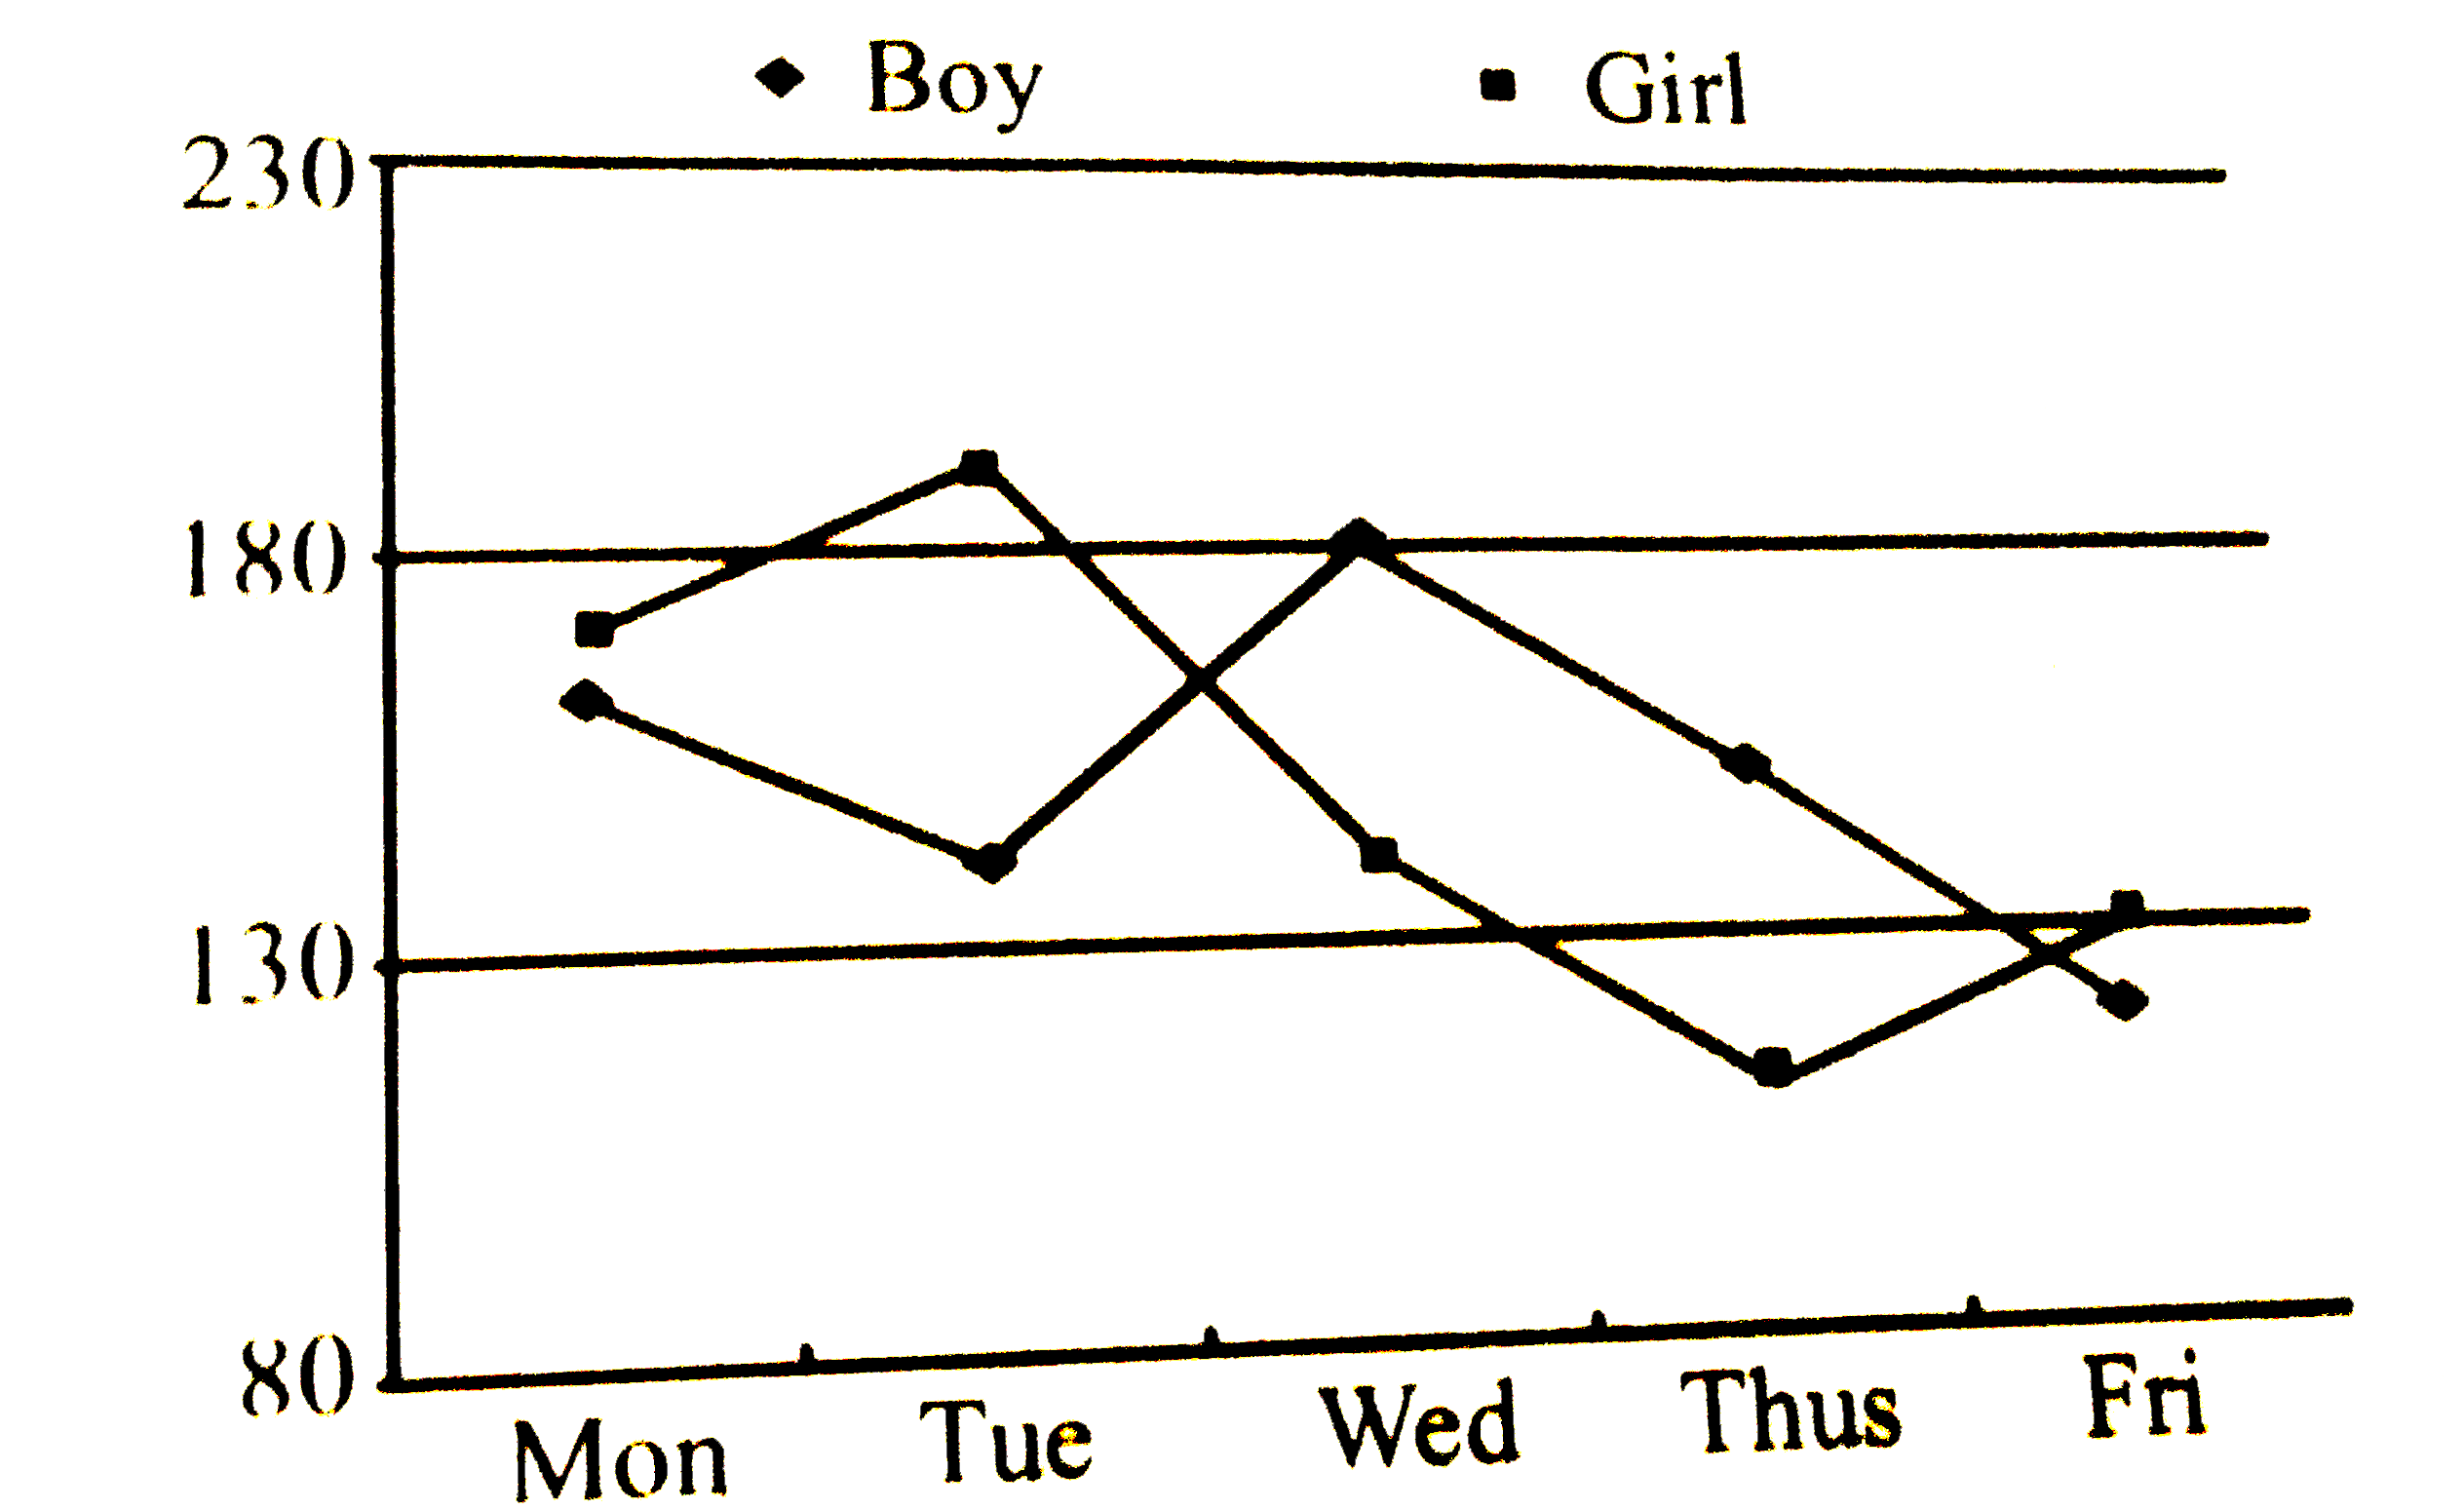
Find the difference between the total number of girls visited the place from Monday to Wednesday and the total number of boys visited the place from Wednesday to Friday ?
View Solution

