Refer to the graph and answer the given questions.
Data related to number of calories burned by two individuals (A and B) on treadmill during 5 days
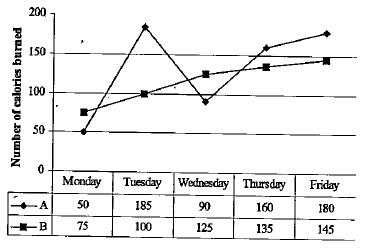
The number of calories burned by B increased by what per cent from Monday to Thursday ?
80
60
70
75
The correct Answer is:A
Step by step video, text & image solution for Refer to the graph and answer the given questions. Data related to number of calories burned by two individuals (A and B) on treadmill during 5 days The number of calories burned by B increased by what per cent from Monday to Thursday ? by Maths experts to help you in doubts & scoring excellent marks in Class 14 exams.
Updated on:21/07/2023Similar Questions
Directions: Refer to the following graph and answer the given questions. Data related to the number of shoes sold by two stores (A and B )during five years:
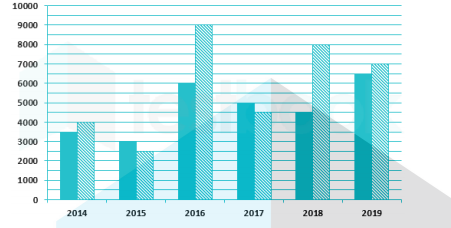
The number of shoes sold by store A decreased by what percent from 2017 to 2018?
View SolutionDirections: Refer to the following graph and answer the given questions. Data related to the number of shoes sold by two stores (A and B )during five years:
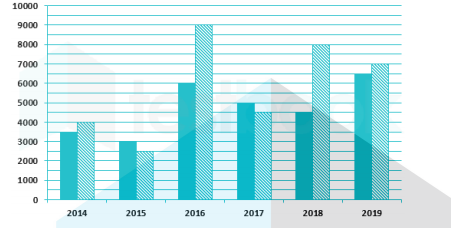
Find the ratio between the total number of shoes sold by stores A and B together in 2016 to the total number of shoes sold by stores A and B together in 2018?
View Solution
Knowledge Check
Refer the following data table and answer the following question.
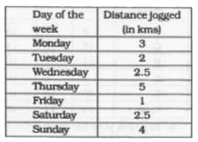
If 400 calories are burnt by jogging 5 km, how many calories were burnt in the given week?A1410 caloriesB1360 caloriesC1310 caloriesD1260 caloriesStudy the following graph carefully and answer the given questions.
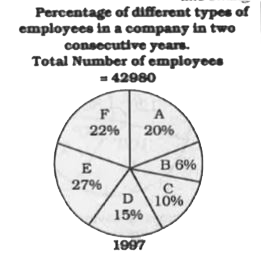
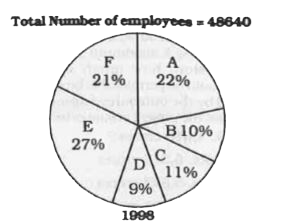
What was the approximate difference in the number of B type of employees during 1997 and 1998 ?A2285B2325C2620D2085
Directions: Refer to the following graph and answer the given questions. Data related to the number of shoes sold by two stores (A and B )during five years:
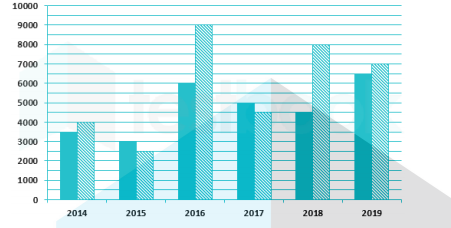
Find the difference between the total number of Shoes sold by Store A and B in all the years together?
View SolutionObserve the bar graph and answer the following questions.
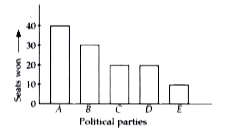
What is the total number of seats won by party A and party B?
View SolutionDirections: Refer to the following graph and answer the given questions. Data related to the number of shoes sold by two stores (A and B )during five years:
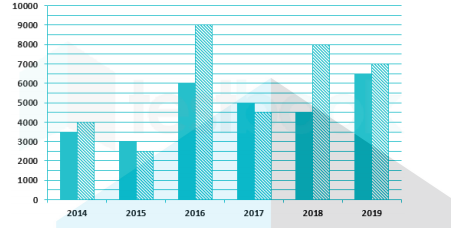
If the respective ratio between the total number of shoes sold by stores A and B together in 2014 and that in 2020 is 5 : 7.What is the total number of shoes sold by stores A and B together in 2020?
View SolutionDirections: Refer to the following graph and answer the given questions. Data related to the number of shoes sold by two stores (A and B )during five years:
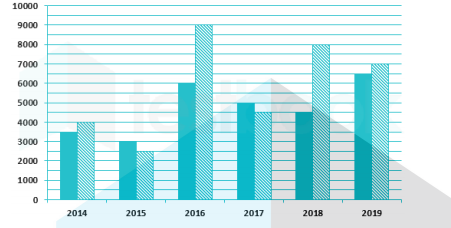
What is the difference between the total number of shoes sold by store A in 2018 and 2019 together and the total number of shoes sold by store B in 2014 and 2015 together?
View SolutionStudy the following information carefully and answer the given questions. Data below represent number of people required for various project to be completed in various days :

If in Team P, total number of workers =0.5Z×2M, then what is the number of days required by Team P to complete Project C?
View Solution
The number of females in Bank B from Agra is what per cent of the females in Bank C from the same city ?
View Solution
