Directions: Refer to the following graph and answer the given questions.
Data related to the number of shoes sold by two stores (A and B )during five years:
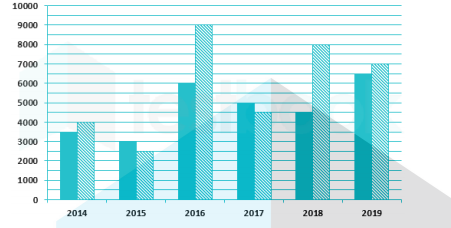
Find the difference between the total number of Shoes sold by Store A and B in all the years
together?
4500
4050
6500
6550
Step by step video & image solution for Directions: Refer to the following graph and answer the given questions. Data related to the number of shoes sold by two stores (A and B )during five years:Find the difference between the total number of Shoes sold by Store A and B in all the years together? by Maths experts to help you in doubts & scoring excellent marks in Class 14 exams.
Updated on:21/07/2023Similar Questions
Directions: Refer to the following graph and answer the given questions. Data related to the number of shoes sold by two stores (A and B )during five years:
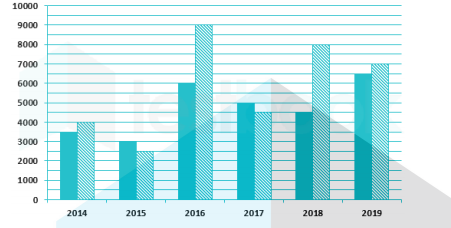
What is the difference between the total number of shoes sold by store A in 2018 and 2019 together and the total number of shoes sold by store B in 2014 and 2015 together?
View SolutionDirections: Refer to the following graph and answer the given questions. Data related to the number of shoes sold by two stores (A and B )during five years:
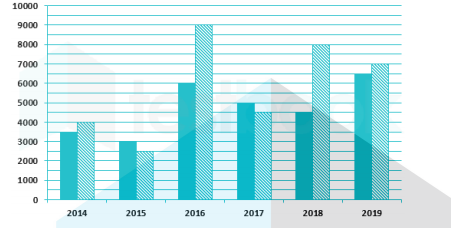
Find the ratio between the total number of shoes sold by stores A and B together in 2016 to the total number of shoes sold by stores A and B together in 2018?
View Solution
Knowledge Check
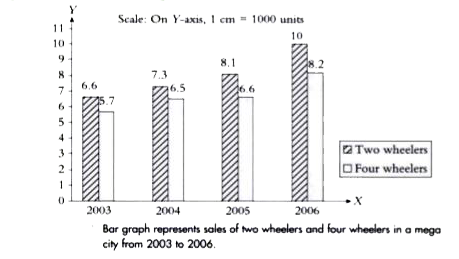
Find the total number of two wheelers sold in four years.A26000B27000C31000D32000The table below depicts the Number of Books Sold by 5 cities during 5 months . Study the following table and answer the question .
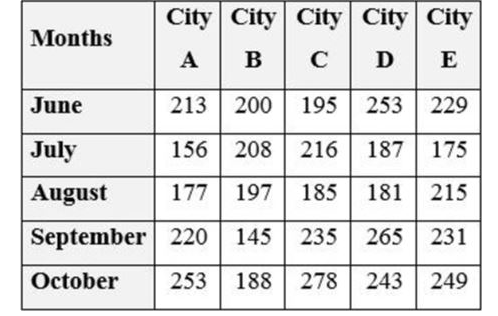
What is the respective ratio between the total number of books sold by City A in July and September together and total number of books sold by City E in August and October together ?
(a)57:49
(b)49:57
(c)58:47
(d)47:58A57:49B49:57C58:47D47:58Study the following graph carefully to answer the questions that follow-----
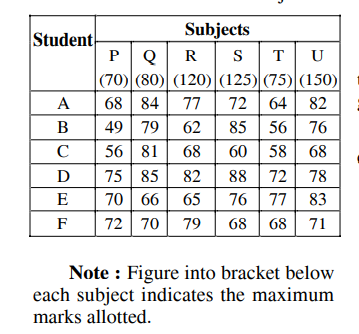
Number of students studying Commerce in the year 2004 forms approximately what percent of the total number of students studying Commerce in all the years together ?A13B20C29D33
Directions: Refer to the following graph and answer the given questions. Data related to the number of shoes sold by two stores (A and B )during five years:
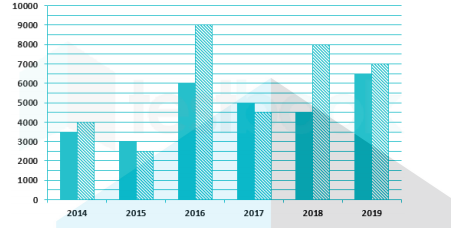
If the respective ratio between the total number of shoes sold by stores A and B together in 2014 and that in 2020 is 5 : 7.What is the total number of shoes sold by stores A and B together in 2020?
View SolutionDirections: Refer to the following graph and answer the given questions. Data related to the number of shoes sold by two stores (A and B )during five years:
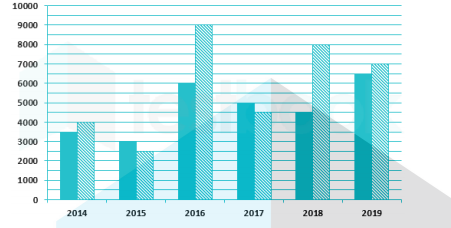
The number of shoes sold by store A decreased by what percent from 2017 to 2018?
View SolutionDirection: The given bar graph shows the number of pens sold by two shops A & B in four consecutive months. Study the following data and answer the following questions:
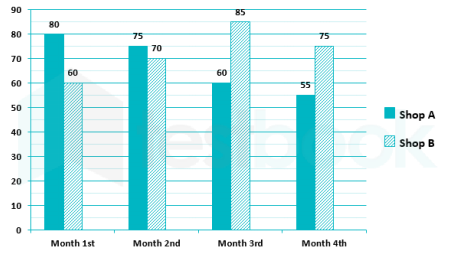
Find the ratio of the number of pens sold by shop A in months 1st and 3rd together to the number of pens sold by shop B in months 2nd and 4th together.
View SolutionDirection: The given bar graph shows the number of pens sold by two shops A & B in four consecutive months. Study the following data and answer the following questions:
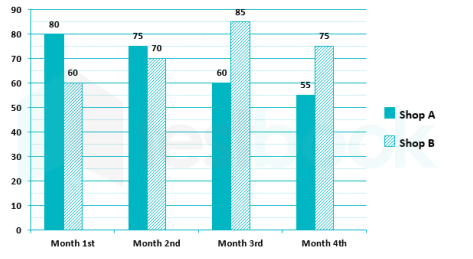
Find that the number of pens sold by shop A in 1st month is how much percent more than the number of pens sold by shop A in 3rd month.
View SolutionThe table below depicts the Number of books Sold by 5 cities during 5 months. Study the following table and answer the questions.
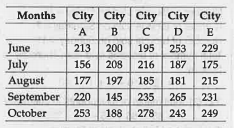
what is the respective ratio between the total number of books sold by City A in July and September together and total number of books sold by City E in August and October together ?
View Solution
