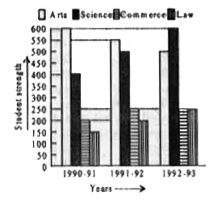
Shown below is the multiple bar diagram depicting the changes in the student's strength of a college in four faculties from 1990-91 to 1992-93.
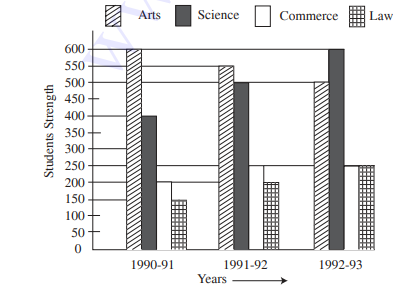
During which year the strength of arts faculty was minimum ?
1990-91
1991-92
1992-93
None of these
The correct Answer is:C
Step by step video, text & image solution for Shown below is the multiple bar diagram depicting the changes in the student's strength of a college in four faculties from 1990-91 to 1992-93. During which year the strength of arts faculty was minimum ? by Maths experts to help you in doubts & scoring excellent marks in Class 14 exams.
Updated on:21/07/2023Topper's Solved these Questions
Similar Questions
Glven here is a multiple bar diagram depicting the changes in the students strength of a college in four faculties from 1990-91 to 199293. Study the diagram and answer the questions.
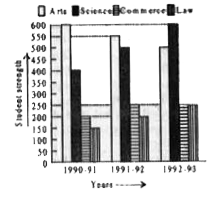
The percentage of students in Science faculty in 1990-91 was
View SolutionGiven here is a multiple bar diagram depicting the changes in the students strength of a college in four faculties from 1990 - 91 to 1992 - 93. Study the diagram and answer the questions.
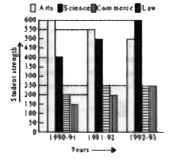
What was the percent increase in Science students from the year 1990 - 91 to 1992 - 93 ?
View Solution
Knowledge Check
Glven here is a multiple bar diagram depicting the changes in the students strength of a college in four faculties from 1990-91 to 199293. Study the diagram and answer the questions.
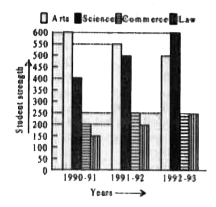
In which faculty was there a regular decrease in students' strength?AArtsBScienceCCommerceDLawGlven here is a multiple bar diagram depicting the changes in the students strength of a college in four faculties from 1990-91 to 199293. Study the diagram and answer the questions.
The total students strength in 1991-92 was how many times that of Commerce students in the same year ?A3 timesB4 timesC5 timesD6 timesShown below is the multiple bar diagram depicting the changes in the student's strength of a college in four faculties from 1990-91 to 1992-93.
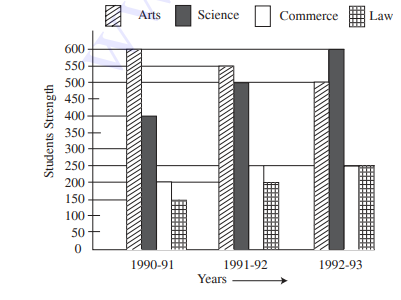
The percentage of students in law faculty in 1992-93 was-----A18.5%B15.6%C16.7%D14.8%
Given here is a multiple bar diagram depicting the changes in the students strength of a college in four faculties from 1990 - 91 to 1992 - 93. Study the diagram and answer the questions.
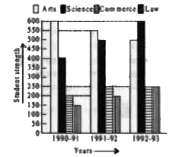
In which faculty was there a regular decease in students' strength?
View SolutionGlven here is a multiple bar diagram depicting the changes in the students strength of a college in four faculties from 1990-91 to 199293. Study the diagram and answer the questions.

In which faculty was there a regular decrease in students' strength?
View SolutionGlven here is a multiple bar diagram depicting the changes in the students strength of a college in four faculties from 1990-91 to 199293. Study the diagram and answer the questions.

The percentage of students in Science faculty in 1990-91 was
View SolutionGiven here is a multiple bar diagram depicting the changes in the students strength of a college in four faculties from 1990 - 91 to 1992 - 93. Study the diagram and answer the questions.

What was the percent increase in Science students from the year 1990 - 91 to 1992 - 93 ?
View SolutionGlven here is a multiple bar diagram depicting the changes in the students strength of a college in four faculties from 1990-91 to 199293. Study the diagram and answer the questions.
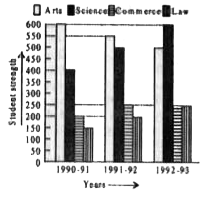
What was the percent in crease in Science students from the year 1990 - 91 to 1992-93 ?
View Solution
