Study the following graph and answer the questions given below -----
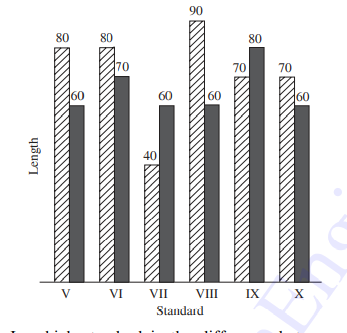
In which pair of standards are the results of girls and boys in inverse proportion ?
V and X
V and VI
VI and VIII
VI and IX
Step by step video, text & image solution for Study the following graph and answer the questions given below ----- In which pair of standards are the results of girls and boys in inverse proportion ? by Maths experts to help you in doubts & scoring excellent marks in Class 14 exams.
Updated on:21/07/2023Topper's Solved these Questions
Similar Questions
Read the following graph carefully and answer the questions given below:
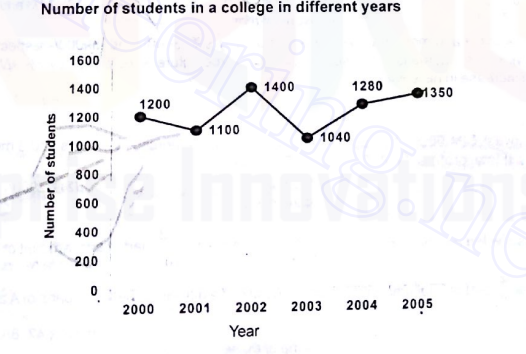
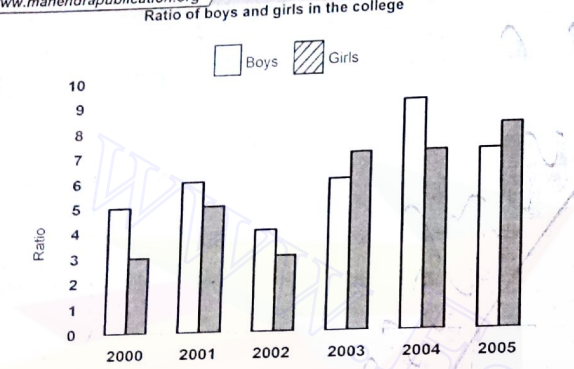
In which two years the number of girls is equal ?
View SolutionStudy the following graph and answer the questions given below it.
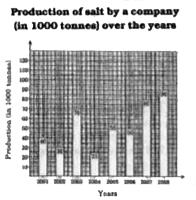
In how many of the given years was the production of salt more than the average production of the given years?
View Solution
Knowledge Check
Study the following graph and answer the questions given below -----
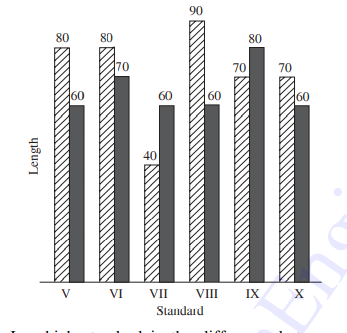
In which standard is the failure of girls lowest ?AXBVIICVIIIDVStudy the following graph and answer the questions given below -----
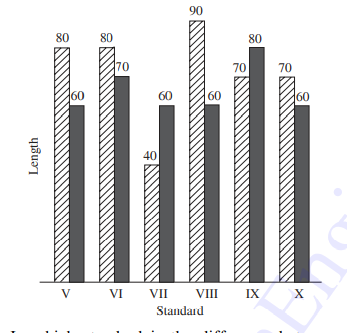
In which standard is the difference between the results of girls and boys maximum ?AVBVIICXDVIIIStudy the following bar graph and answer the question that follows.
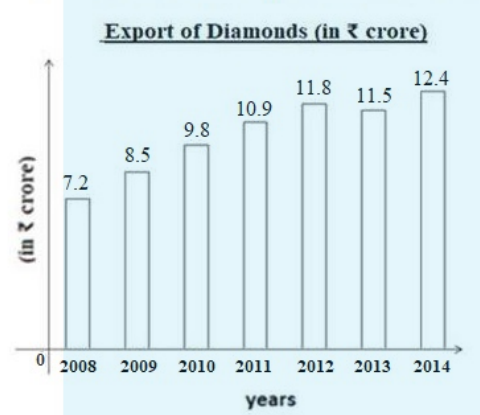
In which year was the maximin percentage increase in diamonds exports compared to the previous year?A2014B2009C2010D2012
Study the following graph and answer the questions given below -----
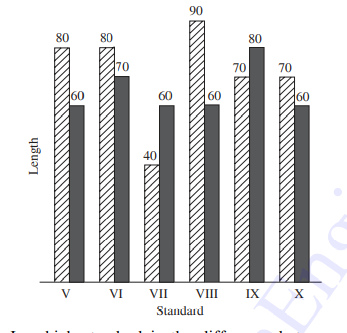
In which standard is the result of the girls more than the average result of the boys for the school ?
View SolutionStudy the following graph and answer the questions given below -----
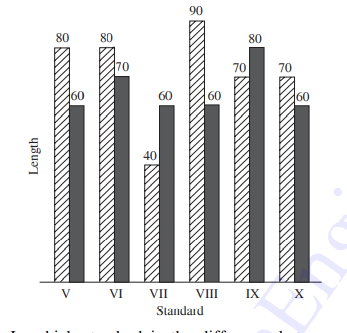
In which standard is the result of boys less than the average result of the girls ?
View SolutionStudy the following graph carefully and answer the questions given below it -----
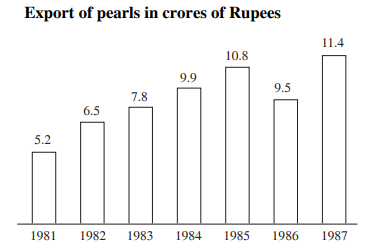
In which of the following pairs of years was the average export of pearls around 9 crores ?
View SolutionStudy the following graph carefully and answer the questions given below it -----
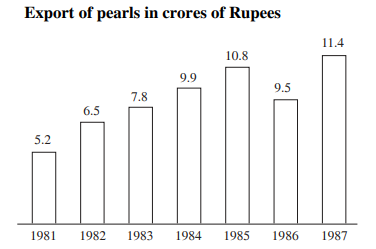
In which year was the export equal to the average export of the preceding and the following year ?
View SolutionStudy the following graph carefully and answer the questions given below –
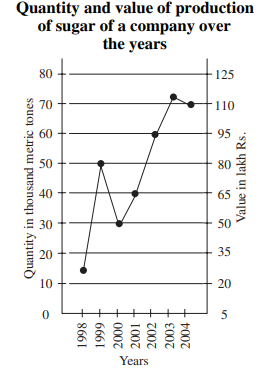
In which pair years the sum of production is exactly 25% of the production of all the years together?
1998 and 2004
1998 and 2003
1998 and 2001
View Solution
