Study the graph carefully and answer the questions below it -----
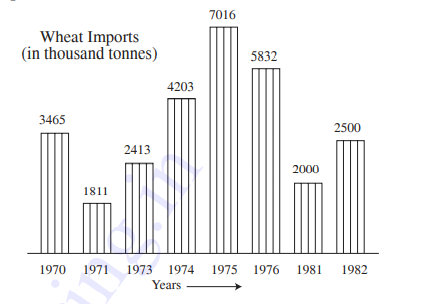
What is the ratio of the years which have above average imports to those which have below average imports ?
3 : 5
2 : 6
8 : 3
3 : 8
Step by step video, text & image solution for Study the graph carefully and answer the questions below it ----- What is the ratio of the years which have above average imports to those which have below average imports ? by Maths experts to help you in doubts & scoring excellent marks in Class 14 exams.
Updated on:21/07/2023Topper's Solved these Questions
Similar Questions
Study the graph carefully and answer the questions below it -----
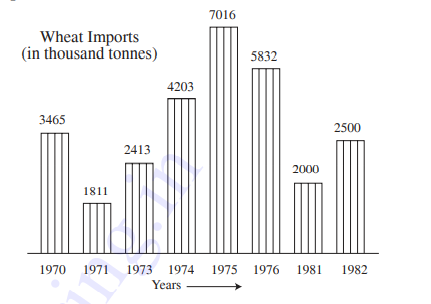
In which year did the imports register highest increase over its preceding year ?
View SolutionStudy the following graph carefully and answer the questions that follow
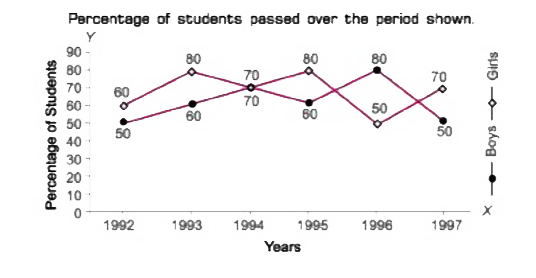
What is the ratio of the average of failed girls and that of failed boys ?
View Solution
Knowledge Check
Study the graph carefully and answer the questions below it -----
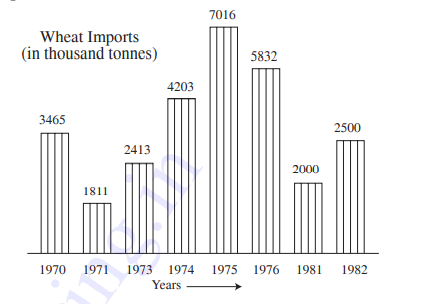
The imports in 1974 is approximately what percent of the average imports for the given years ?A125B115C190D85Study the graph carefully and answer the questions below it -----
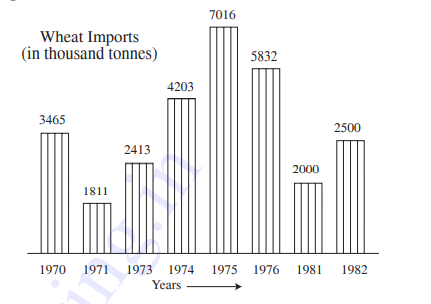
The increase in imports in 1982 was what percent of the imports in 1981 ?A25B5C125D80Study the following graph carefully and answer the questions given below it -----
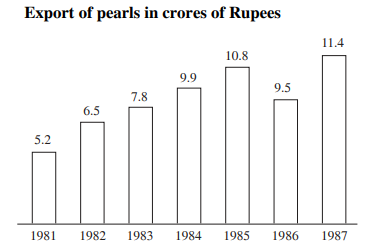
In how many years was the export above the average for the given period ?A2B3C4D5
Study the following graph carefully and answer the questions given below it -----
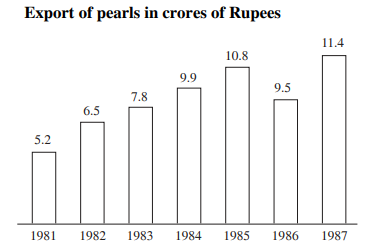
What was the percentage increase in export from 1986 to 1987 ?
View SolutionStudy the graph carefully and answer the questions below it -----
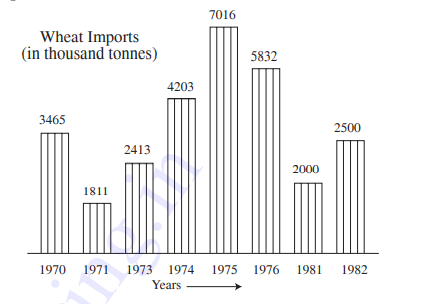
The imports in 1976 was approximately how many times that of the year 1971 ?
View SolutionStudy the following graph carefully and answer the questions given below it -----
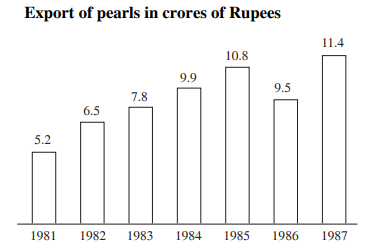
In which of the following pairs of years was the average export of pearls around 9 crores ?
View SolutionStudy the following graph carefully and answer the questions that
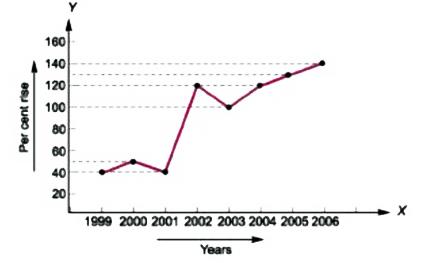
What was the average of percent rise over the given years ?
View SolutionStudy the following graph carefully and answer the questions -----
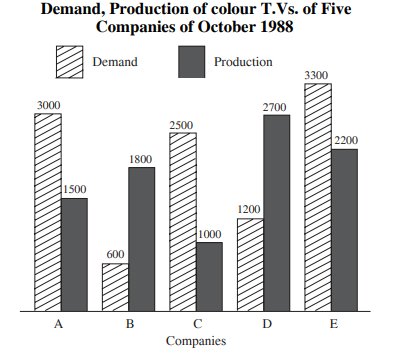
What is the ratio of companies having more demand than production to those having more production than demand ?
View Solution
