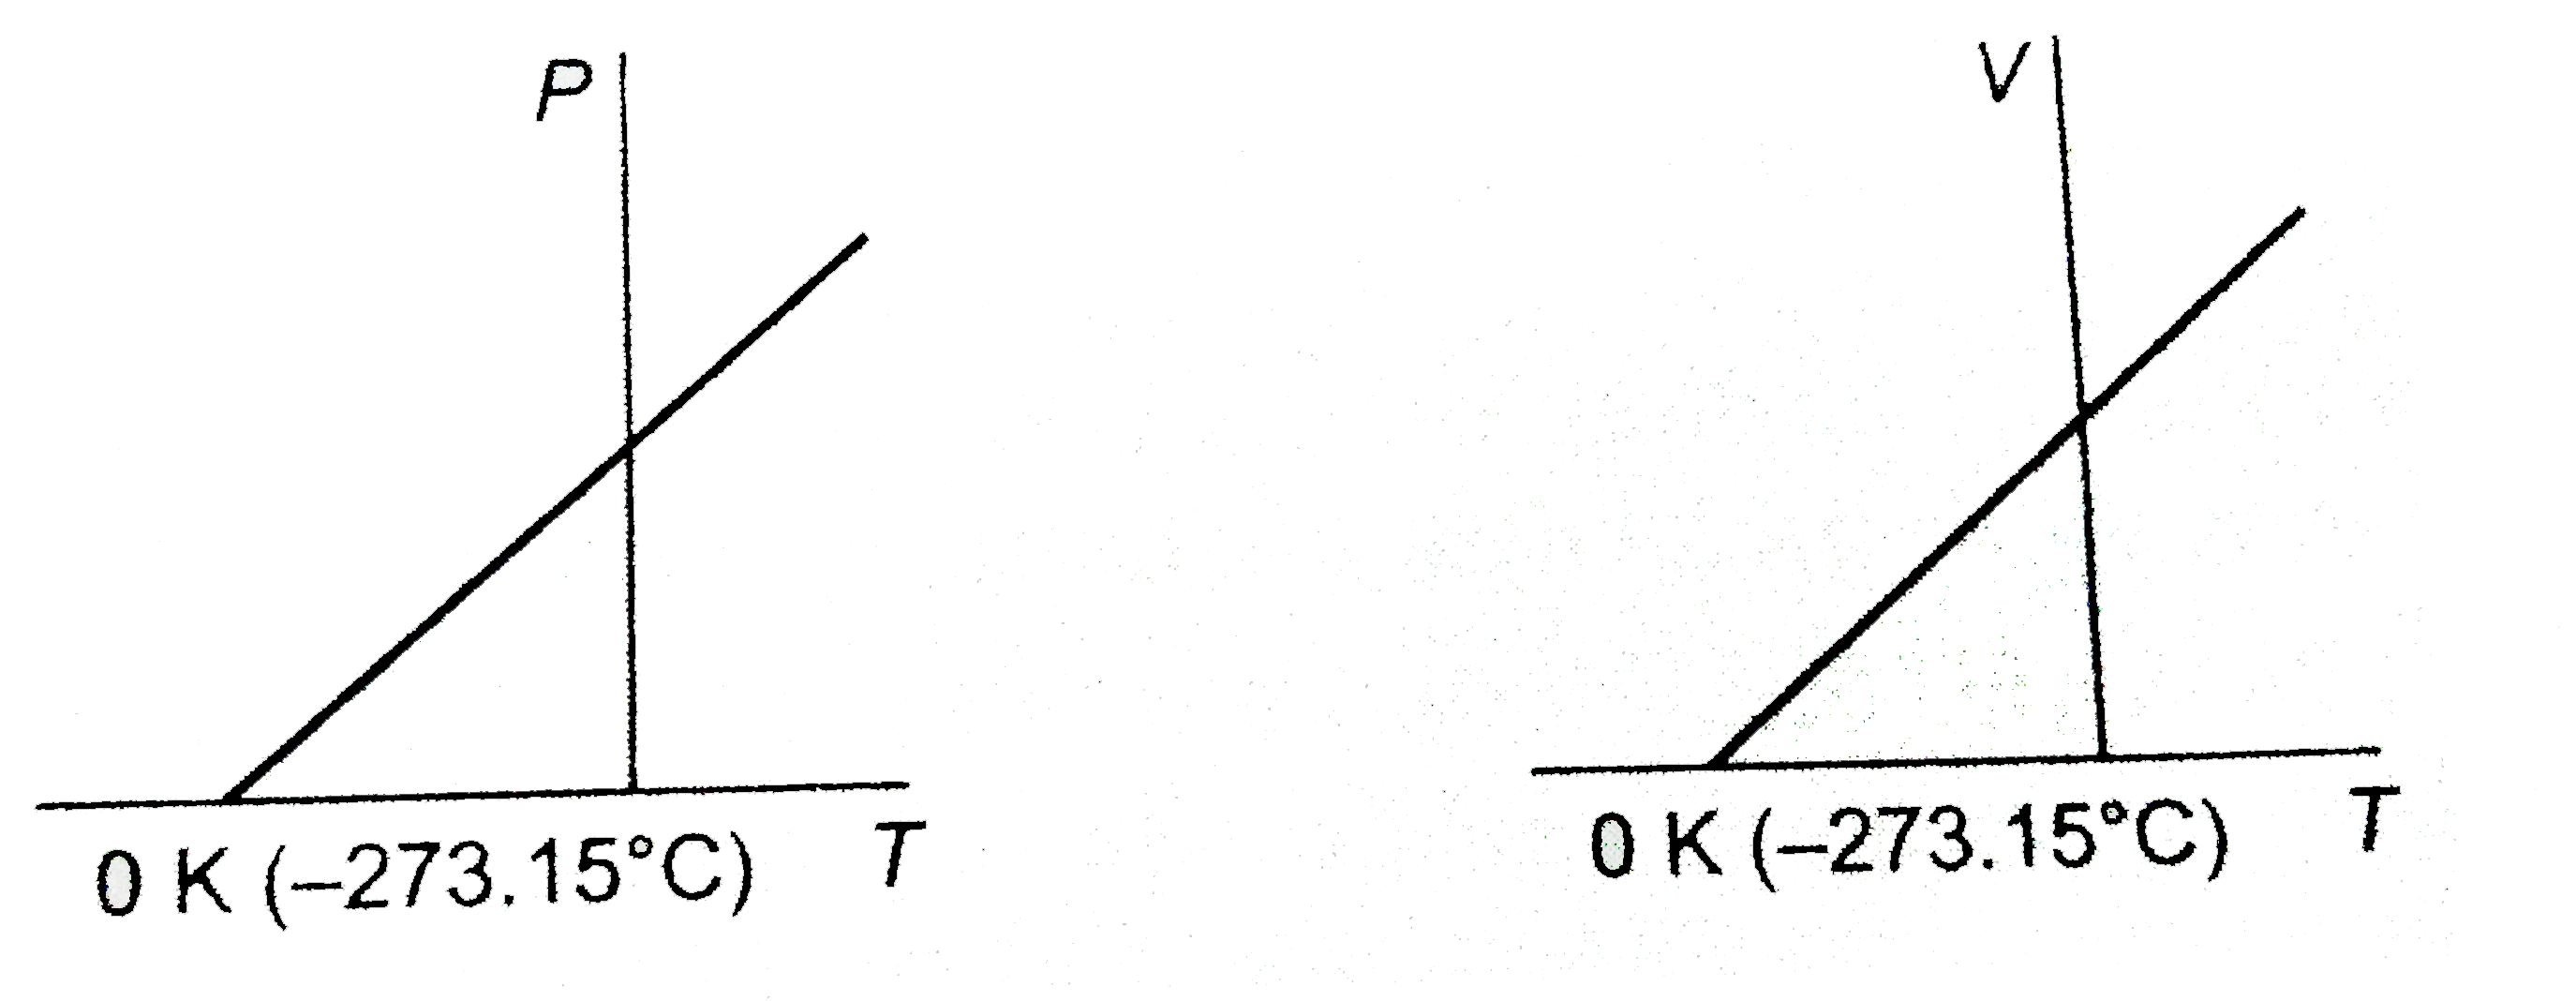
What conclusion would you draw from the following graphs for an ideal gas?
 Solution in Telugu
As the temperature is reduced, the volume as well as the pressure increase
As the temperature is reduced, the volumebecomes zero and the pressure reaches infinity
As the temperature is reduced, the pressure decrease
A point is reached where, theoretically, the volume become zero
The correct Answer is:c,d
(c,d)
at constant volumeat constant PP∝TV∝TP=KTV=KTP=K(t∘C+273.15)V=K(t∘C+273.15)
Topper's Solved these Questions
- GASEOUS STATEBOOK - NARENDRA AWASTHICHAPTER - GASEOUS STATEEXERCISE - Level 1 (Q.31 To Q.60)
1 Videos
- GASEOUS STATEBOOK - NARENDRA AWASTHICHAPTER - GASEOUS STATEEXERCISE - Level 1 (Q.121 To Q.150)
1 Videos
- ELECTROCHEMISTRYBOOK - NARENDRA AWASTHICHAPTER - ELECTROCHEMISTRYEXERCISE - Level 3 - Subjective Problems
1 Videos
- IONIC EEQUILIBRIUMBOOK - NARENDRA AWASTHICHAPTER - IONIC EEQUILIBRIUMEXERCISE - Assertin-Reason Type Questions
1 Videos
Similar Questions
Nitrogen forms several gaseous oxides. One of them has a density of 1.33 g/L measured 764 mmHg and 150∘C. Write the formula of the compound.
View SolutionDimethyl ether decomposes as
CH3OCH3(g)→CH4(g)+CO(g)+H2(g)
When CH3OCH3(g) decomposes to 20% extent under certain conditions, what is the ratio of diffusion of pure CH3OCH3(g) with methane?
View SolutionA solution containing 1MXSO4(aq) and 1MYSO4(aq) is electrolysed. If conc. Of X2+ is 10−zM when deposition Y2+ and X2+ starts simultaneously, calculate the value of Z.
Given: 2.303RTF=0.06
E∘x2+|X=−0.12V,E∘Y2+|Y=−0.24V
View SolutionSTATEMENT-1: All strong monoprotic acid with same concentration in dilute solution show same pH.
STATEMENT-2: Water shows levelling effect.
View SolutionA graph plotted between log t50% vs log concentration is a straight line. What conclusion can you draw from this graph?
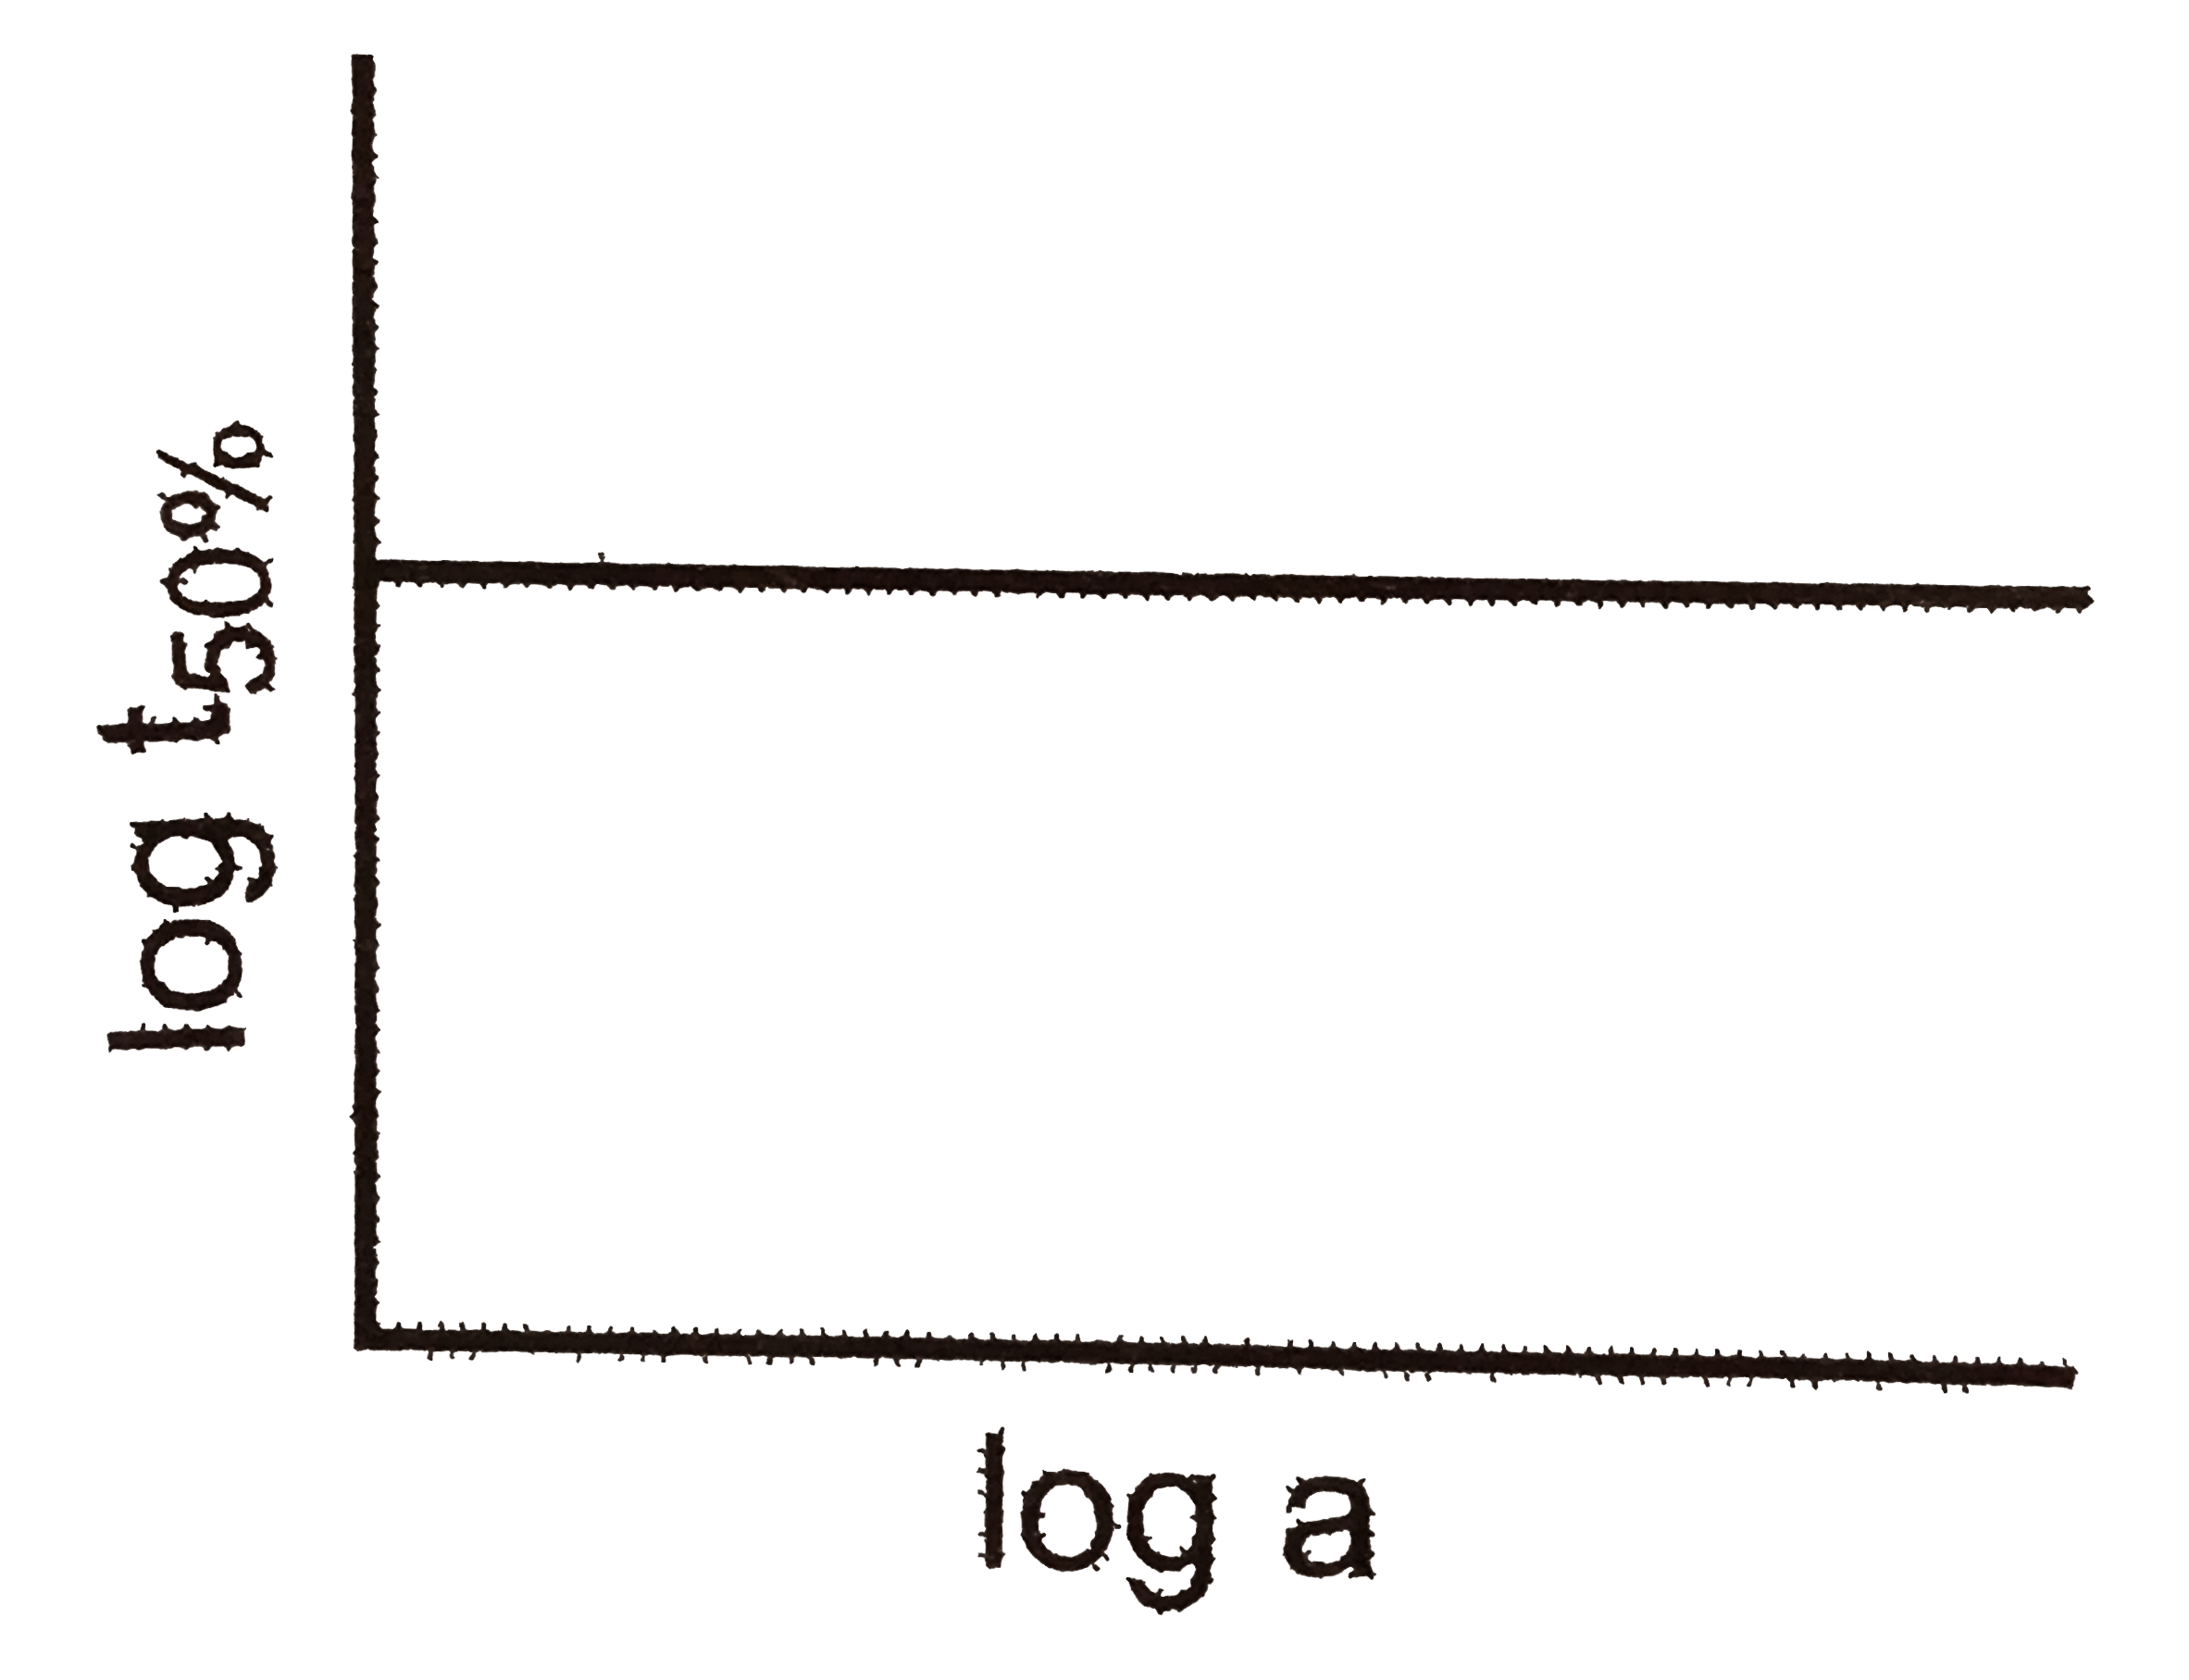
View SolutionA graph plotted between log t50% vs log concentration is a straight line. What conclusion can you draw from this graph?

View SolutionWhat conclusion would you draw from the following graphs for an ideal gas?
View SolutionA graph plotted between log t_(50%) vs log concentration in a straight line. What conclusion can you draw from this graph?
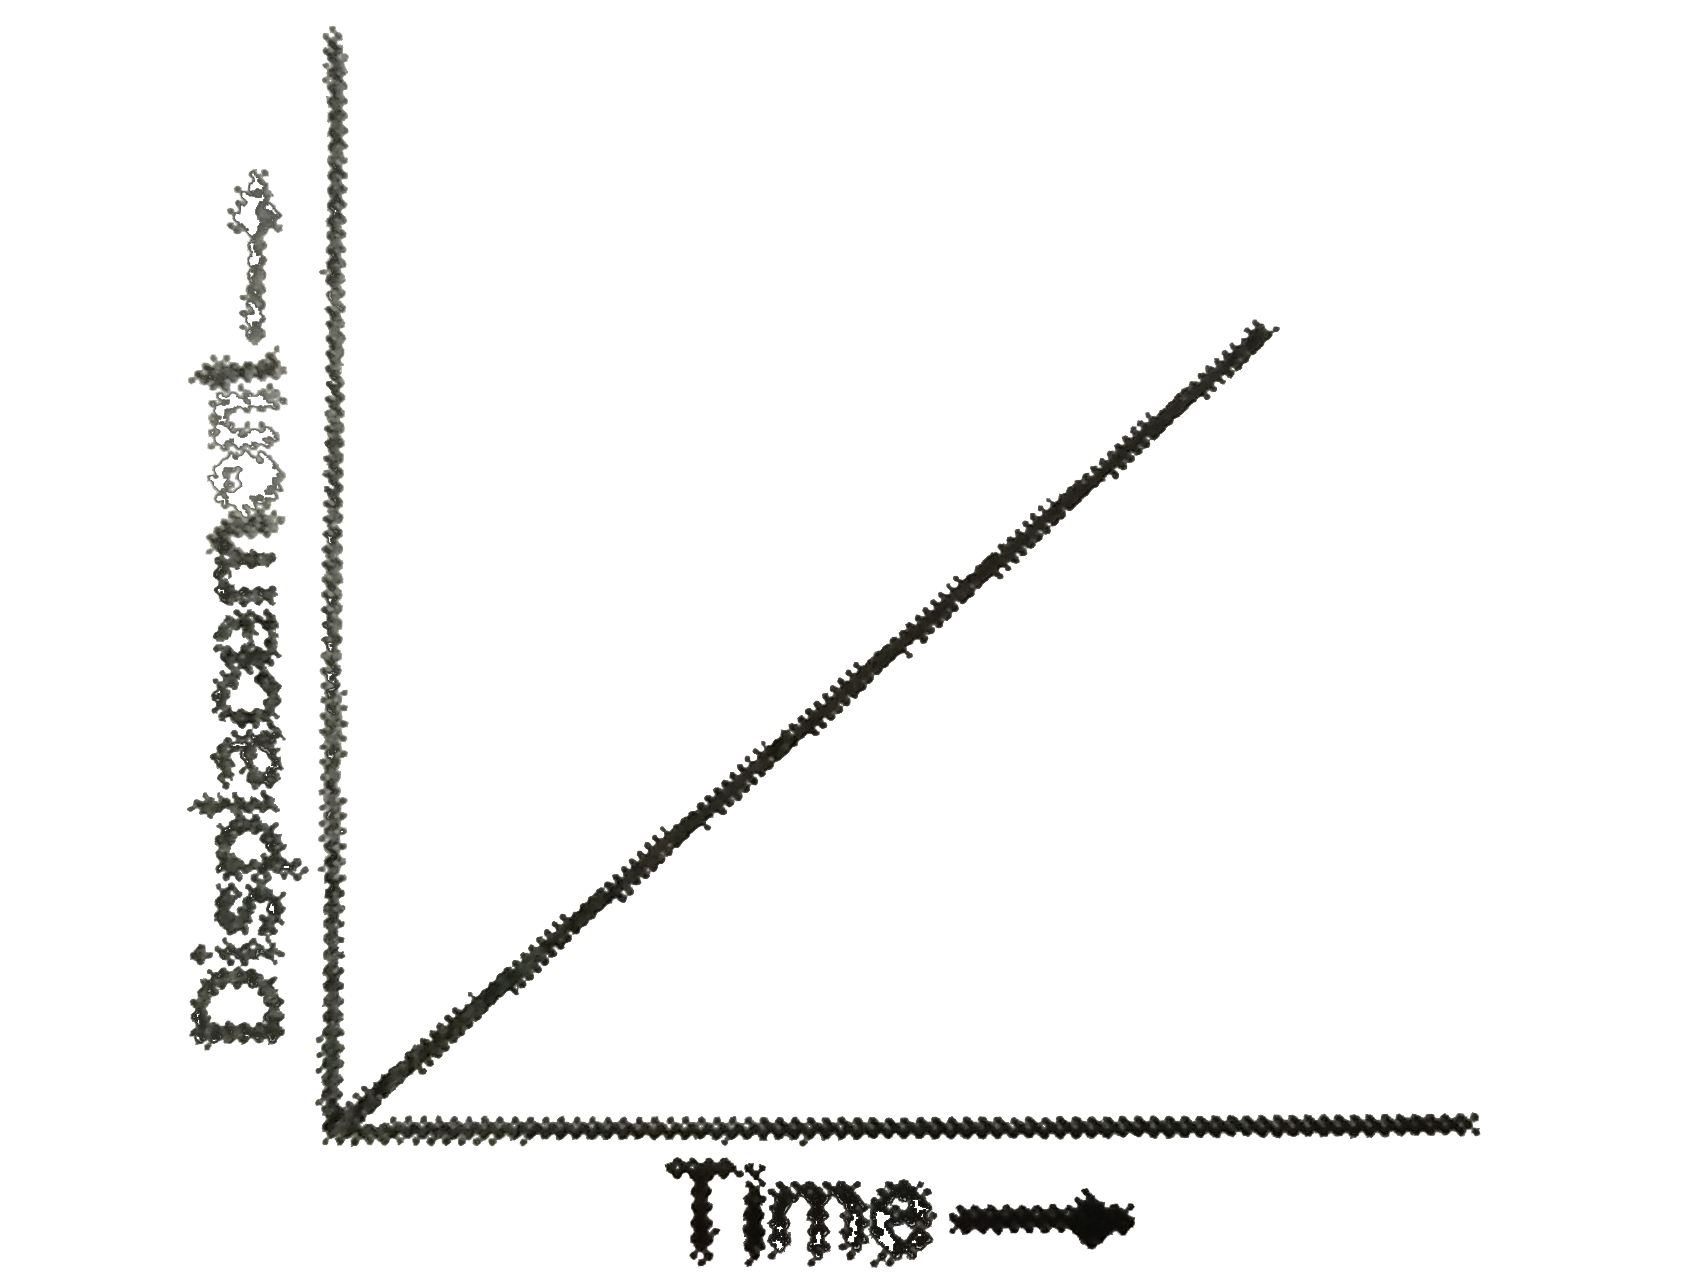
View SolutionWhat conclusion can you draw about the velocity of a body from the displacement-time graph shown below :
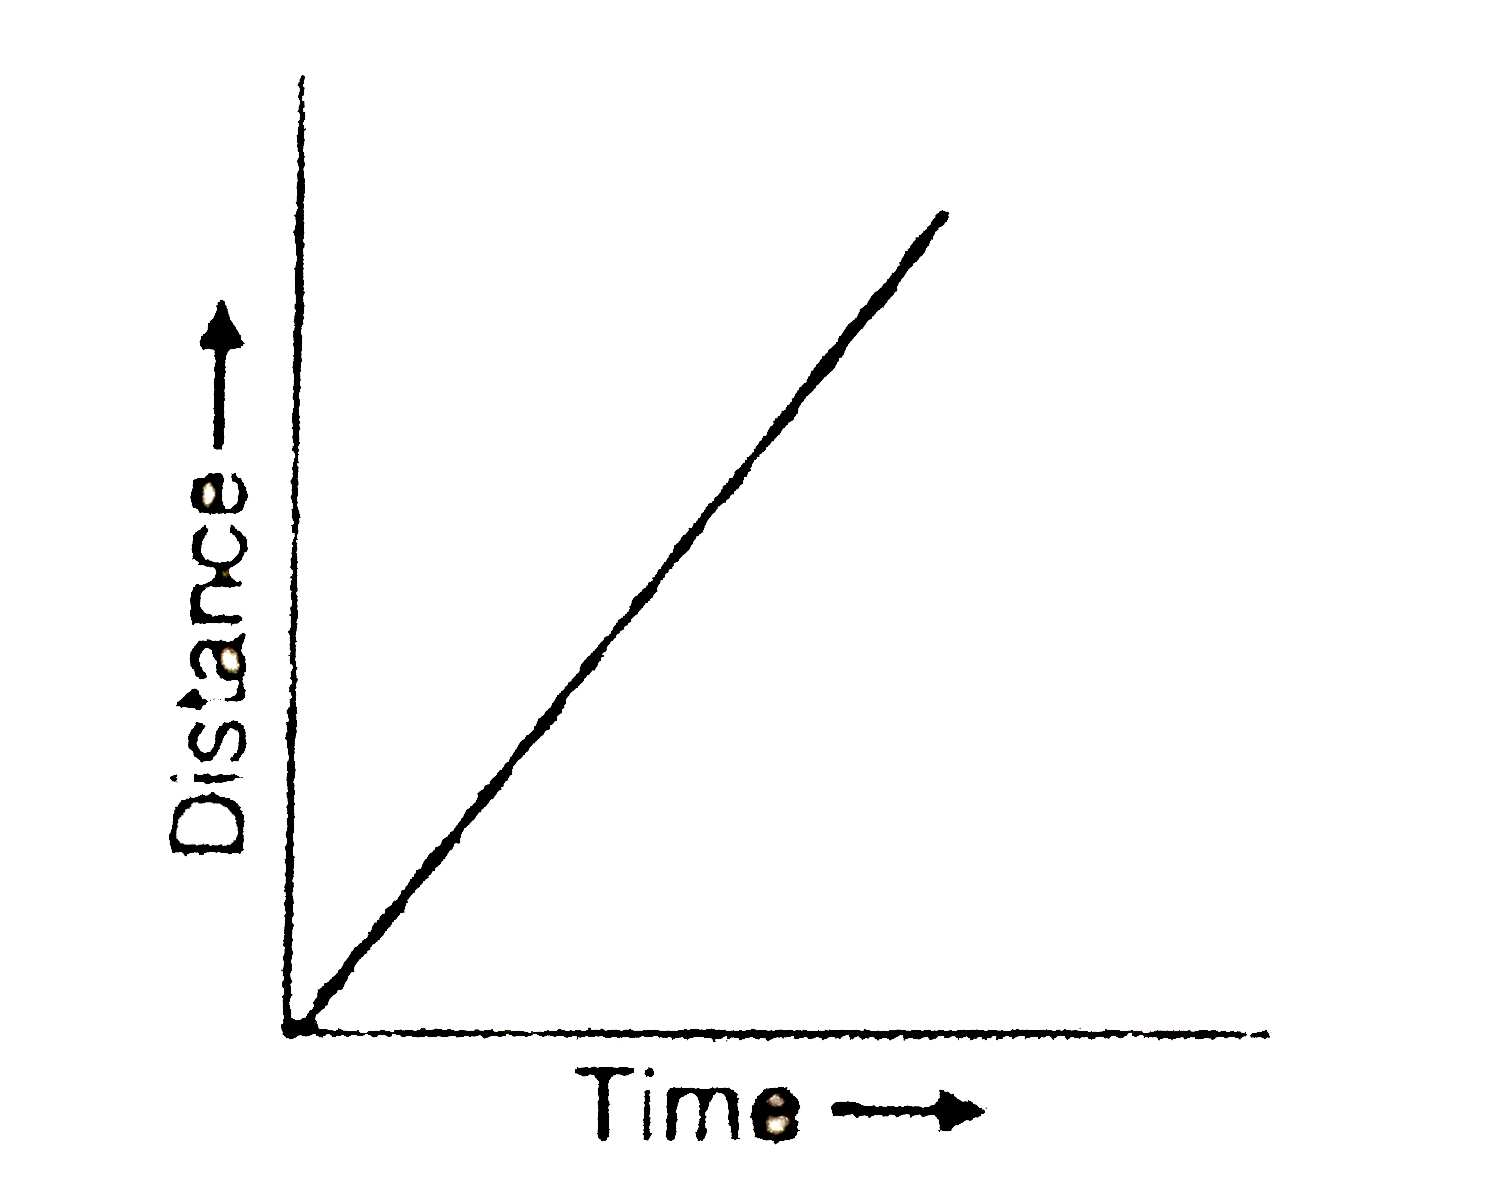
View SolutionWhat conclusion can you draw about the speed of a body from the following distance-time graph ?
View SolutionWhat conclusion can you draw about the acceleration of a body from the speed-time graph shown below ?
View Solutionनाभिक की बंधन ऊर्जा से आप क्या समझते हैं? नाभिकों की प्रति न्यूक्लिऑन बंधन ऊर्जा तथा द्रव्यमान संख्या की बीच ग्राफ खींचिए। इस ग्राफ को क्या कहते हैं इस ग्राफ से प्राप्त महत्वपूर्ण निष्कर्षों को लिखिए।
View SolutionWhat conclusion can you draw about the acceleration of a body from the speed-time graph shown below ?
View SolutionDraw z vs PO graph for an ideal gas, and CO_(2) gas
View SolutionYou are given two graphs. What conclusion do you draw from the graphs?
View SolutionDraw two graphs showing the ideal gas equation.
View Solution
