What conclusion would you draw from the following graphs for an ideal gas?
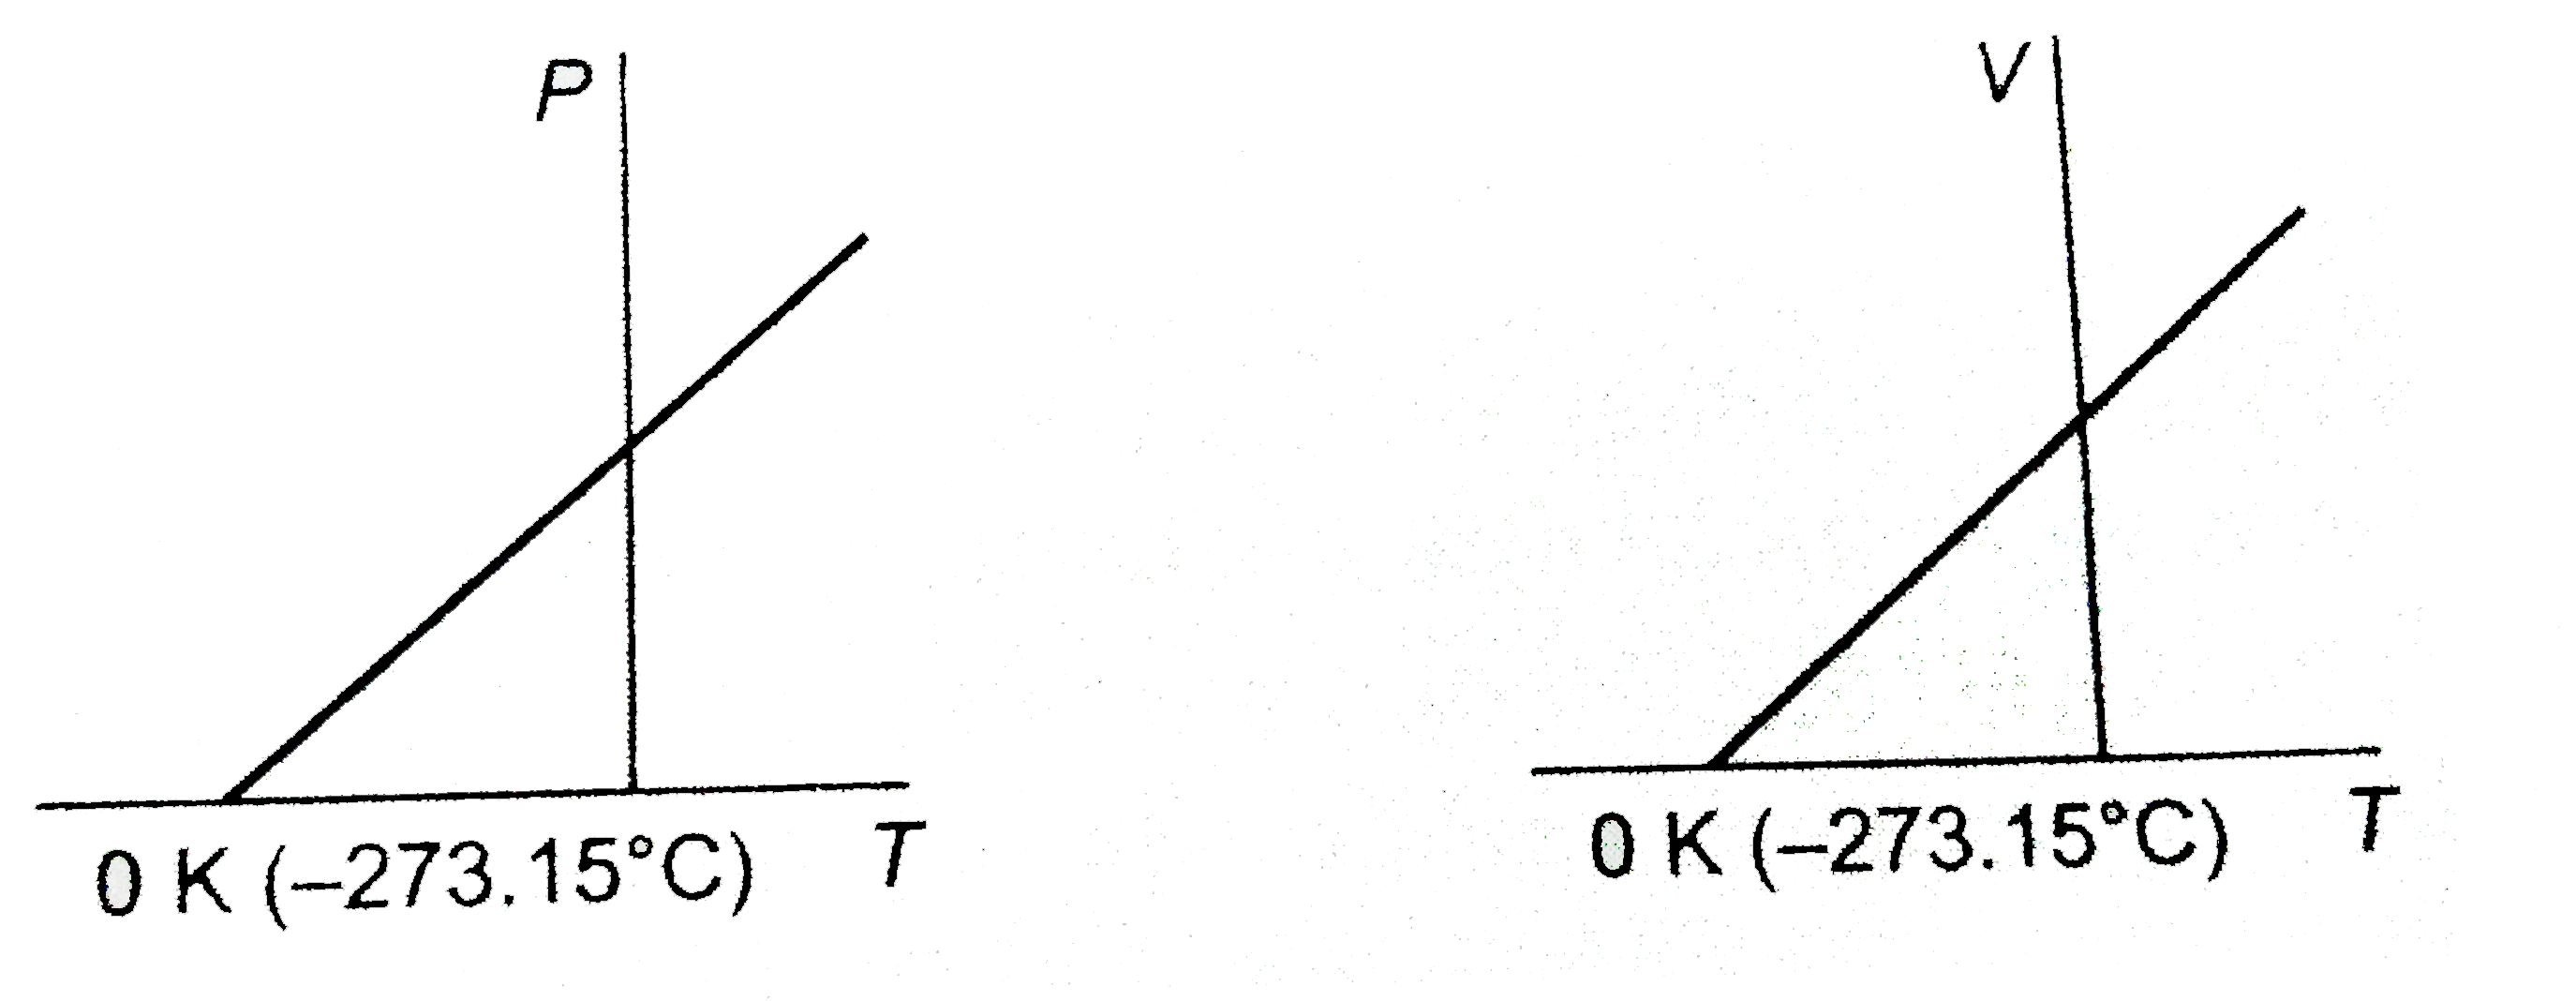
As the temperature is reduced, the volume as well as the pressure increase
As the temperature is reduced, the volumebecomes zero and the pressure reaches infinity
As the temperature is reduced, the pressure decrease
A point is reached where, theoretically, the volume become zero
The correct Answer is:c,d
(c,d)
at constant volumeat constant PP∝TV∝TP=KTV=KTP=K(t∘C+273.15)V=K(t∘C+273.15)
Topper's Solved these Questions
- GASEOUS STATEBOOK - NARENDRA AWASTHICHAPTER - GASEOUS STATEEXERCISE - Level 1 (Q.31 To Q.60)
1 Videos
- GASEOUS STATEBOOK - NARENDRA AWASTHICHAPTER - GASEOUS STATEEXERCISE - Level 1 (Q.121 To Q.150)
1 Videos
- ELECTROCHEMISTRYBOOK - NARENDRA AWASTHICHAPTER - ELECTROCHEMISTRYEXERCISE - Level 3 - Subjective Problems
1 Videos
- IONIC EEQUILIBRIUMBOOK - NARENDRA AWASTHICHAPTER - IONIC EEQUILIBRIUMEXERCISE - Exercise
196 Videos
Similar Questions
Knowledge Check
Which of the following graphs is consistent with ideal gas behaviour?
A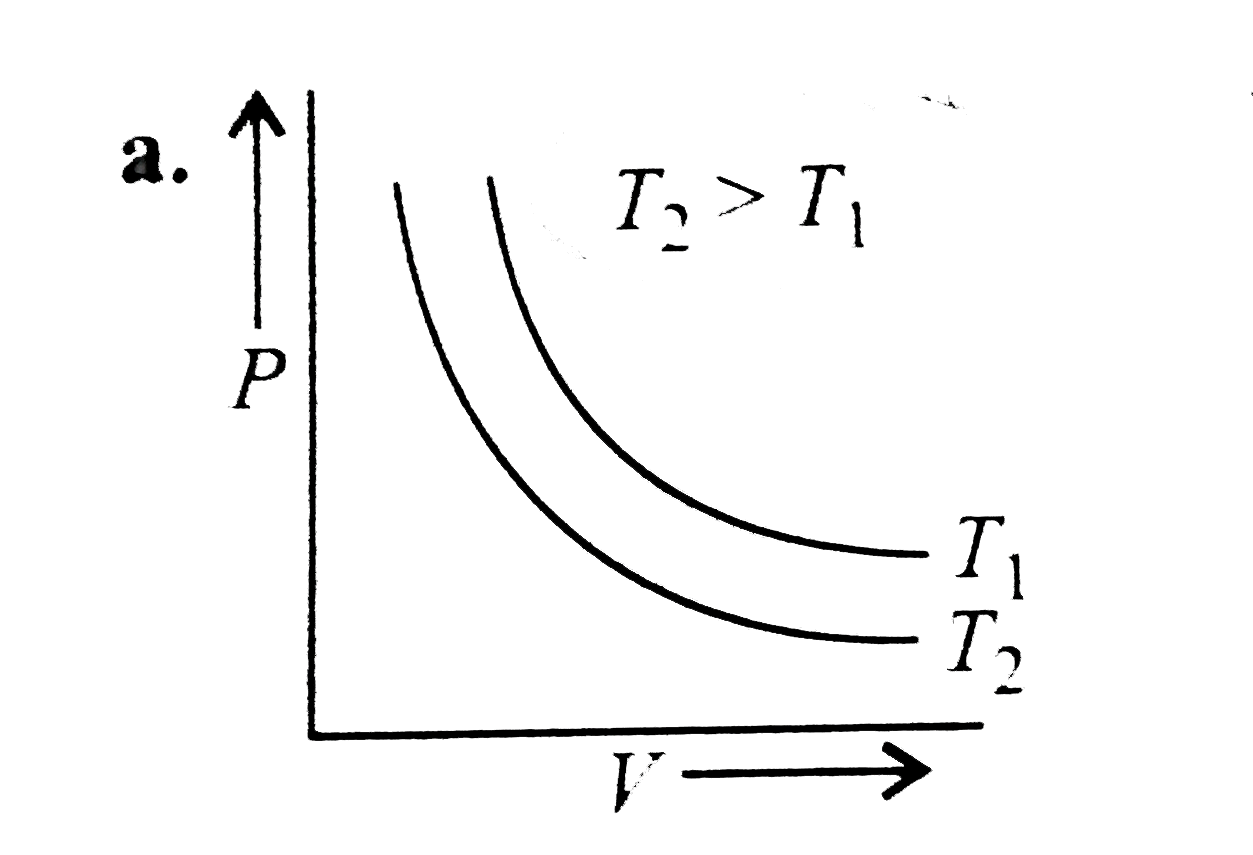 B
B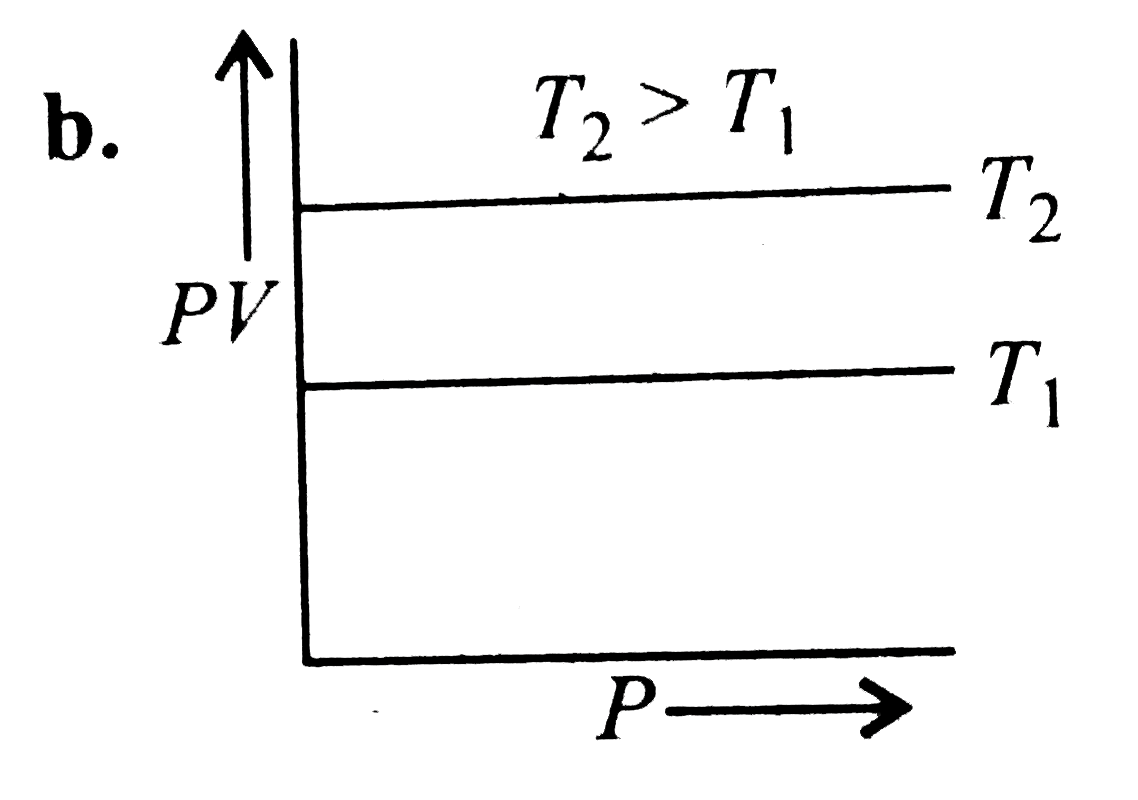 C
C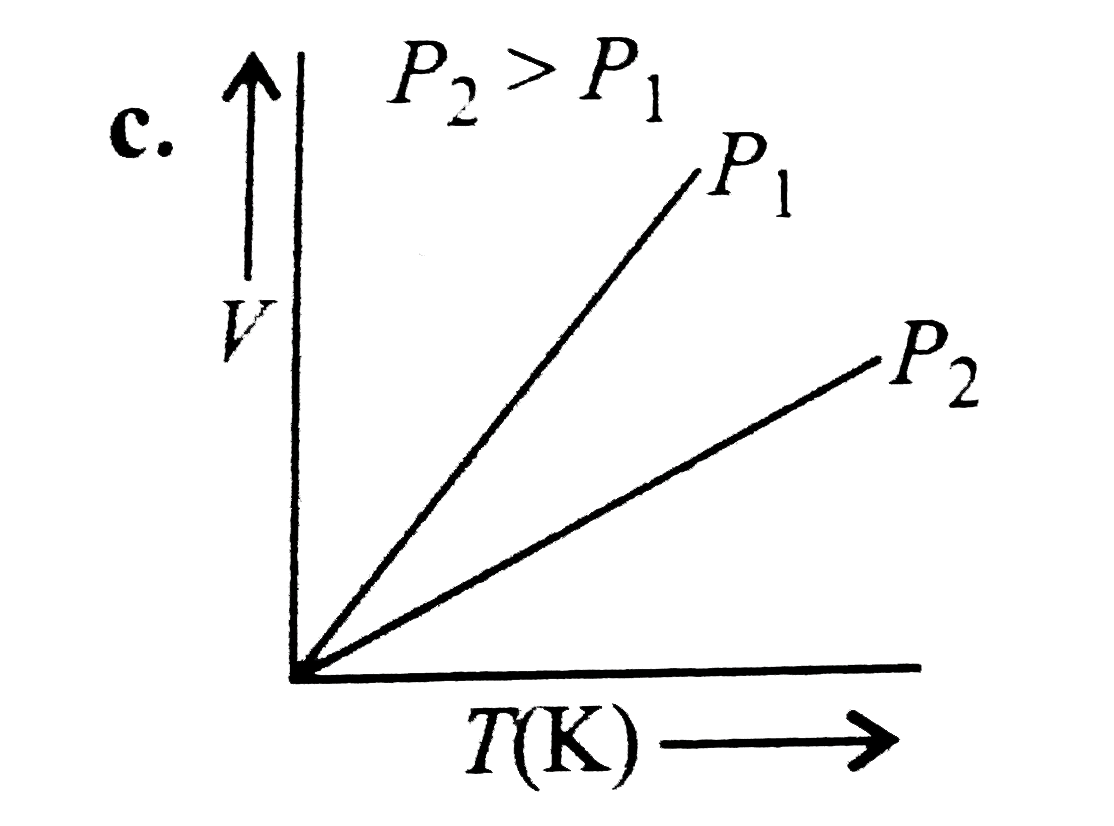 D
D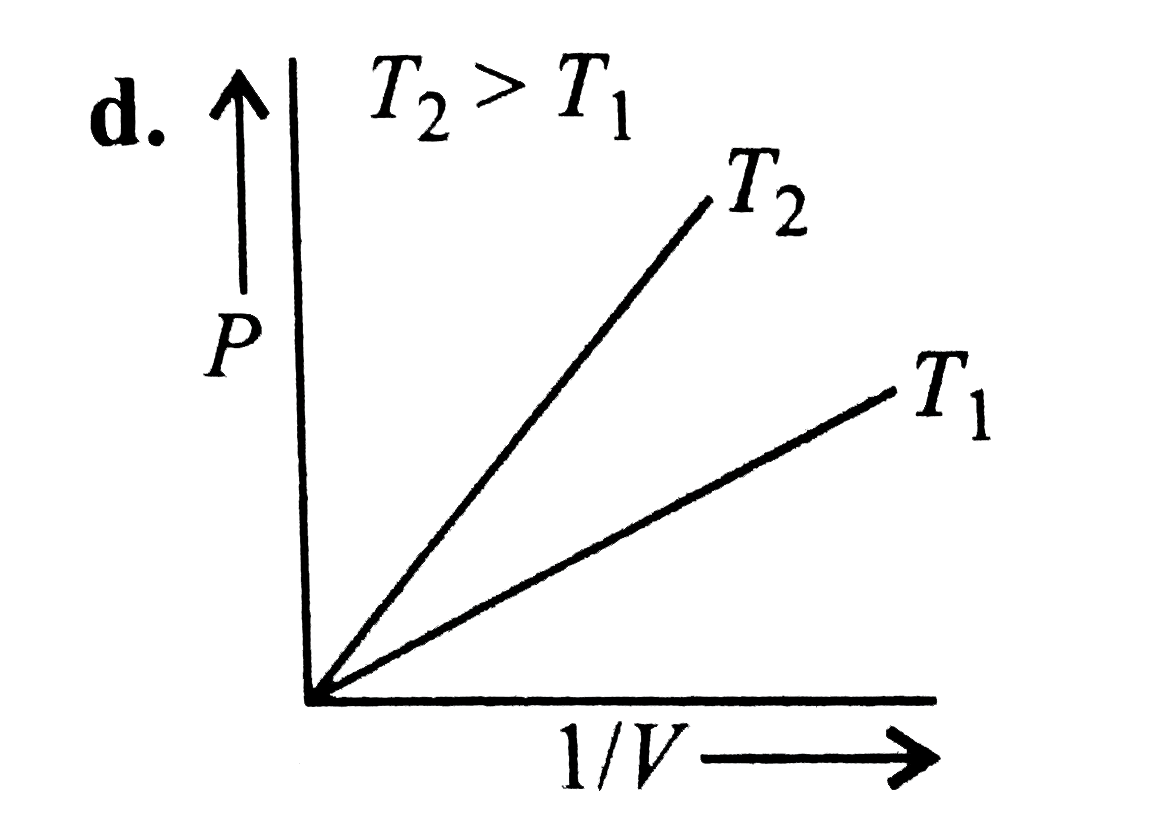
Which one of the following graphs correctly gives the ideal gas behaviour ?
A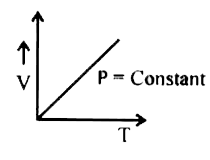 B
B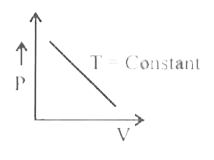 C
C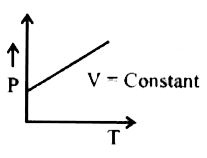 D
D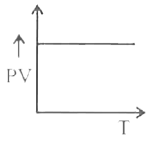
Which curve in the following graph represents the curve of ideal gas ?
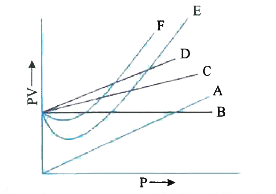 AB onlyBC and D onlyCE and F onlyDA and B only
What conclusions would you draw if the Lassaigne's extract gives a blood red colouration with FeCI3 ?
View SolutionWhat product(s) would you expect from the following solvolysis ?

View SolutionWhat conclusion do you draw when displacement-time graph of a body is as shwon in Figure ?
View SolutionWhat conclusion would you draw if during Lassaigne's test, a blood red colouration is obtained ?
View SolutionCO2 is non - polar while H2O is polar. What conclusion do you draw about their structures from these?
View Solution


