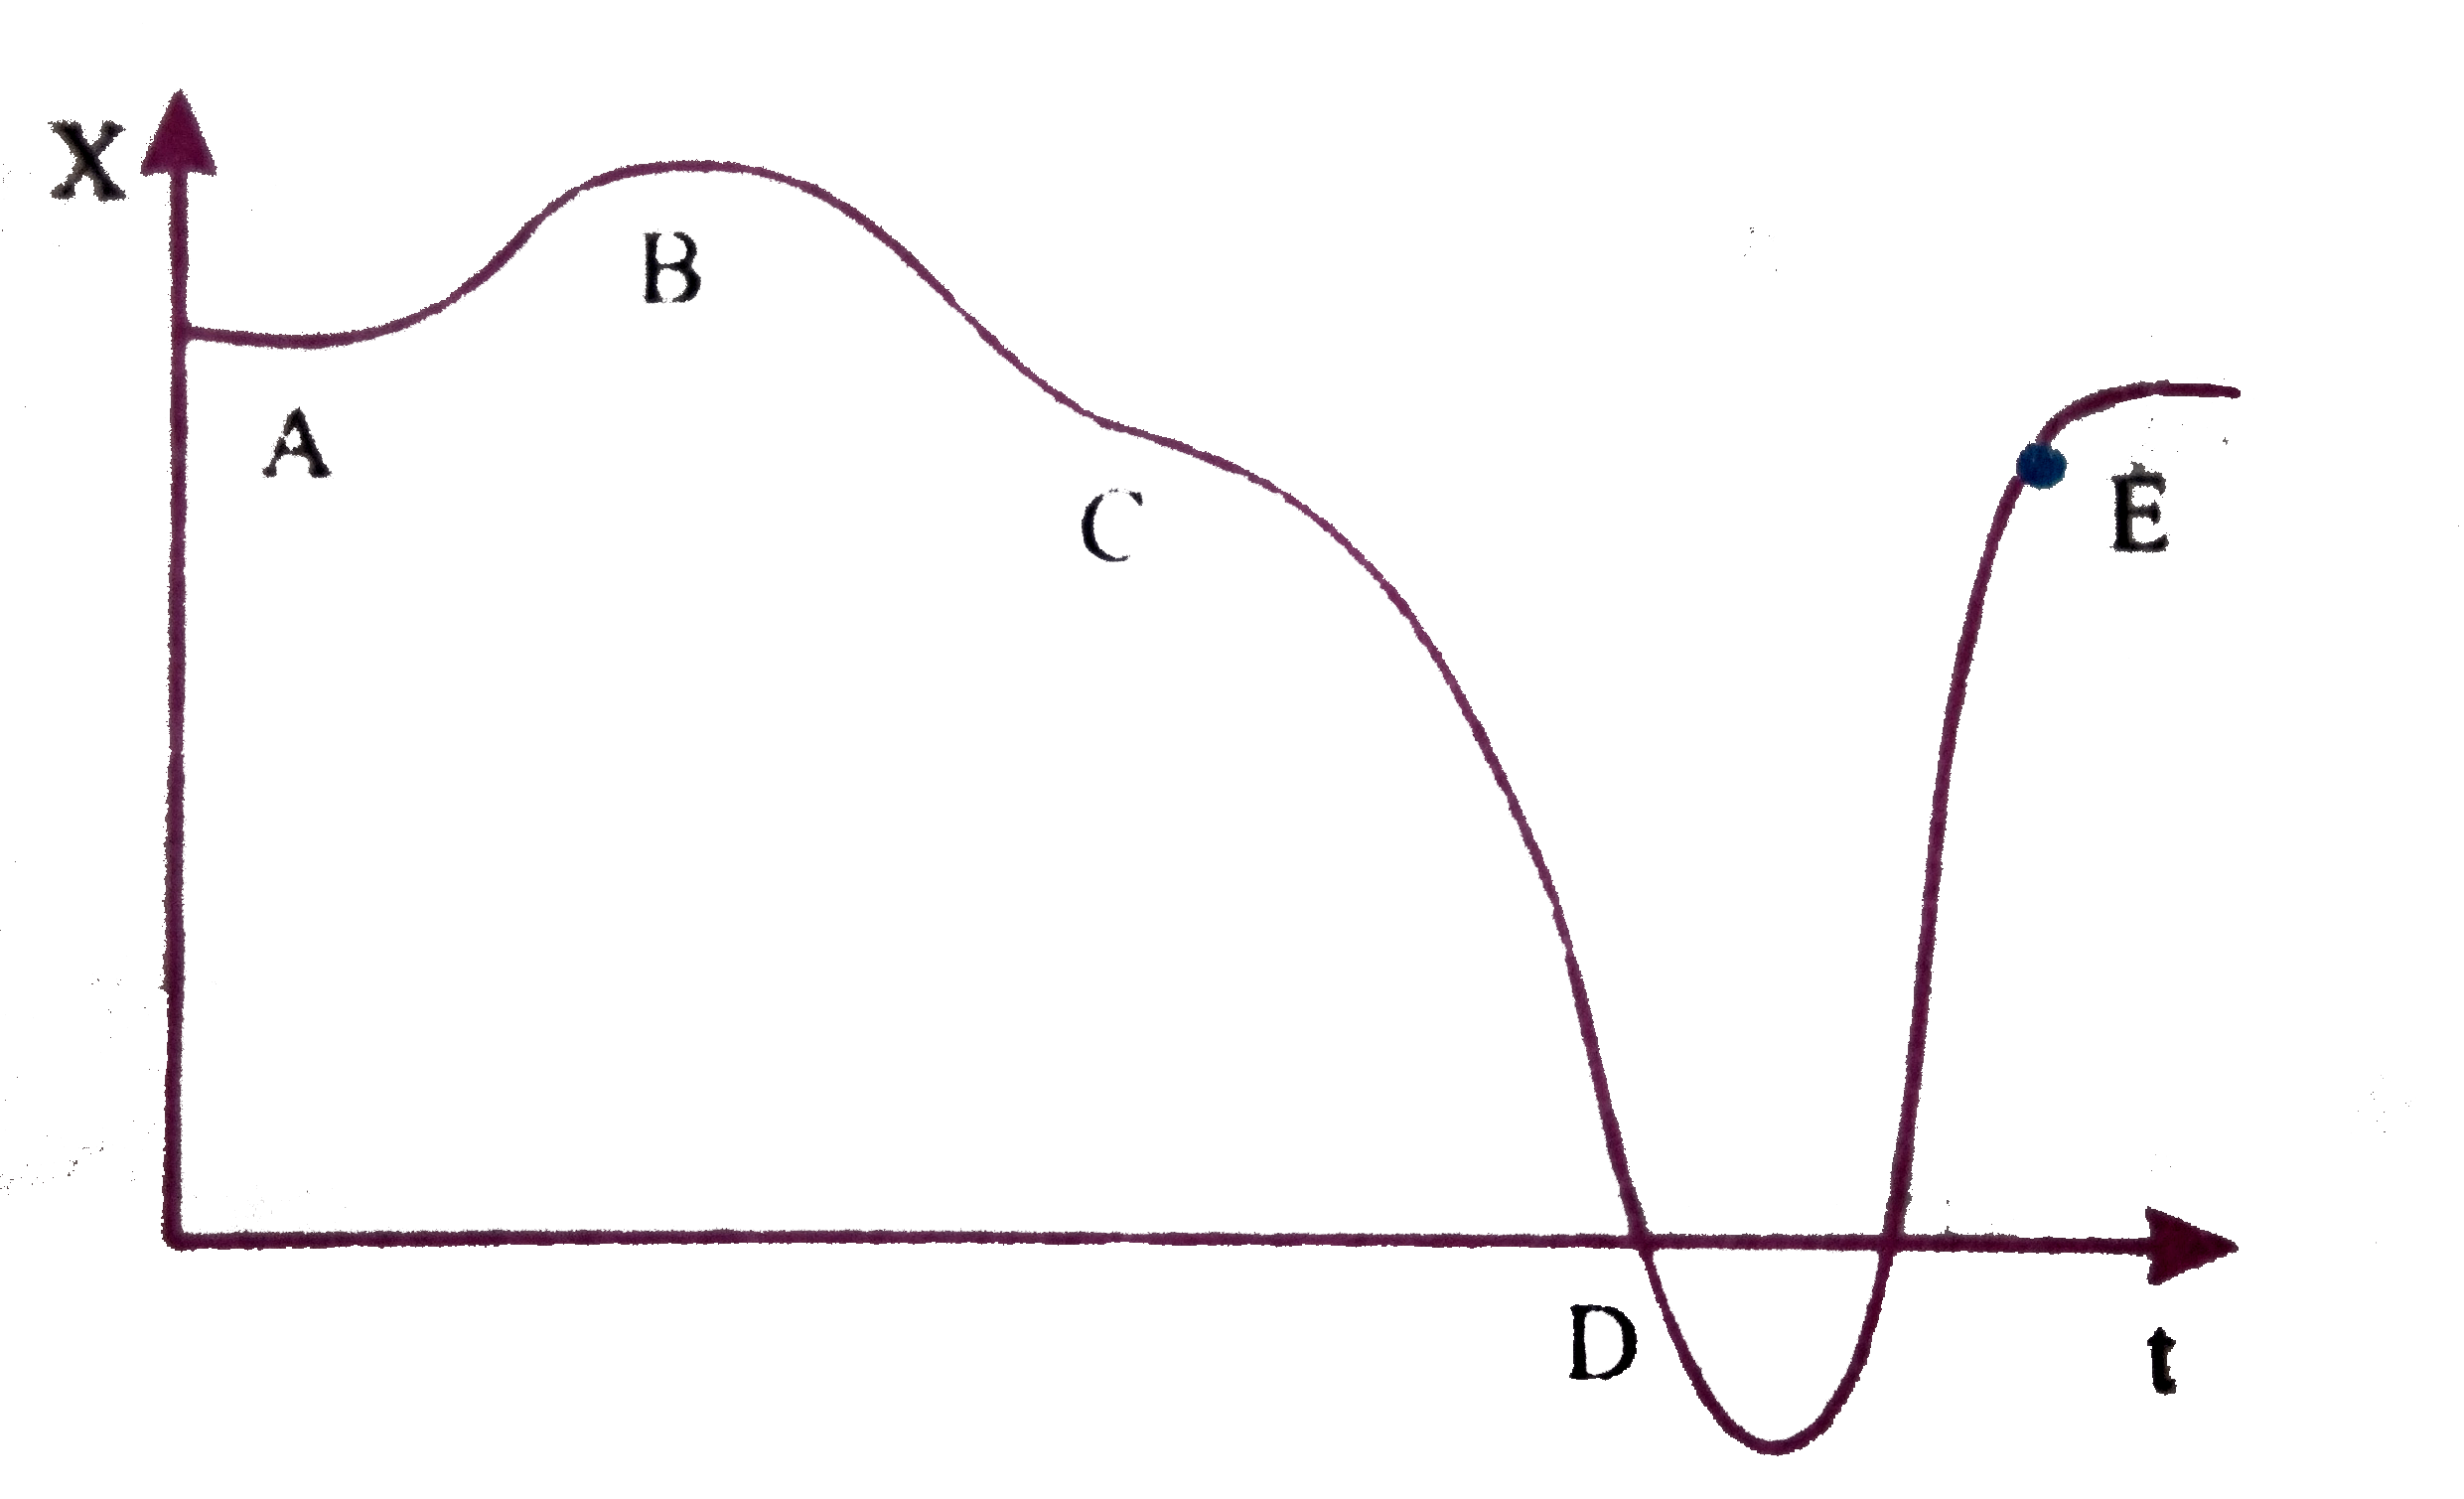
The figure below shows four graphs of x versus time,which graph shows a constant,positive ,non-zero velocity?

Video Solution
|
Answer
Step by step video solution for The figure below shows four graphs of x versus time,which graph shows a constant,positive ,non-zero velocity? by Physics experts to help you in doubts & scoring excellent marks in Class 11 exams.
Updated on:21/07/2023Similar Questions
Knowledge Check
The figure above shows the graph of 5x . What is the sum of the areas of the rectangle ?
A32550B16225C2604D651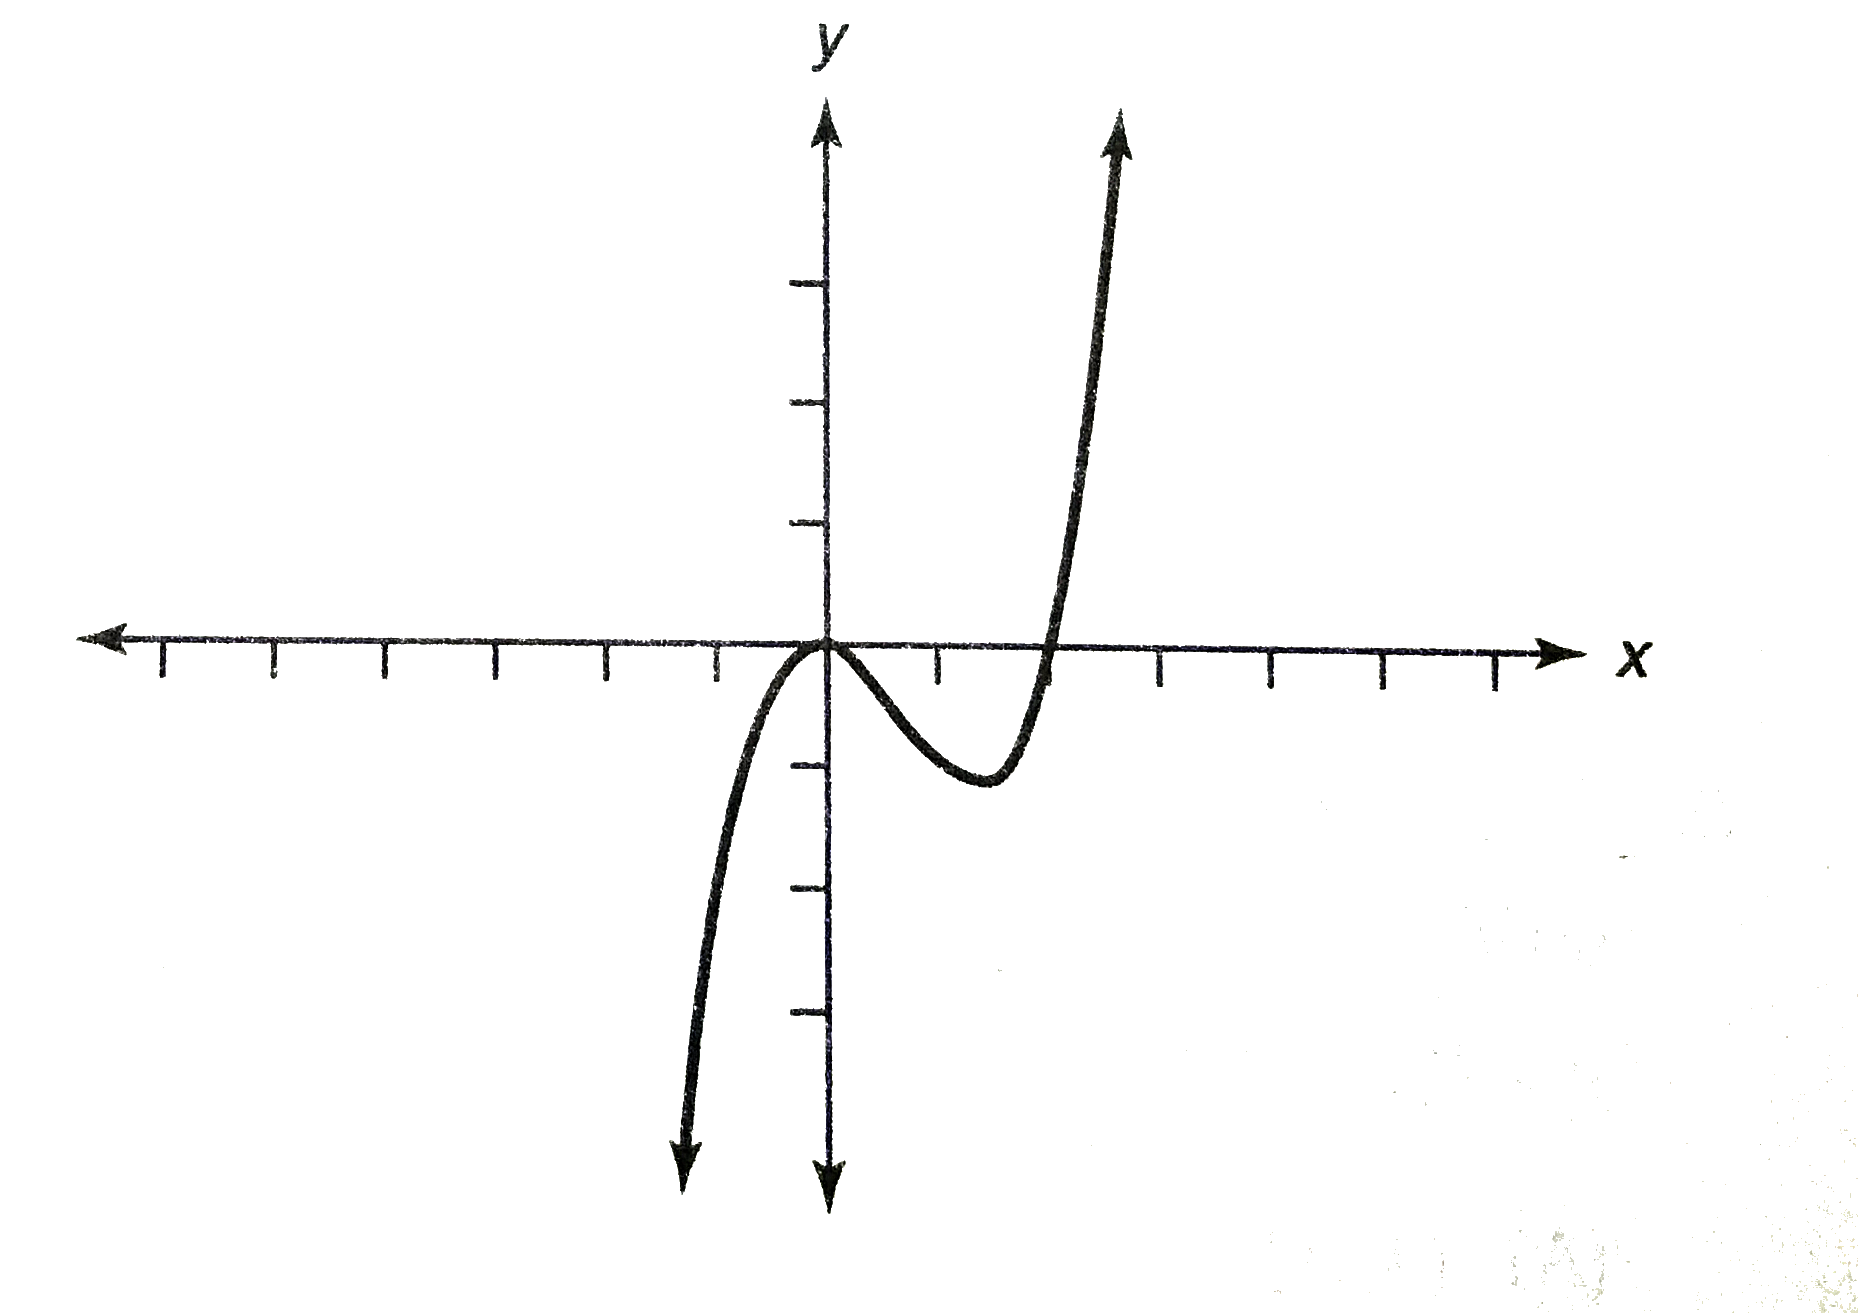
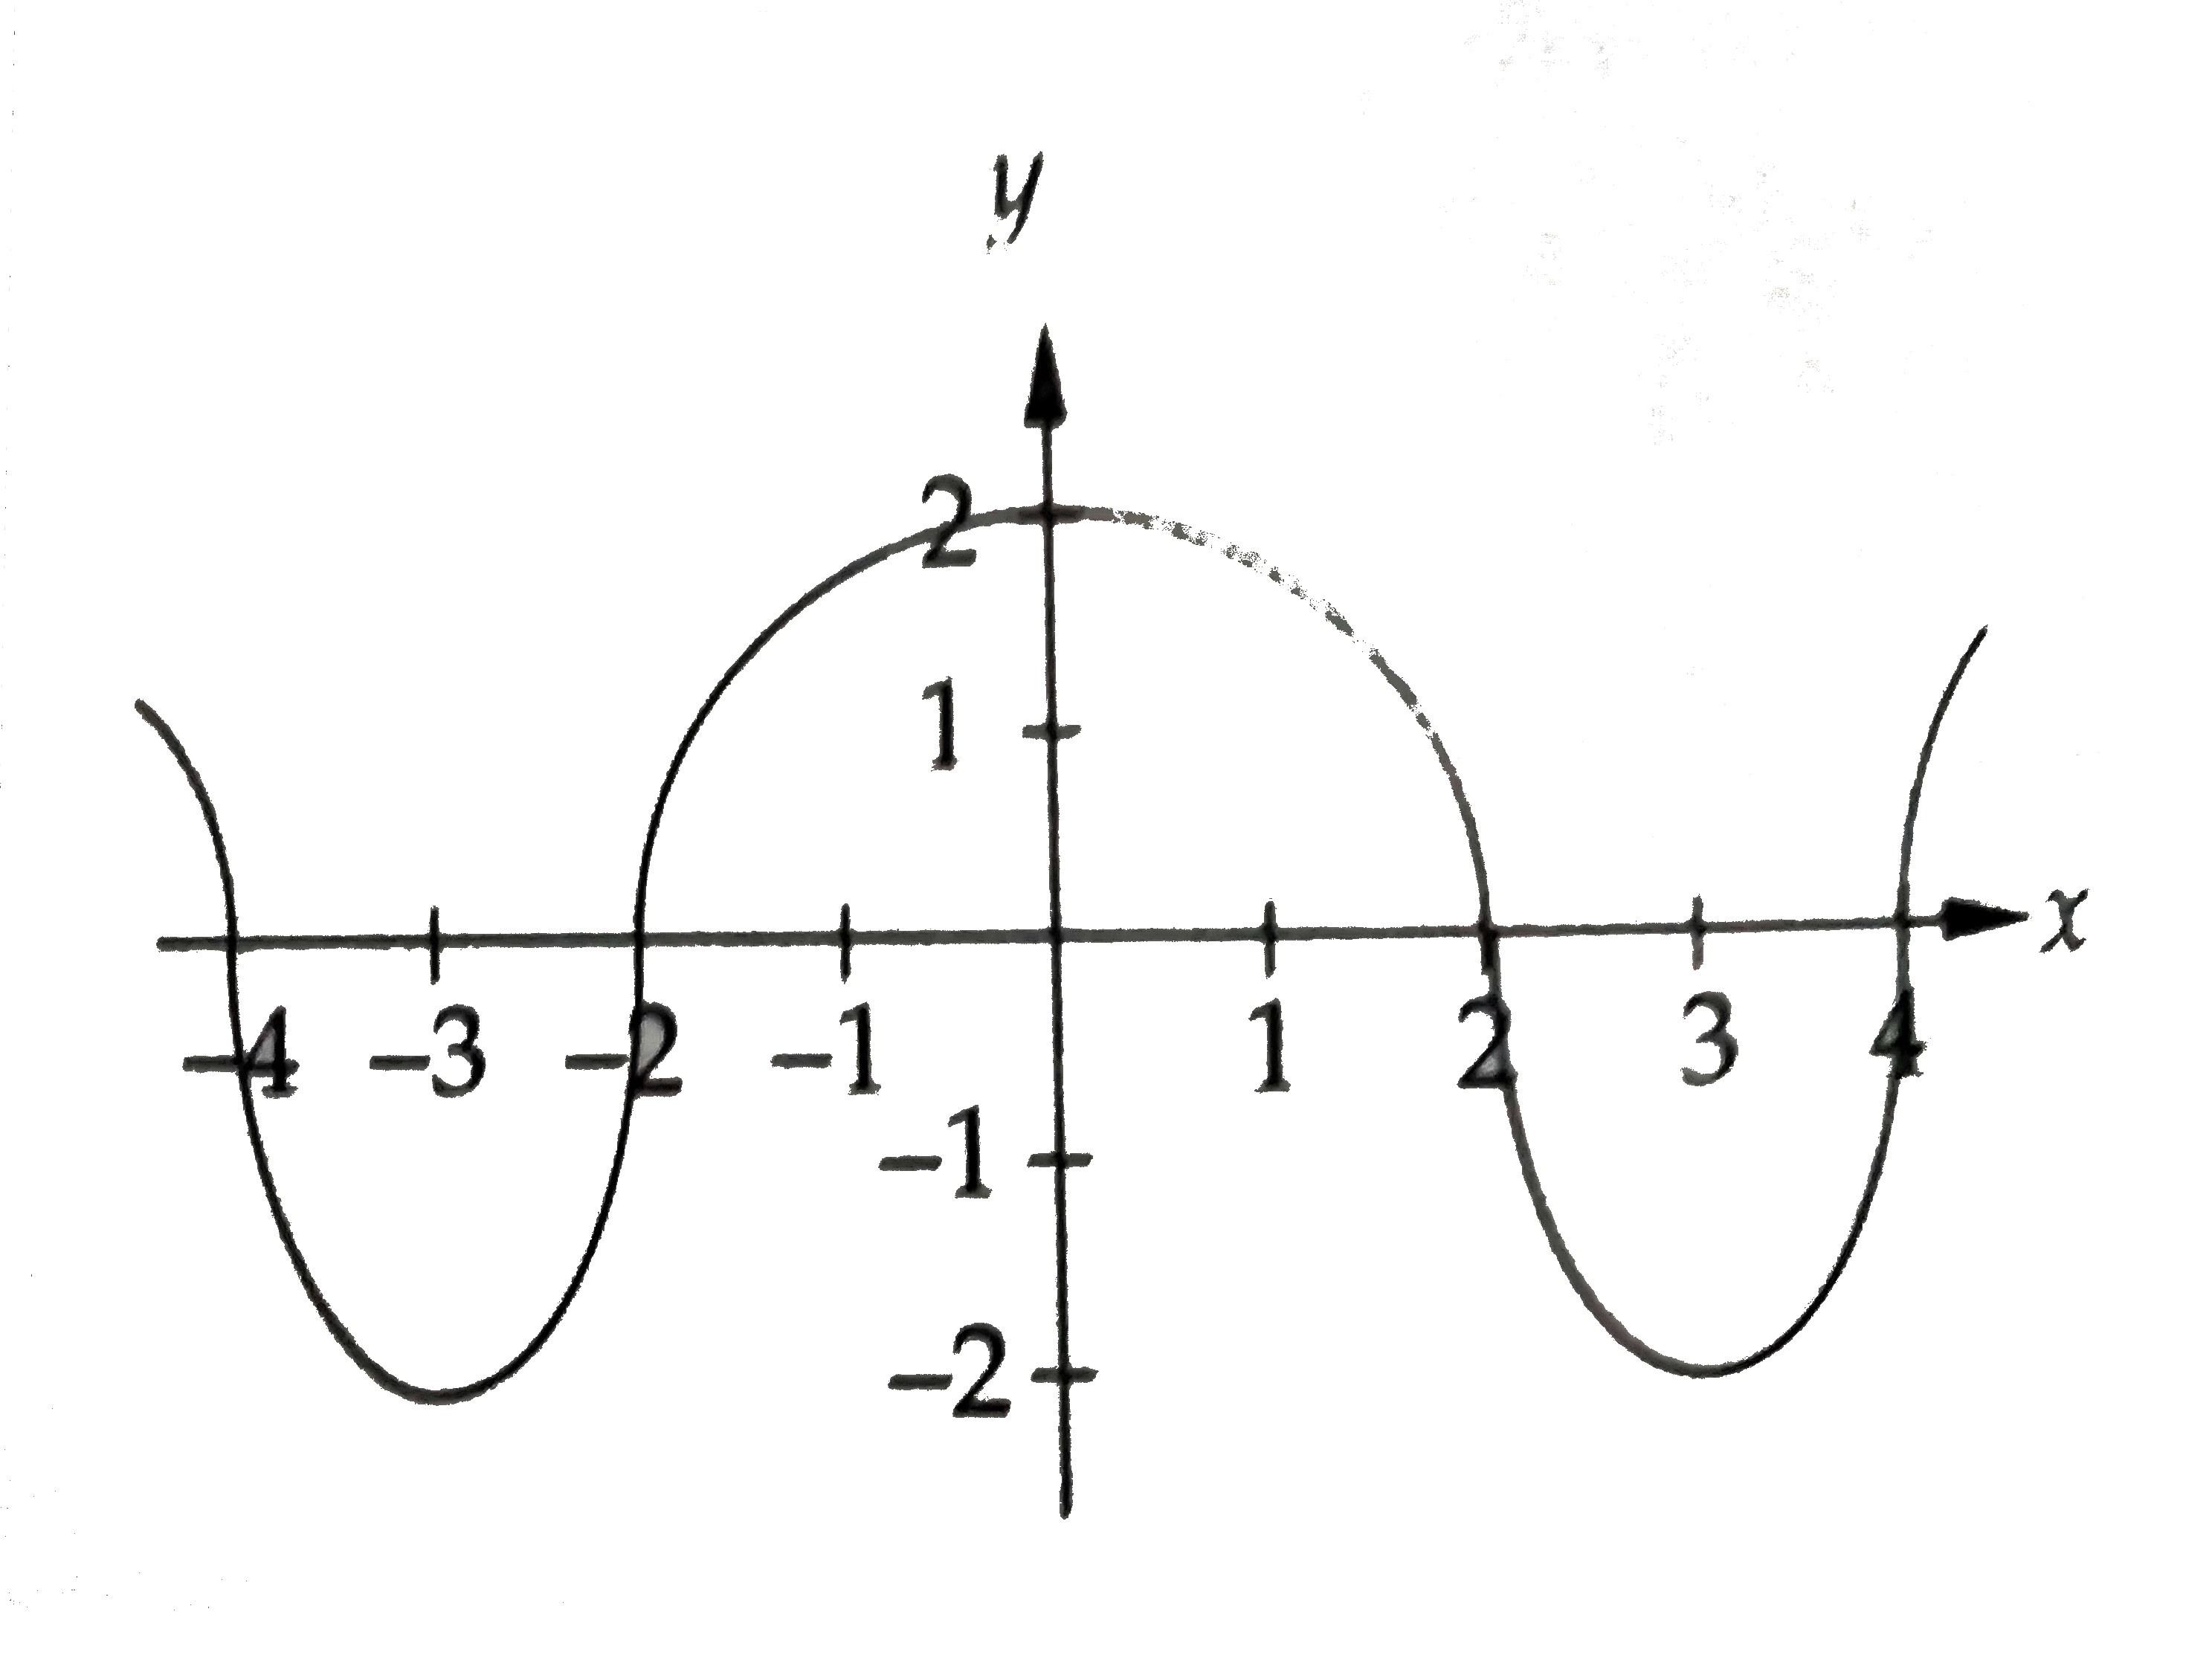
The figure above shows the graph of function f. If g(x)=−f(x), which graph represents function g?A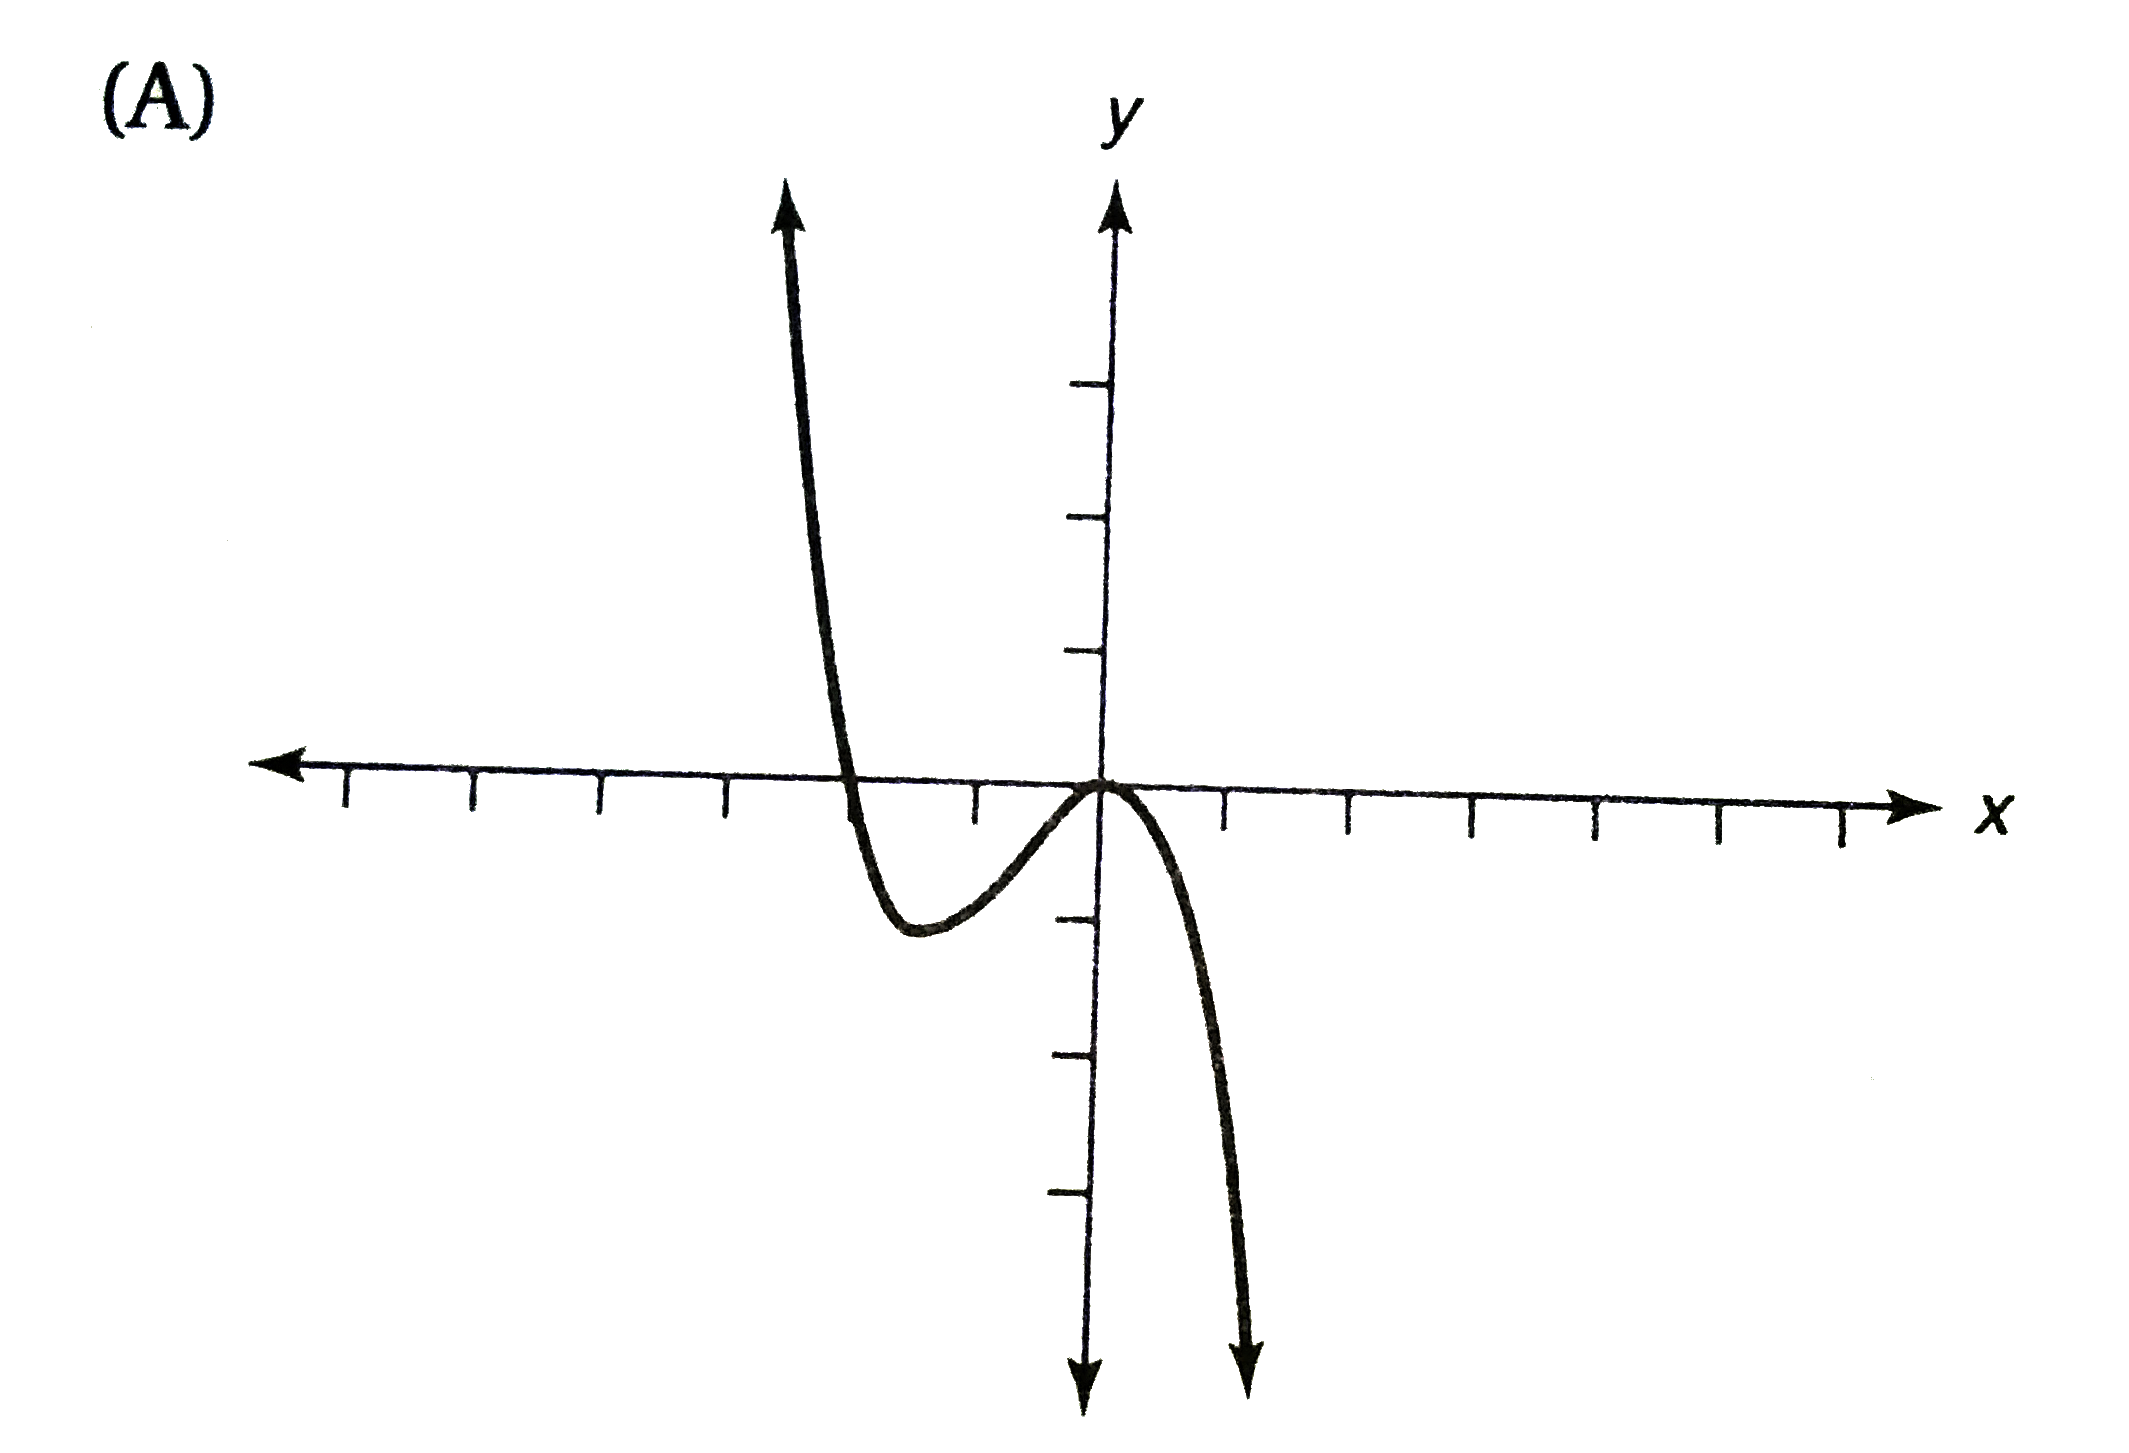 B
B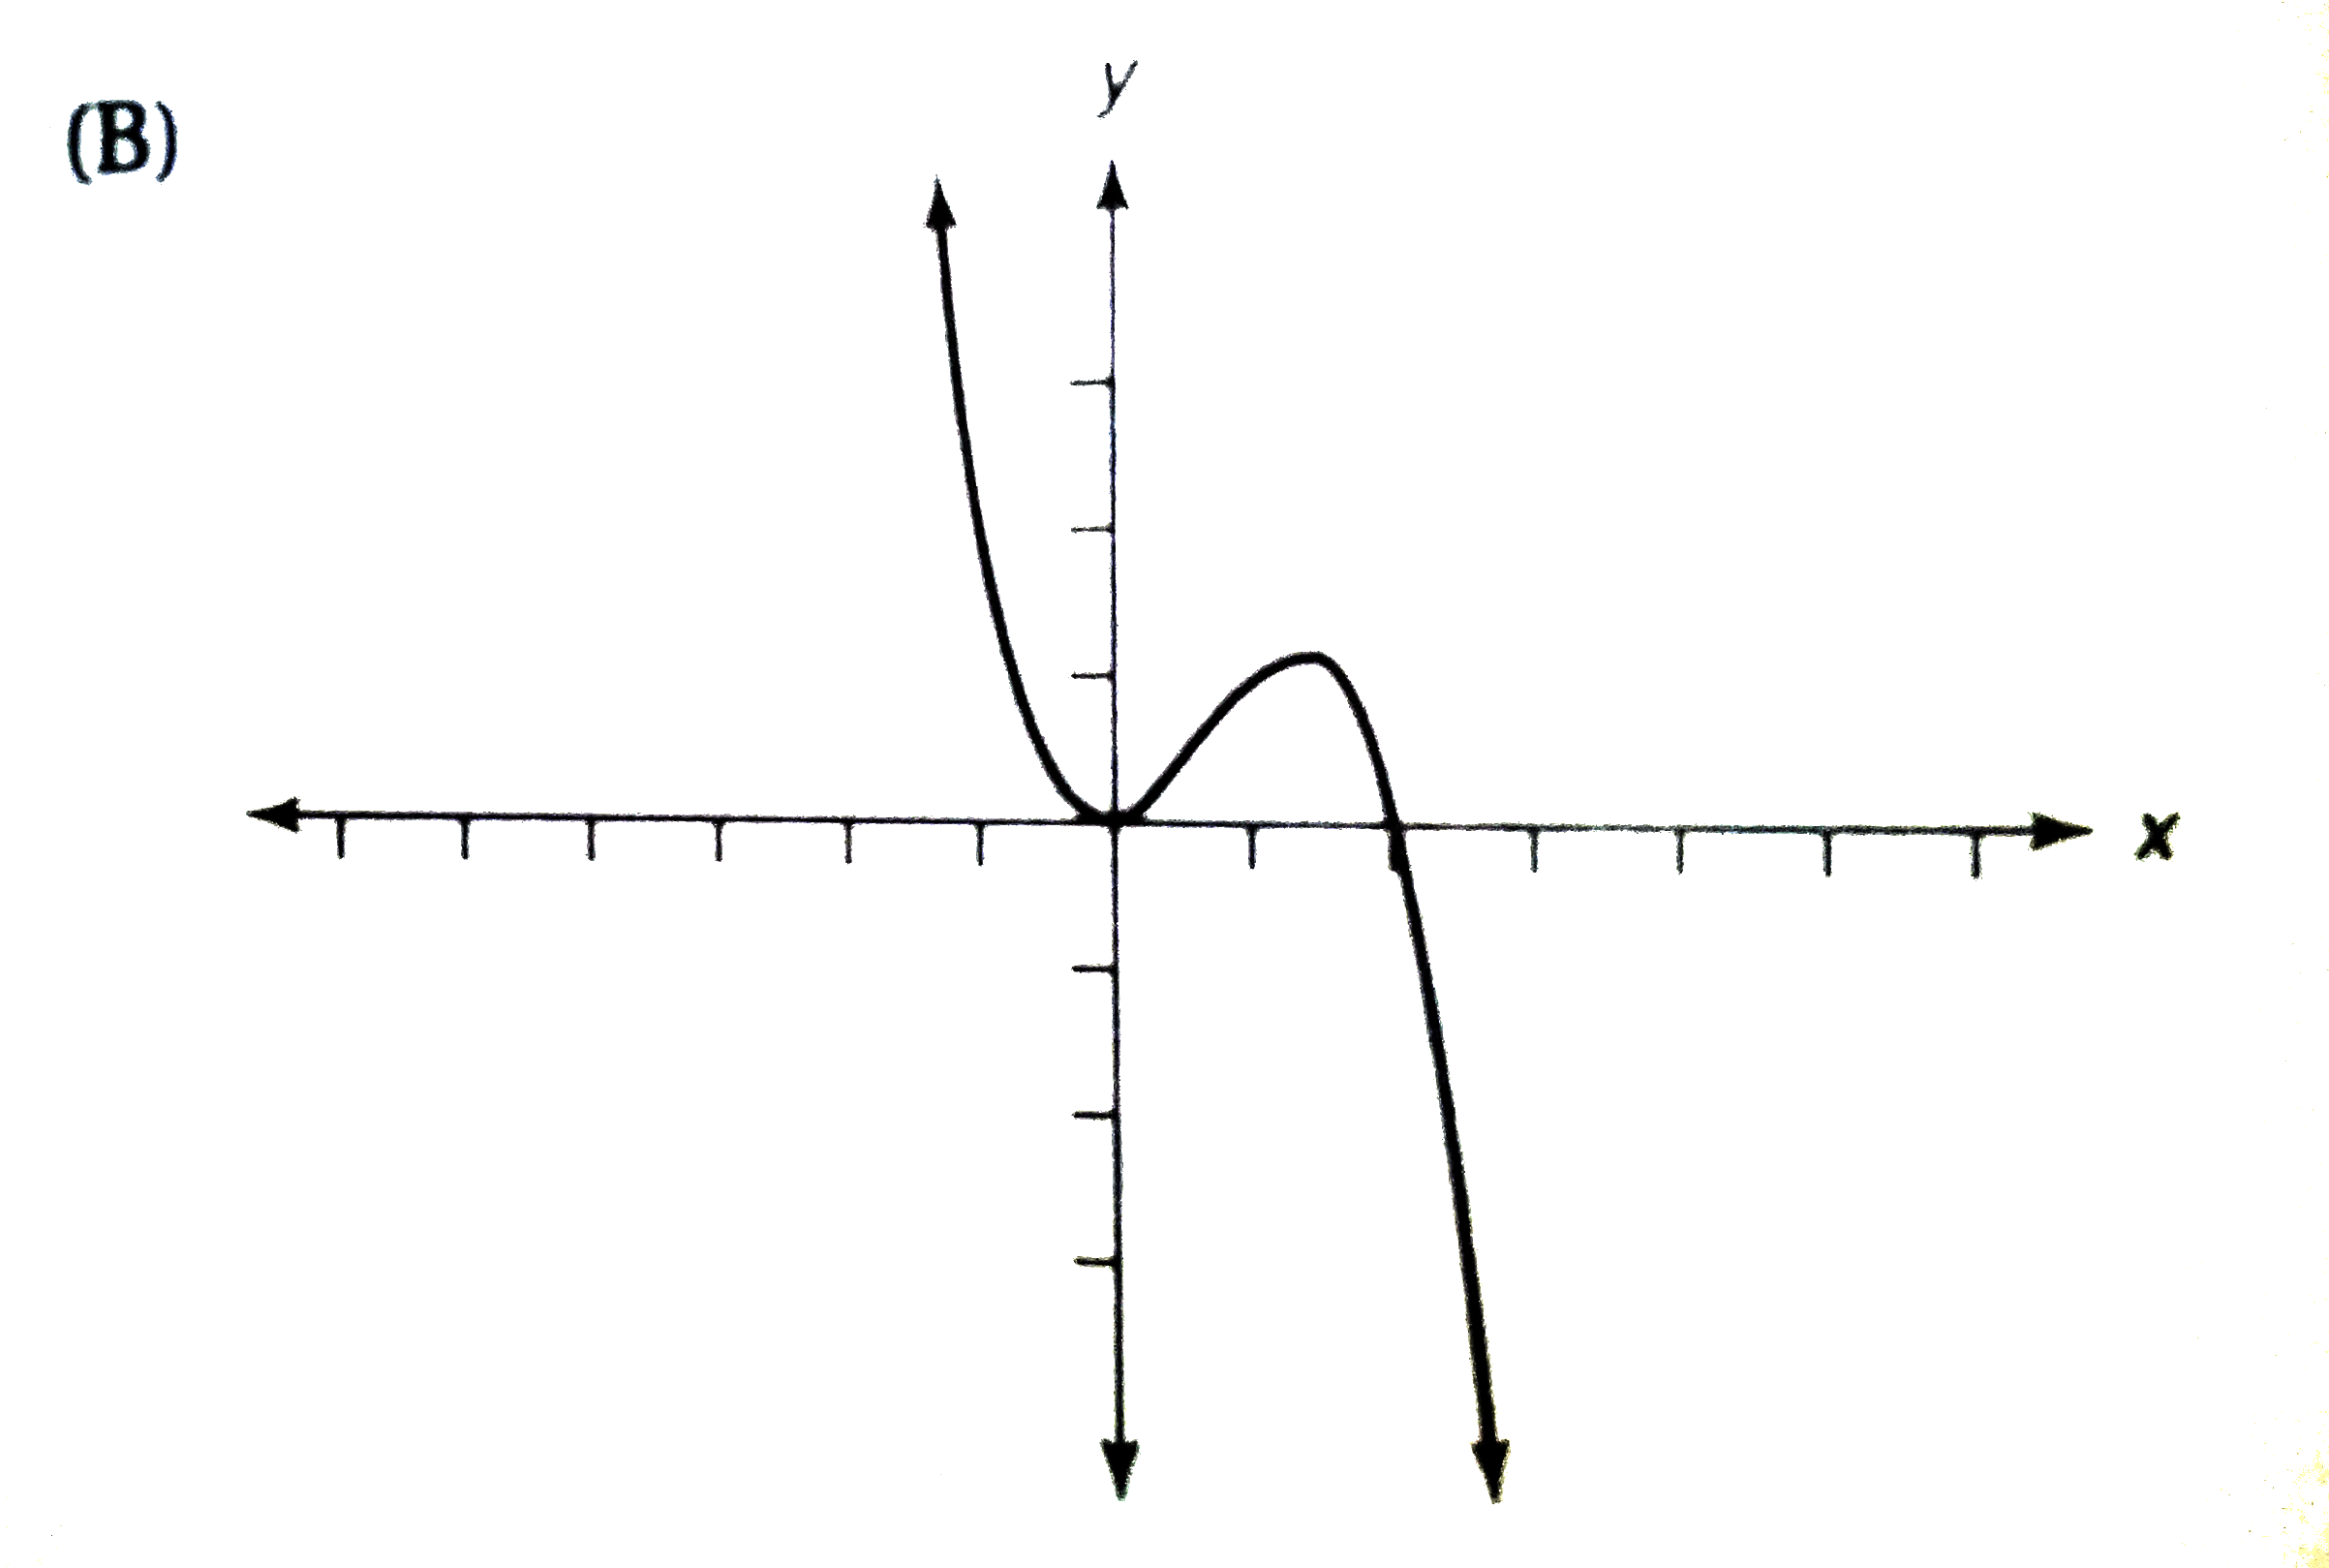 C
C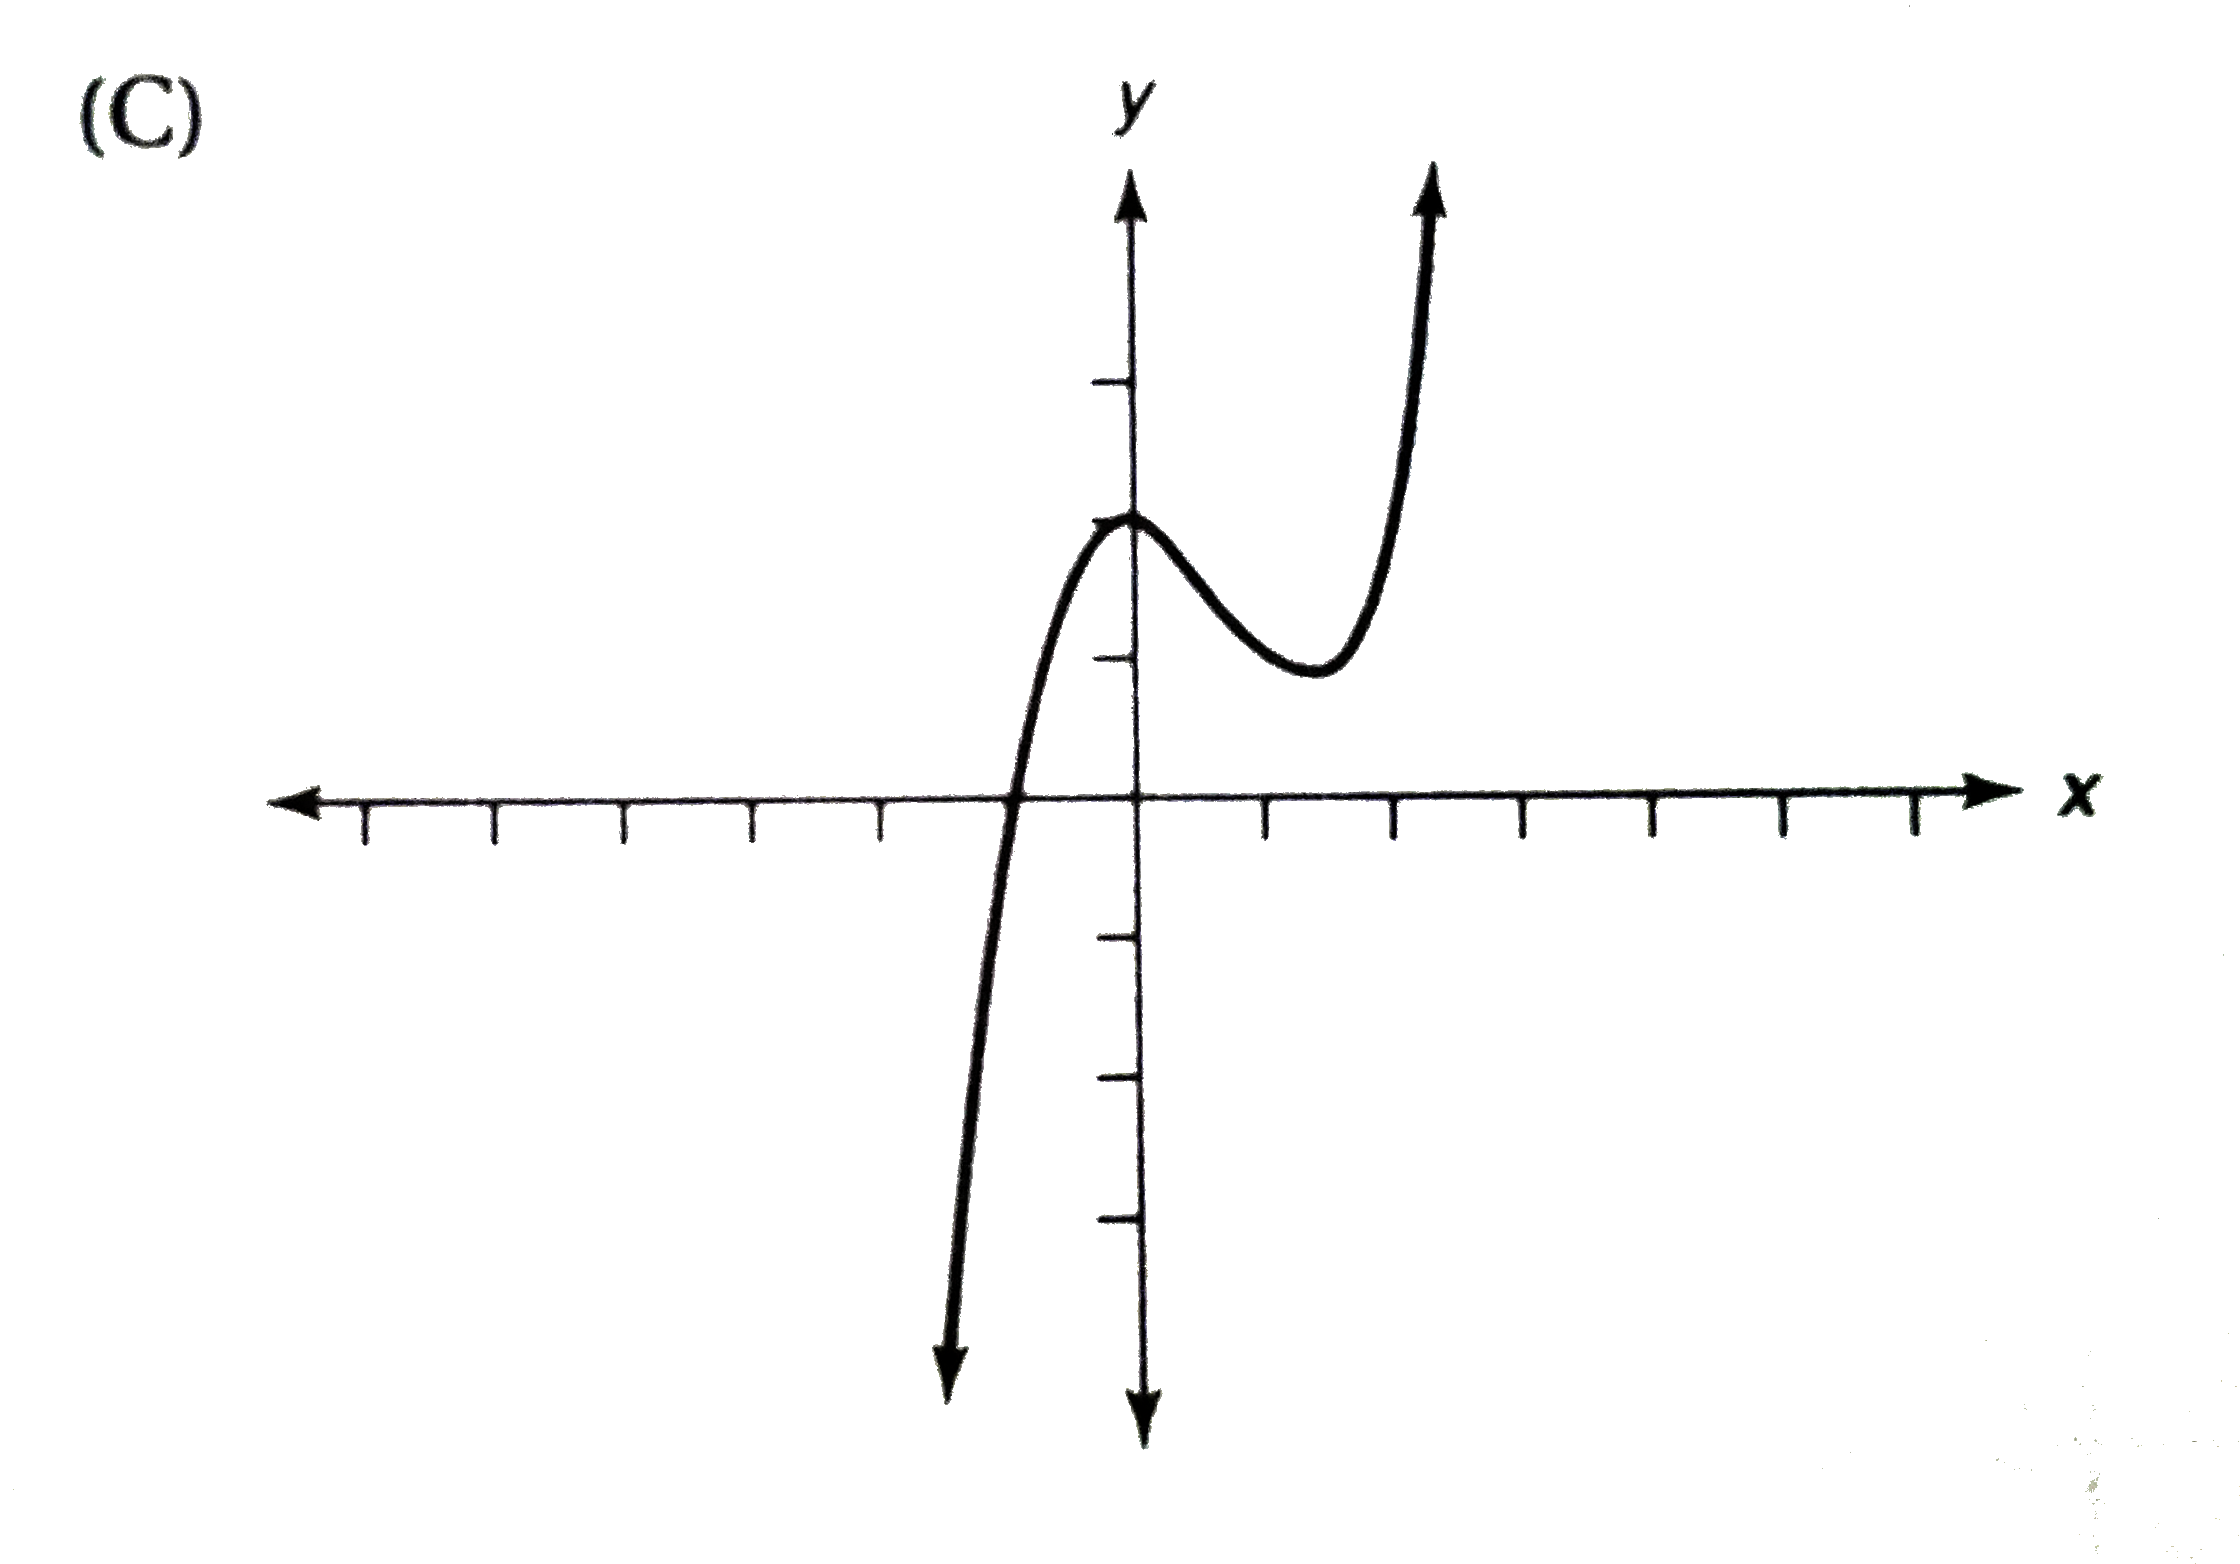 D
D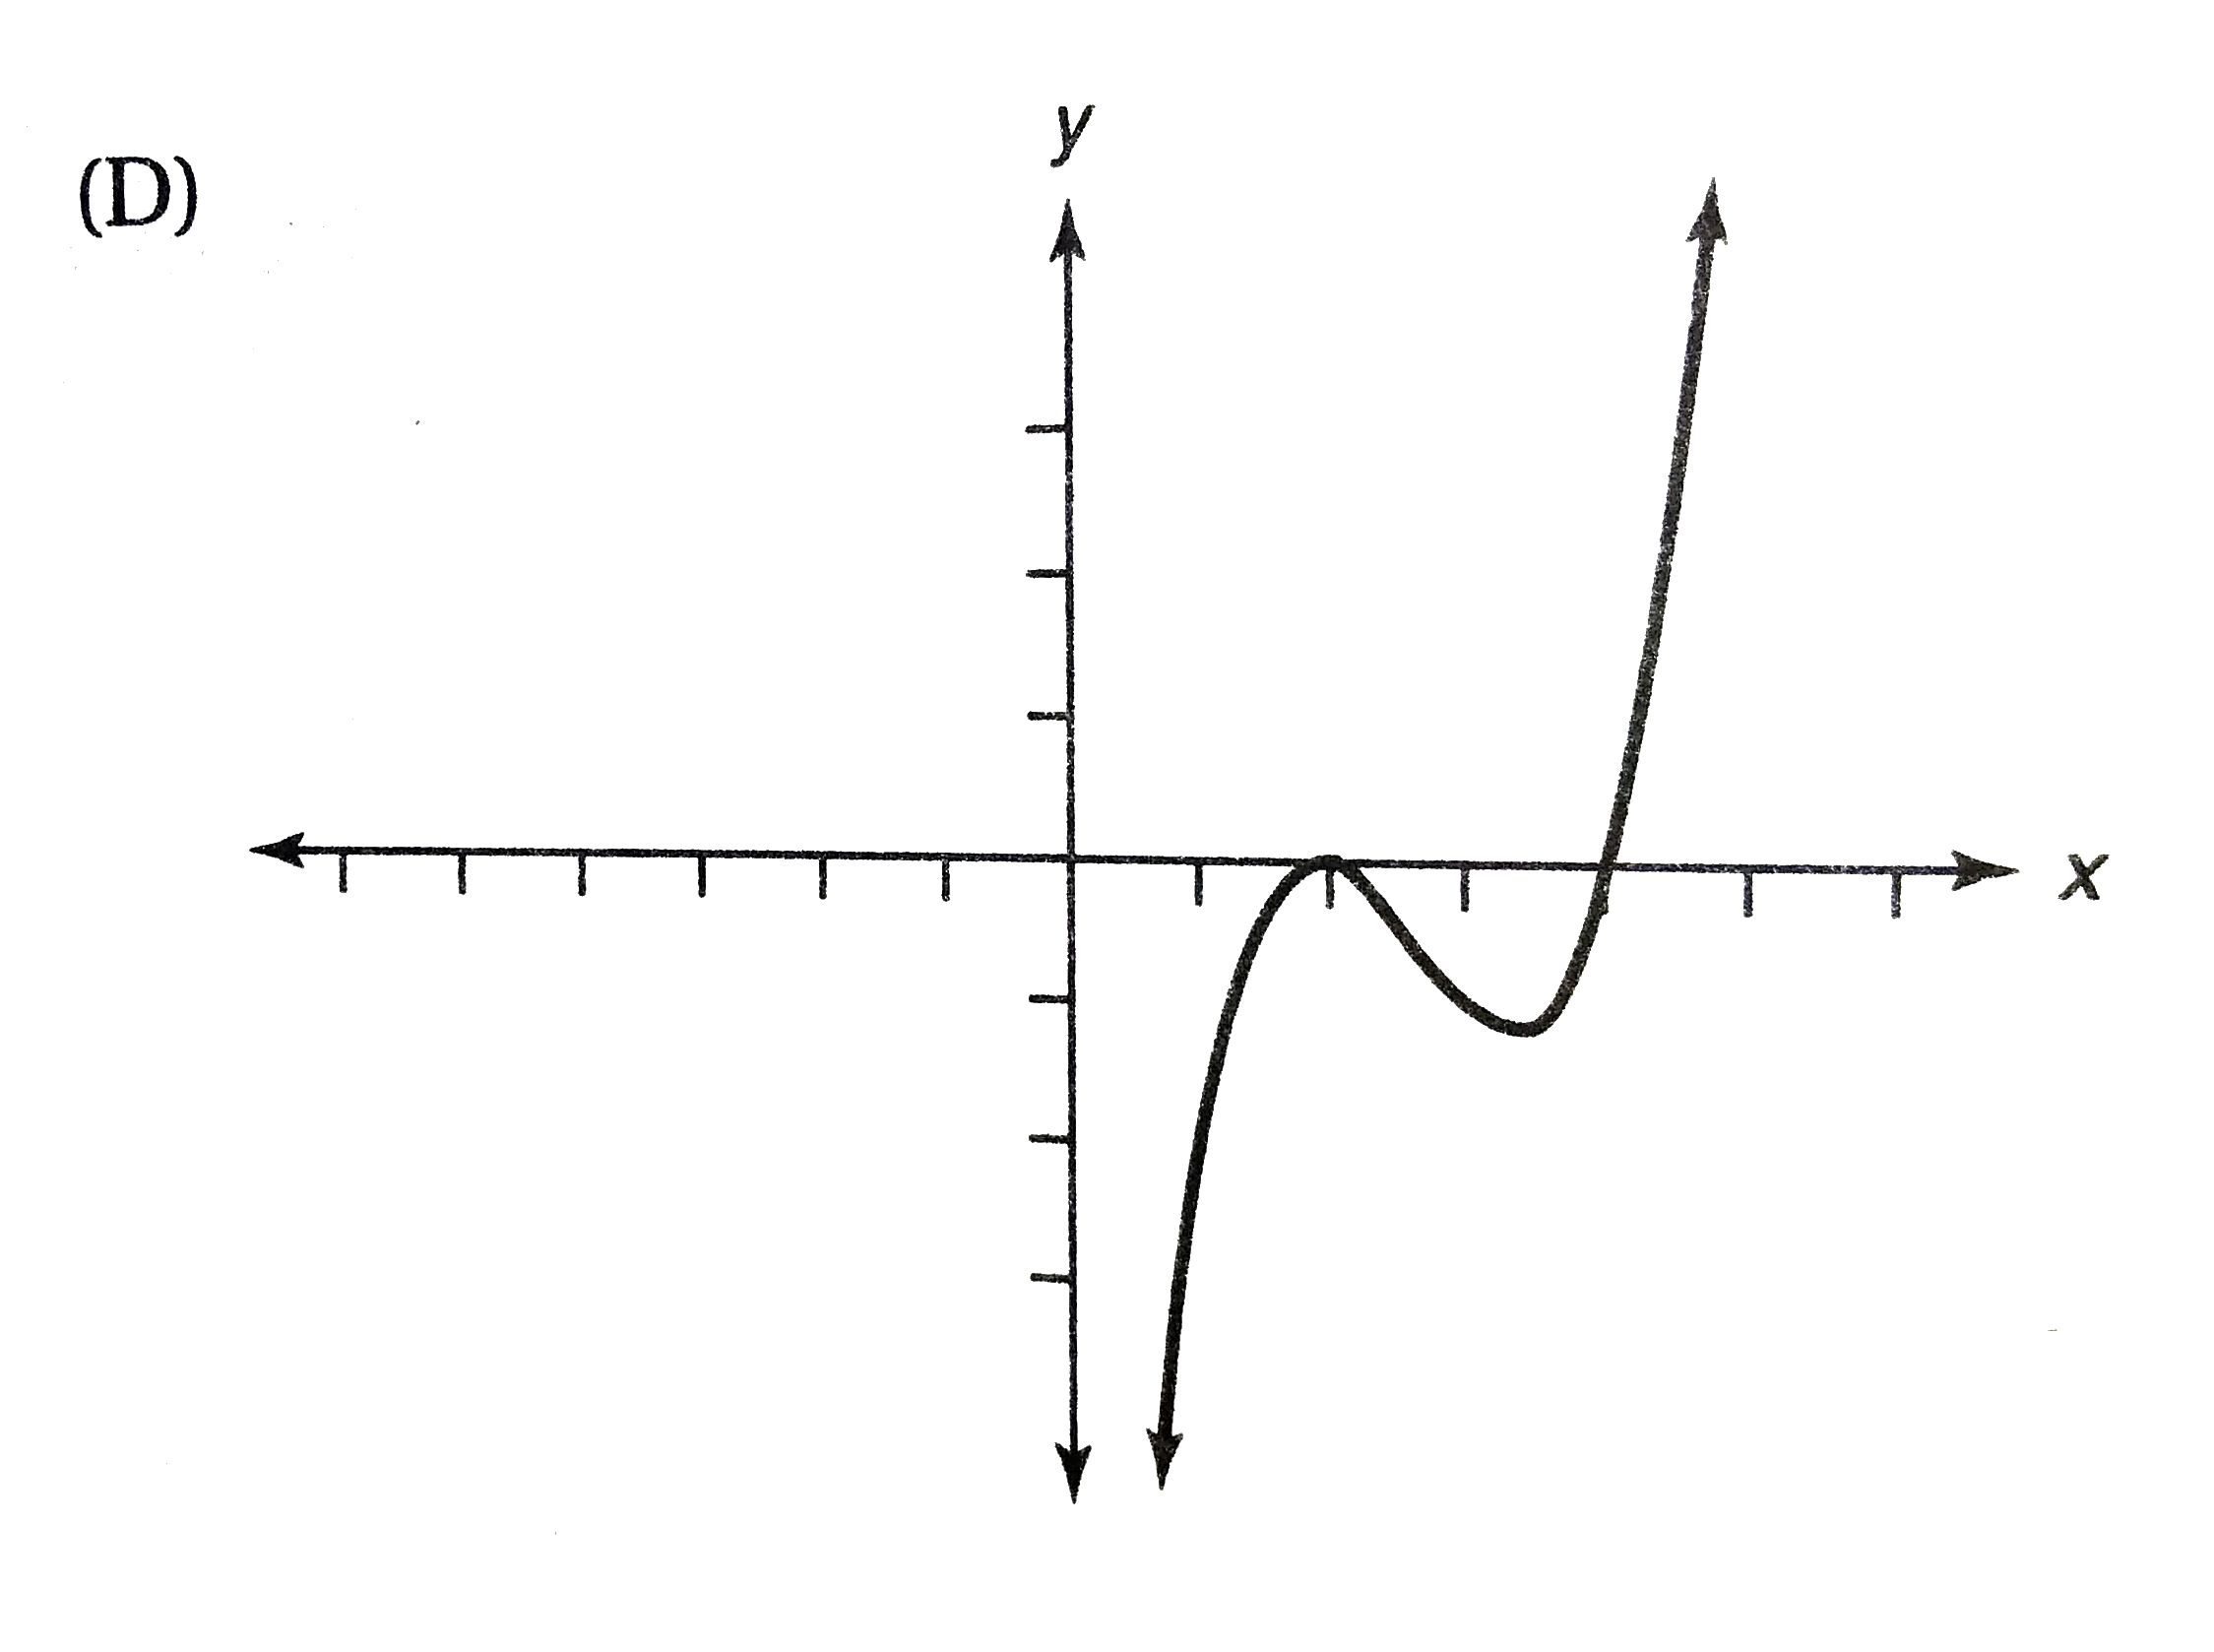
Which of the following graphs shows a stong positive association between x and y?
A B
B C
C D
D
The figure below shows the velocity-time graph of a body moving in a straight line.
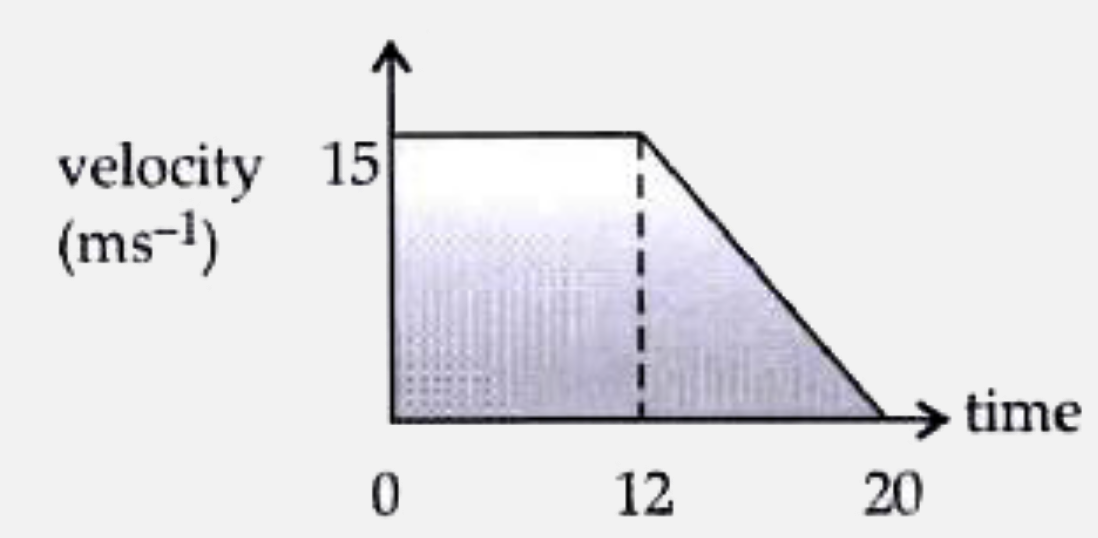
Find the time interval in which the body is moving with zero acceleration
View SolutionThe figure below shows the velocity-time graph of a body moving in a straight line.

Find the total displacement of the body.
View SolutionPlot a graph of terminnal velocity versus time.
View SolutionThe shaded portion of Figure shows the graph of which of the following ?
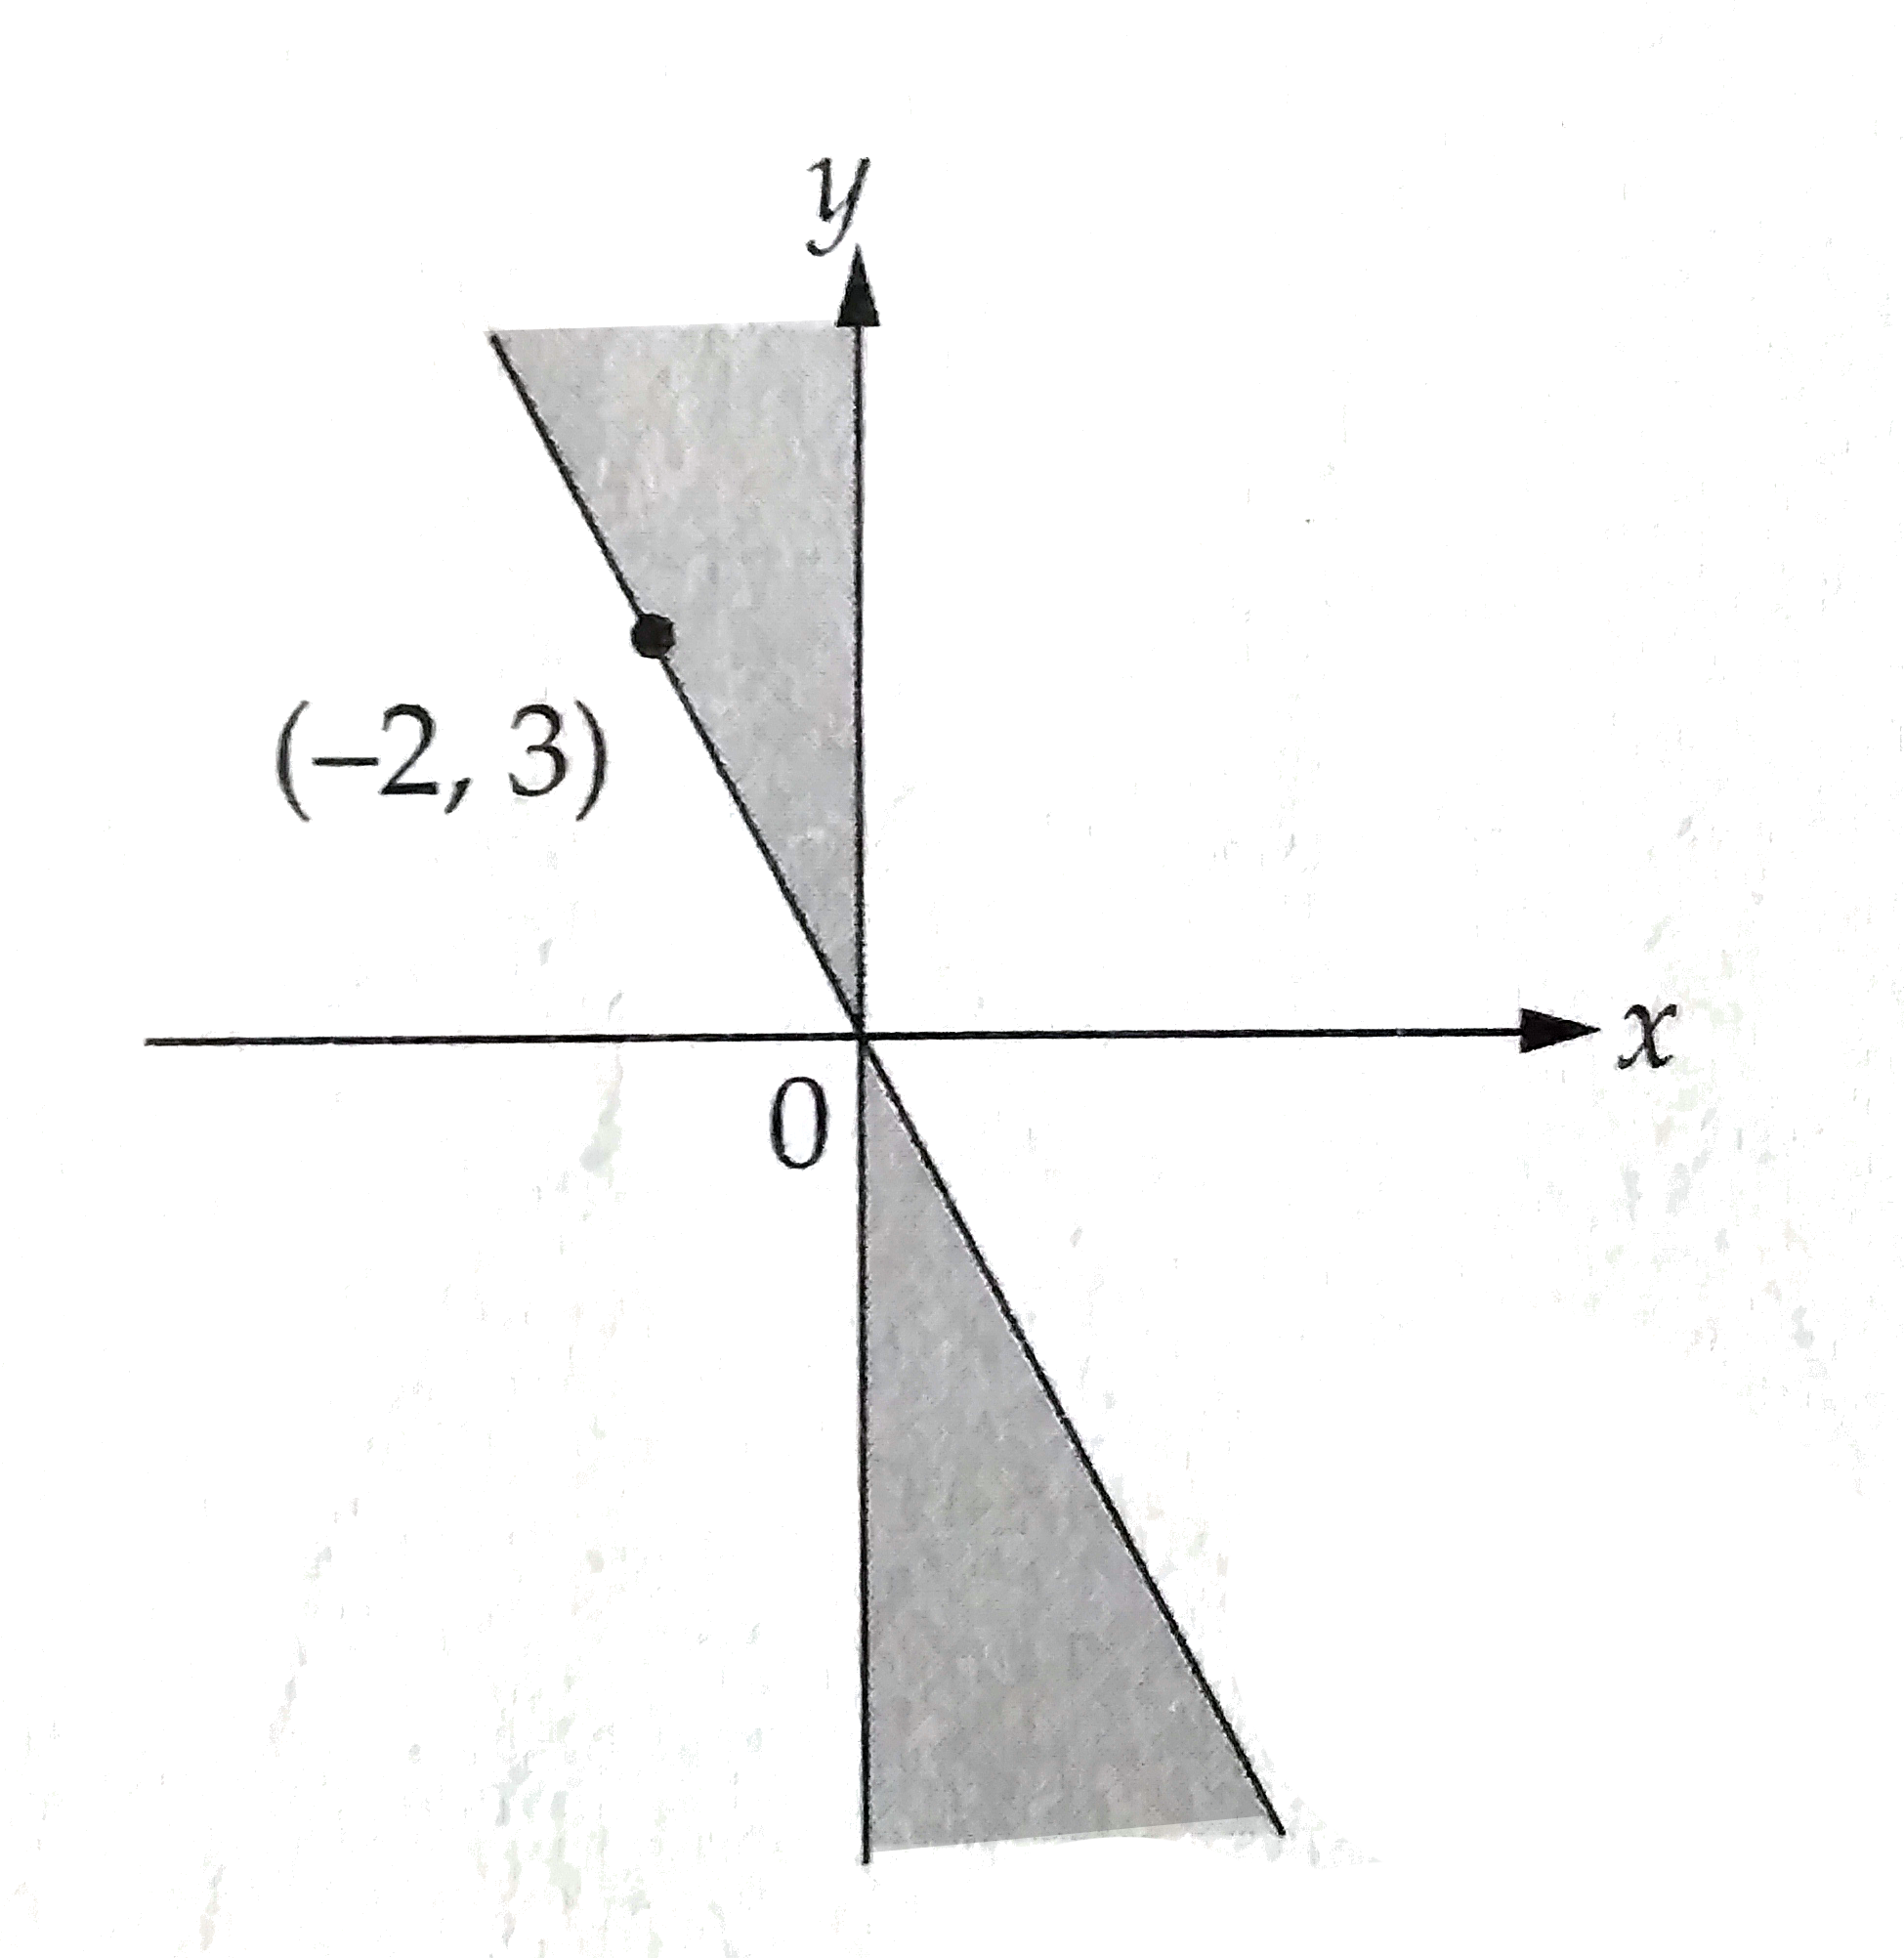
View SolutionIn Figure shows the graph of f(x), what is the value of f(f(3)) ?
View Solution

