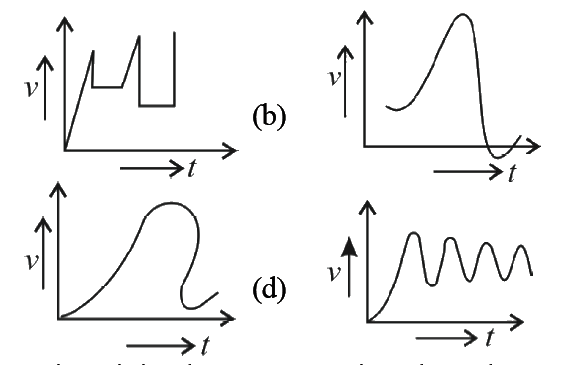
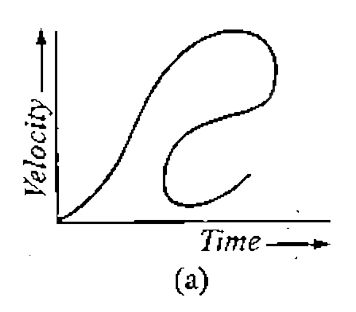
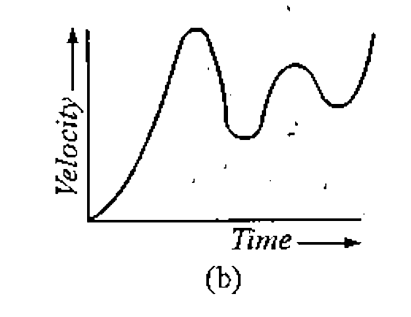
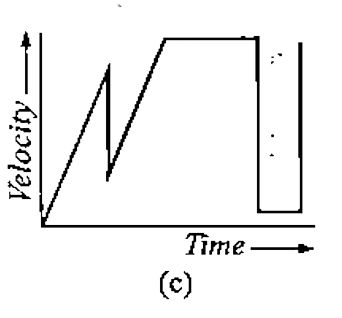
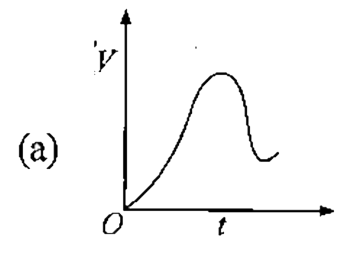
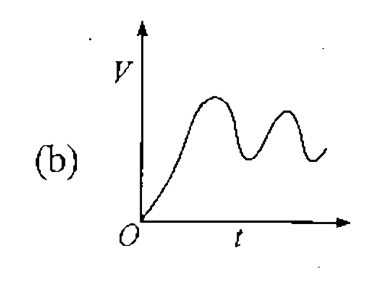
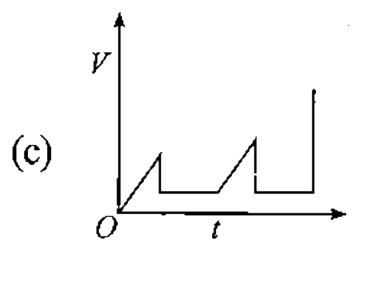
Figure shows some velocity versus time graphs :
 ,
,  ,
,  ,
, 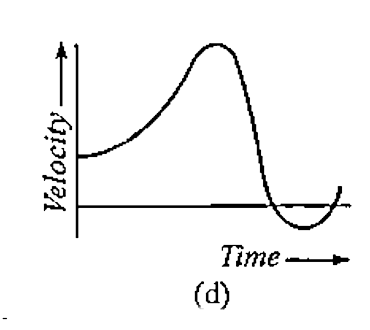
Only some of these can be realised in practice.These are:
Figure-(a)
Figure-(b)
Figure-(c)
Figure-(d)
The correct Answer is:B, D
Step by step video, text & image solution for Figure shows some velocity versus time graphs : , , , Only some of these can be realised in practice.These are: by Physics experts to help you in doubts & scoring excellent marks in Class 11 exams.
Updated on:21/07/2023Topper's Solved these Questions
- KINEMATICSBook:PHYSICS GALAXY - ASHISH ARORAChapter:KINEMATICSExercise:Unsolved Numerical Pro.
Explore 83 Videos
- KINEMATICSBook:PHYSICS GALAXY - ASHISH ARORAChapter:KINEMATICSExercise:Numerical
Explore 111 Videos
- GRAVITATIONBook:PHYSICS GALAXY - ASHISH ARORAChapter:GRAVITATIONExercise:Unsolved Numerical
Explore 94 Videos
- LINEAR MOMENTUM & ITS CONSERVATIONBook:PHYSICS GALAXY - ASHISH ARORAChapter:LINEAR MOMENTUM & ITS CONSERVATIONExercise:exercise 1.3
Explore 3 Videos
Similar Questions
Knowledge Check
The following figures show some velocity versus time curves. But only some of these can be realised in practice. These are:
 ,
,  ,
,  ,
, 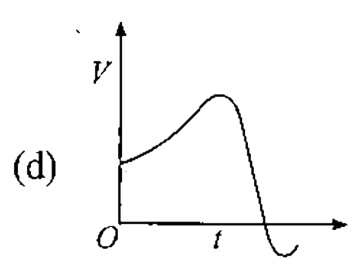 AOnly a, b and dBOnly a, b, cCOnly b and cDAll of them
Figure shows a velocity-time graph. This shows that.
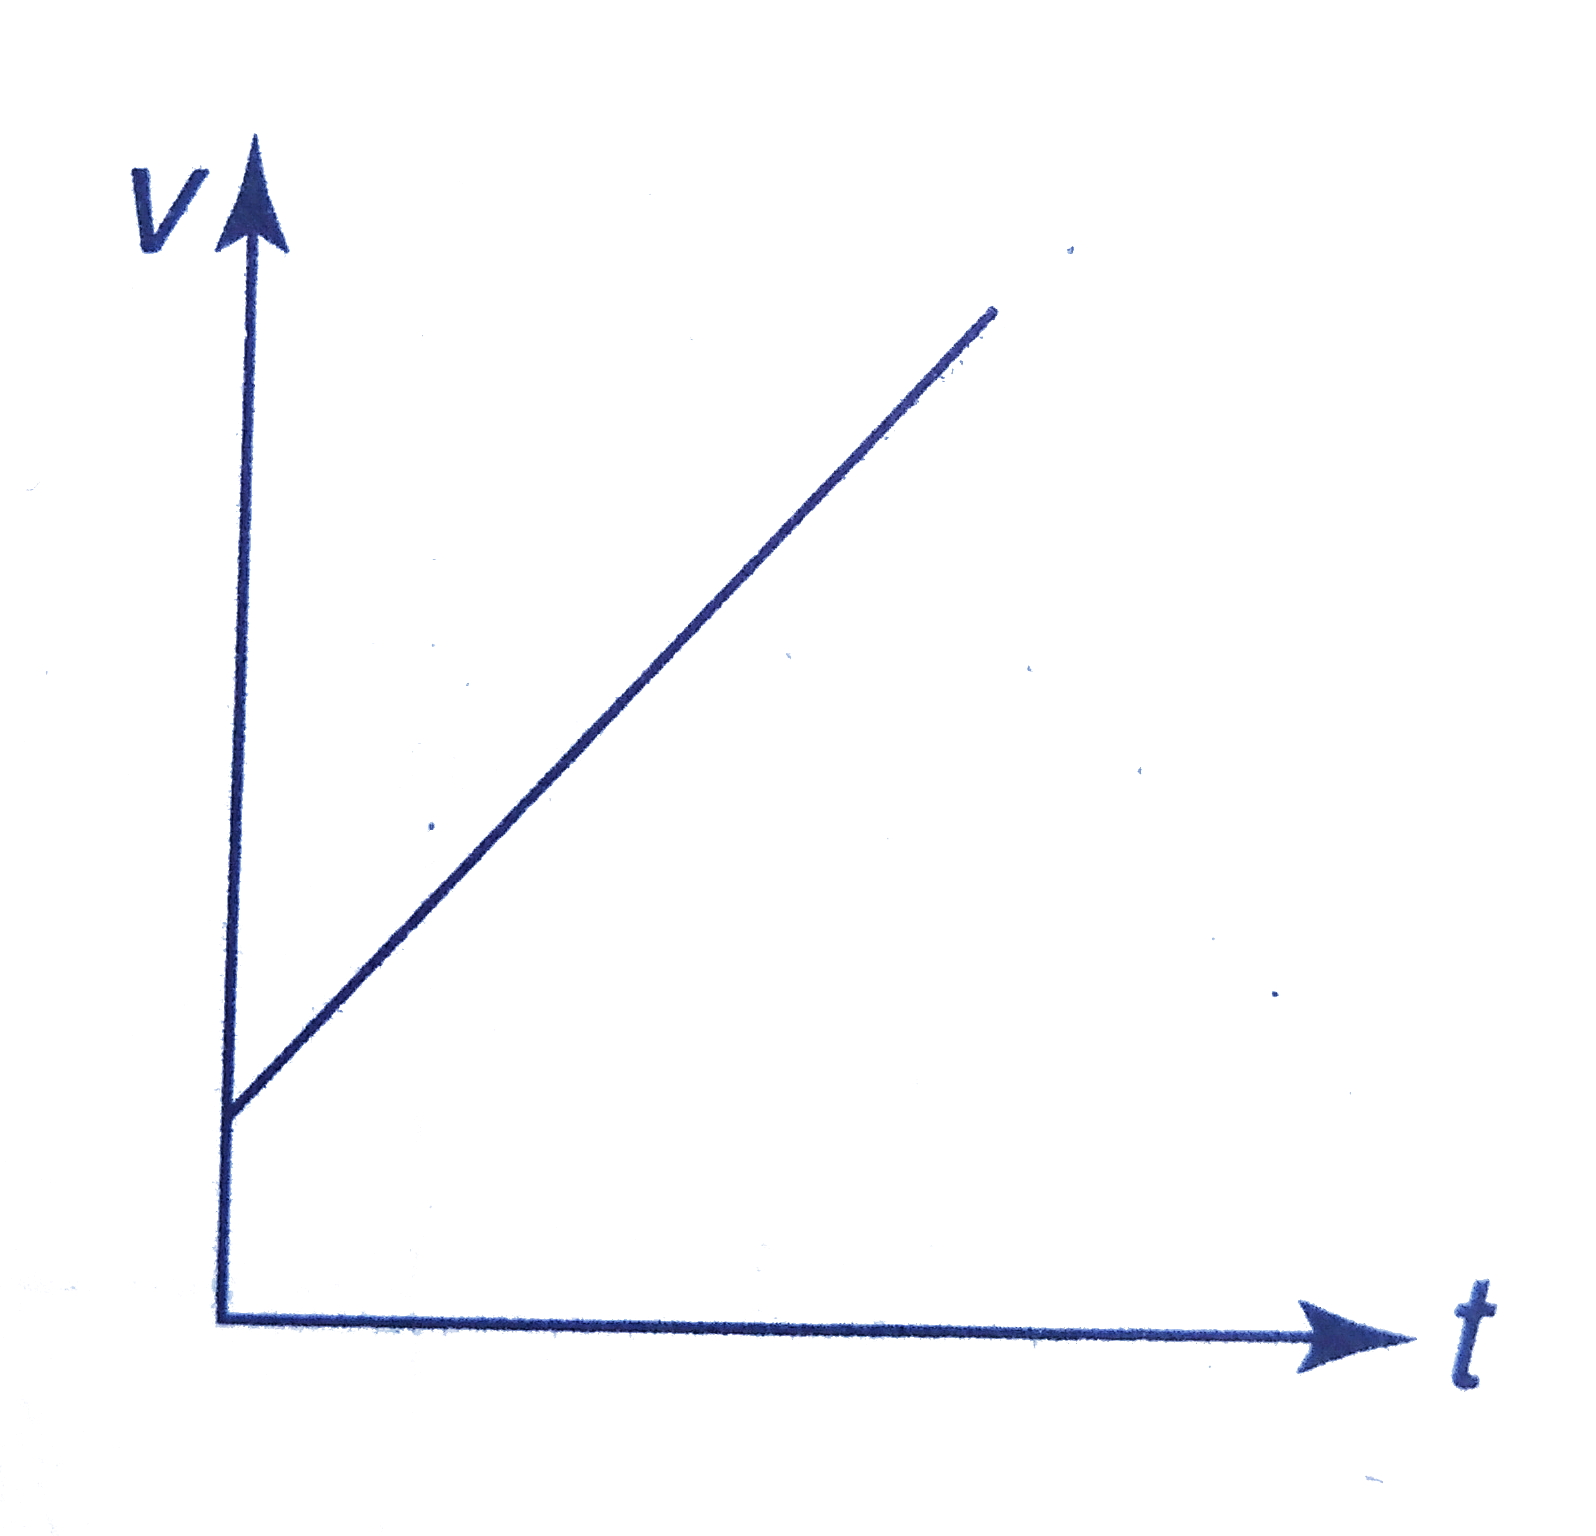 Athe body is at restBthe body starts from rest and moves with uniform velocityCthe body has some initial velocity and moves with uniform accelerationDthe motion is retarded
The figure shows the angular velocity versus time graph of a flywheel. The angle, in radians through which the flywheel turns during 25 s is
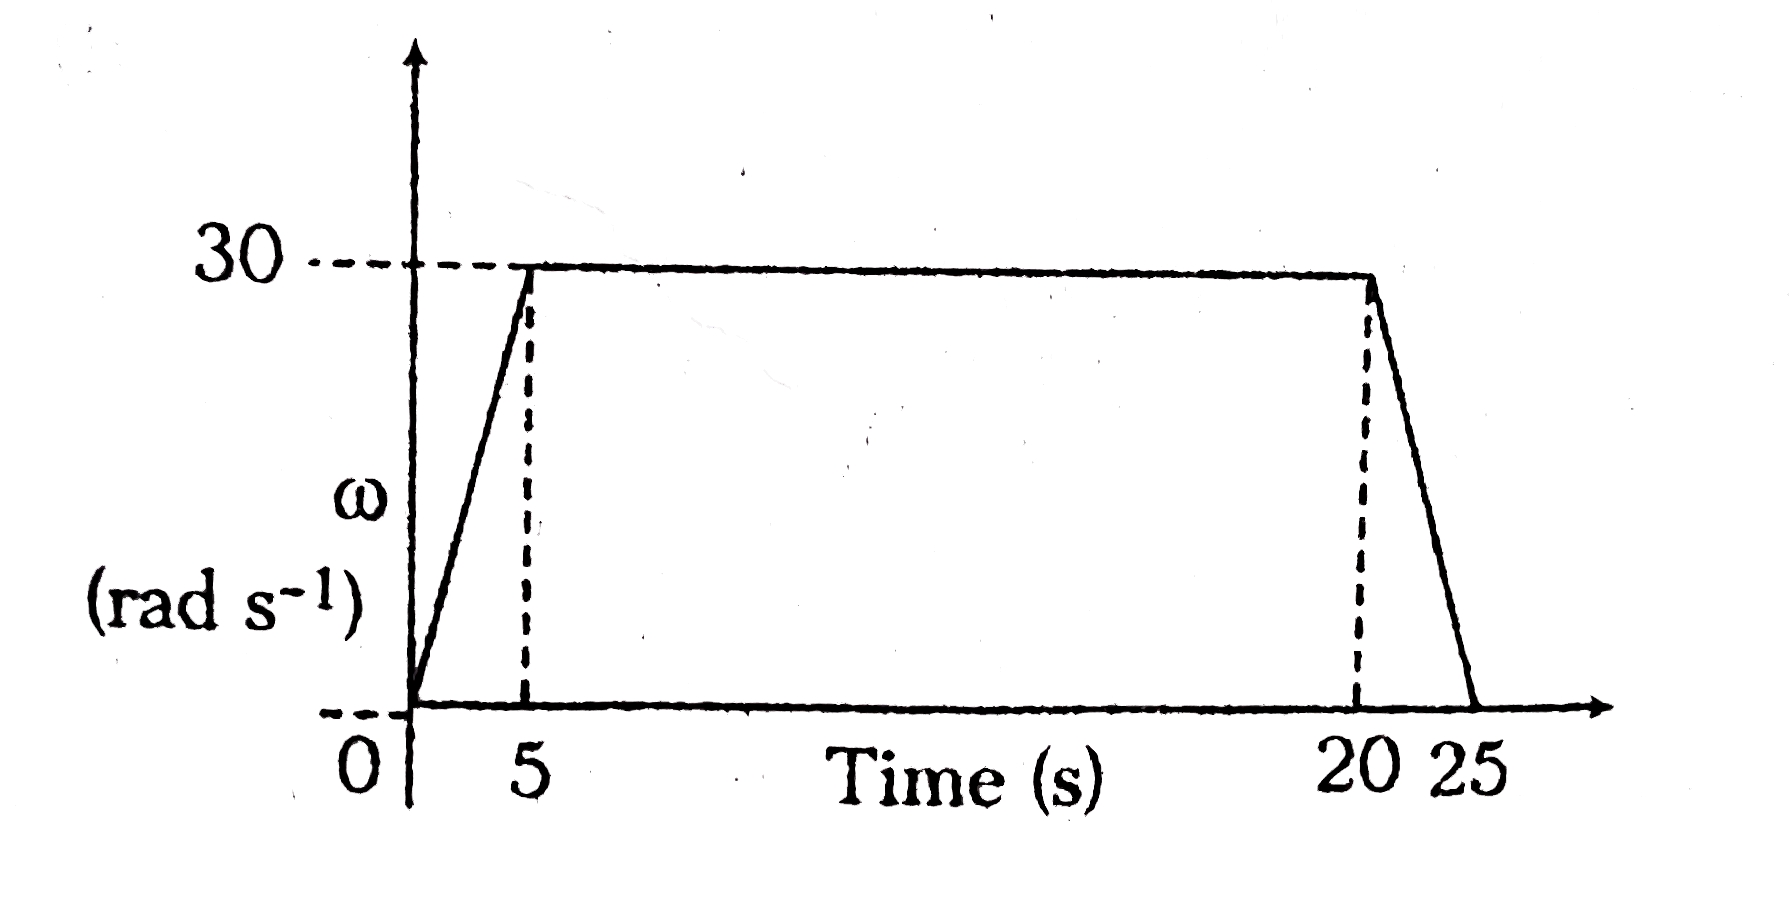 A120B480C600D750
What is a black body ? How can it be realised in practice ?
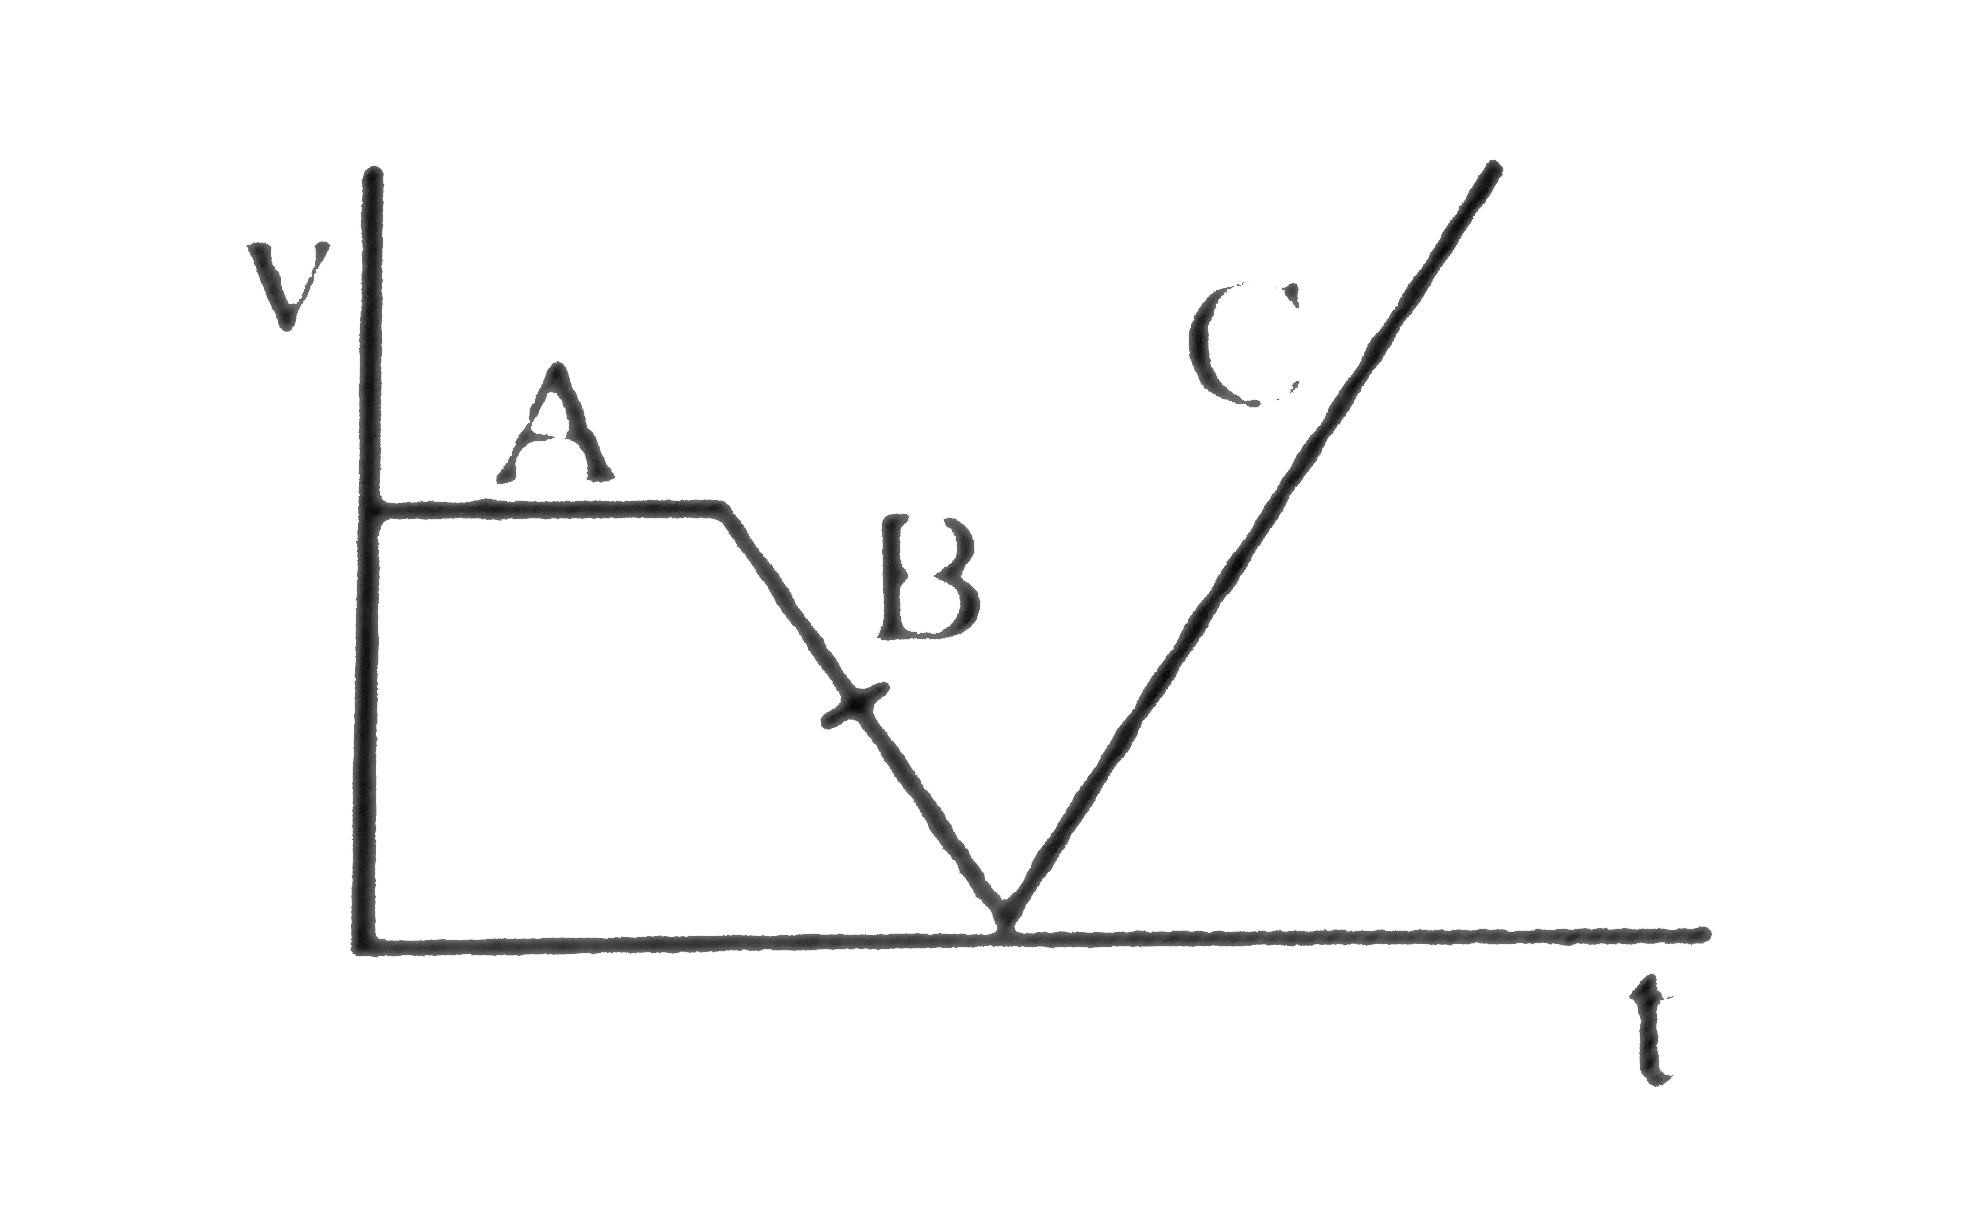
View SolutionVelocity versus time graph of a body is shown in figure. It explains that
View SolutionThe graph in figure shows the velocity v versus time t for a body. Which of the graphs shown in figure represents the corresponding acceleration versus time graphs ?
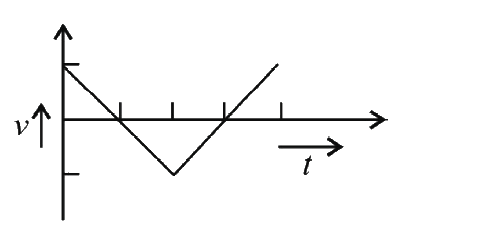
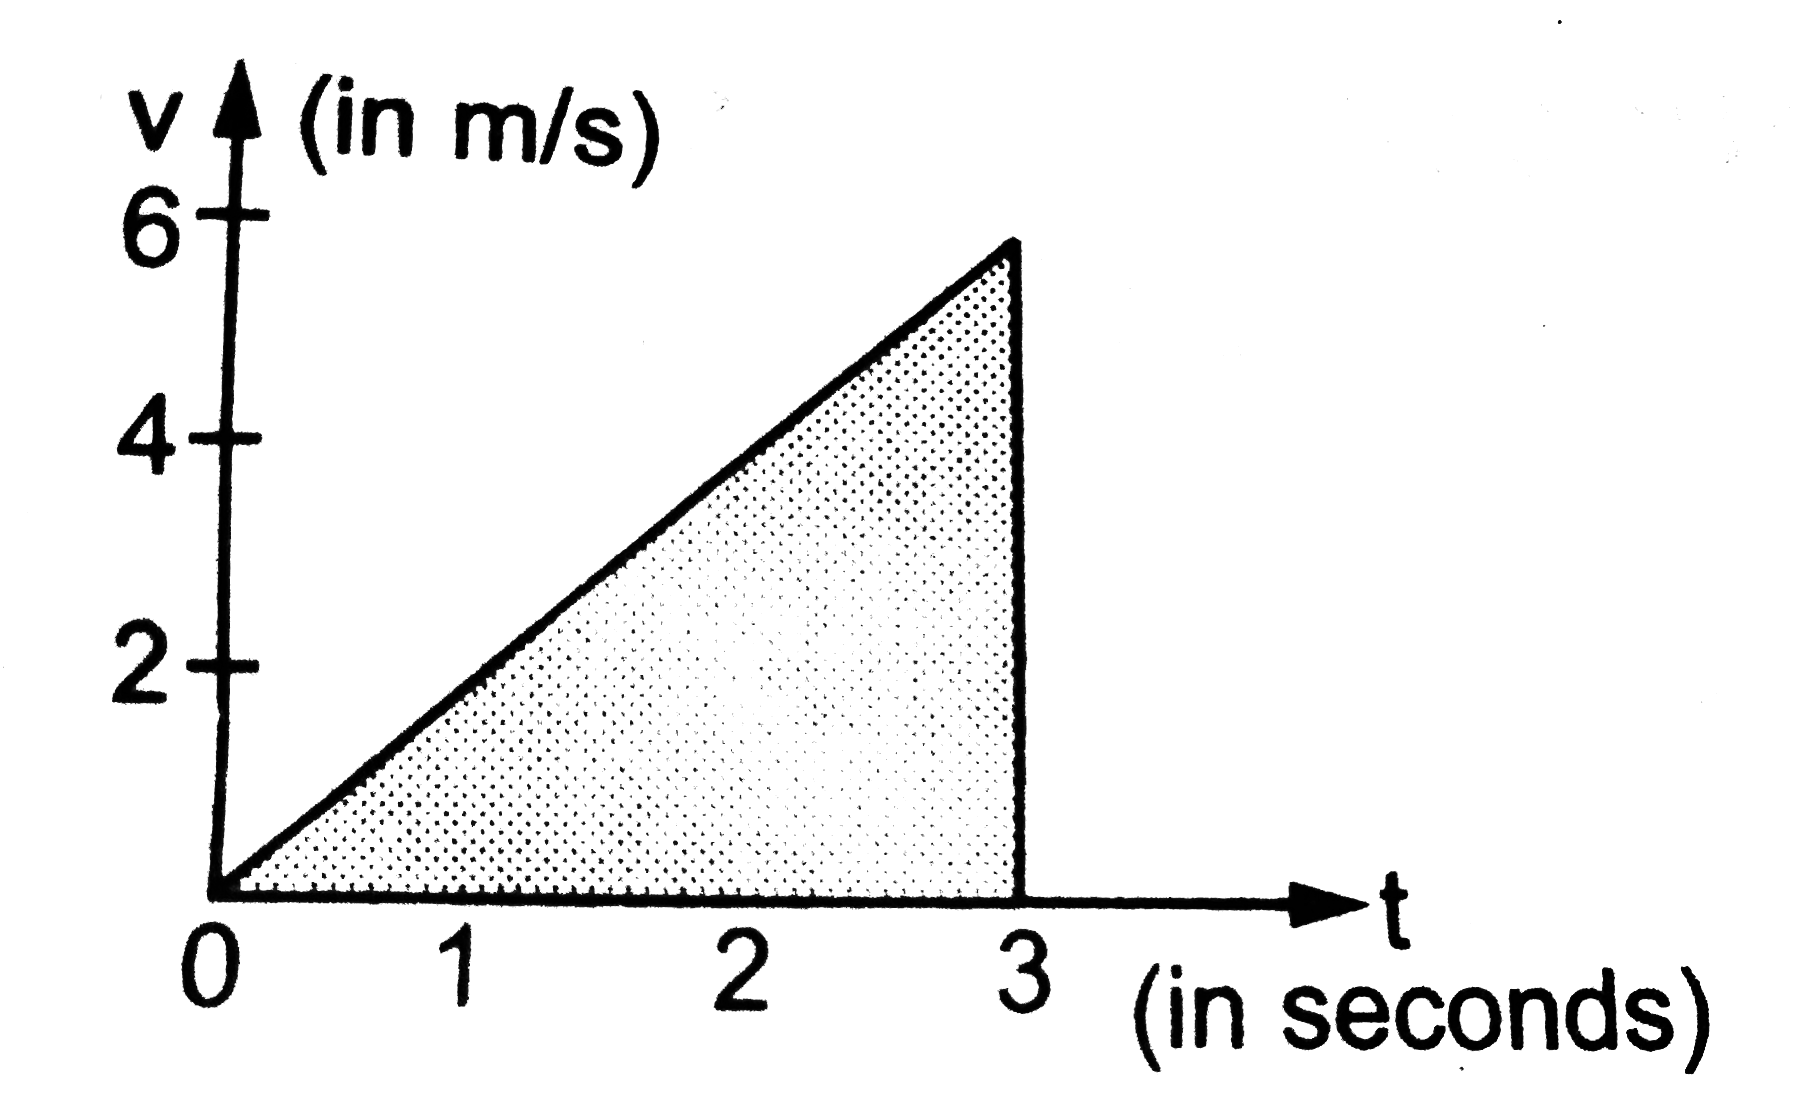
View SolutionFigure shows the speed versus time graph for a particle. Find the distance travelled by the particle during the time t=0 to t=3s.
View SolutionThe graph below shws the velocity versus time graph for a body
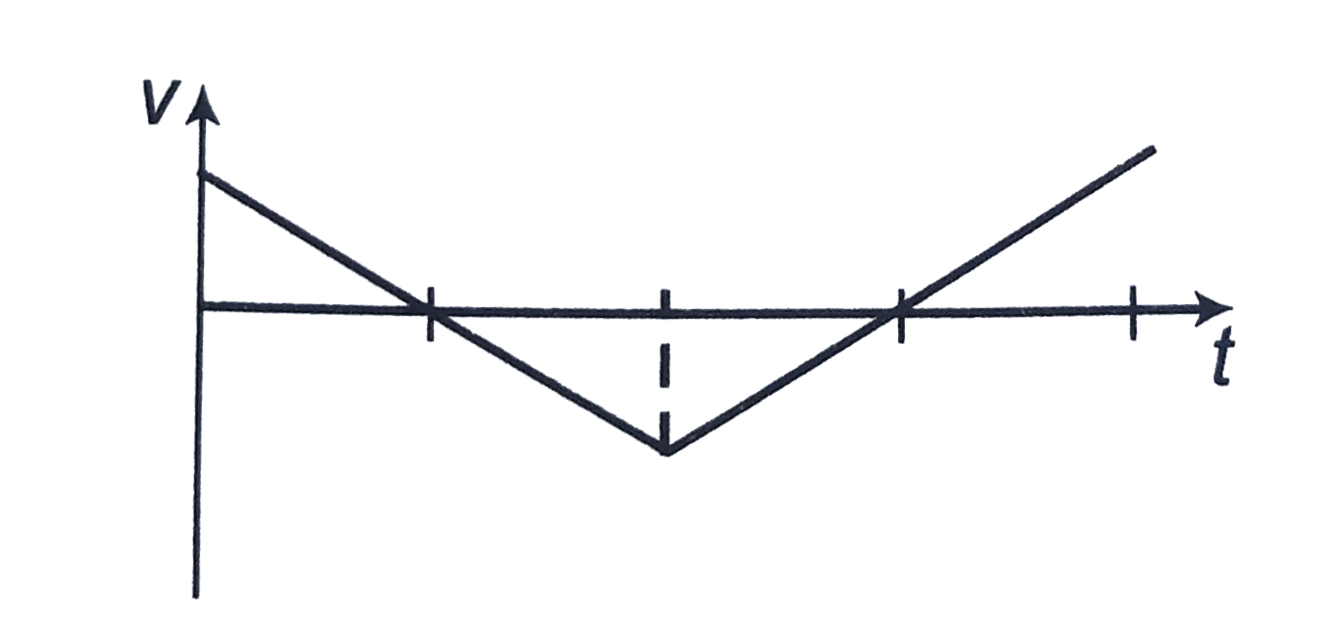
Which of the following graph represents the corresponding acceleration v//s time graph?
View Solution


