For the displacement-time graph shown in figure, the ratio of the magnitudes of the speeds during the first two second and the next four second is
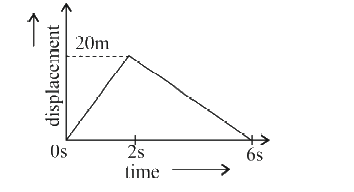
1:1
2:1
1:2
3:2
The correct Answer is:B
Step by step video solution for For the displacement-time graph shown in figure, the ratio of the magnitudes of the speeds during the first two second and the next four second is by Physics experts to help you in doubts & scoring excellent marks in Class 11 exams.
Updated on:21/07/2023Similar Questions
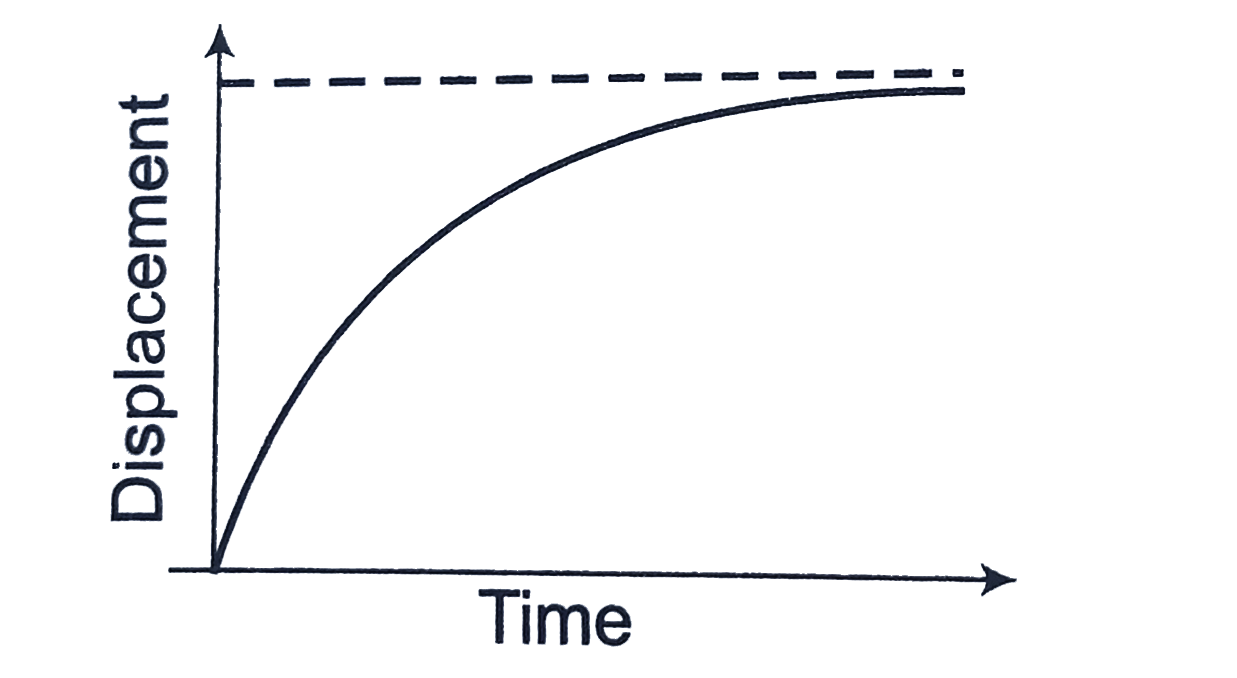
The displacement-time graph of a particle is as shown below. It indicates that
View SolutionWhat will be ratio of speed in first two seconds to the speed in next 4s

View SolutionFrom the velocity time plot shown in figure find the distance travelled by the particle dureing the first 40 seconds. Also find the average velocity during this period.

View SolutionA particle has a velocity u towards east at t=0. Its acceleration is towards west and is constant. Let xA and xB be the magnitude of displacements in the first 10 seconds and the next 10 seconds
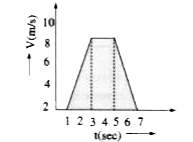
View SolutionFor the velocity - time graph shown in figure below the distance covered by the body in last two seconds of its motion is what fraction of the total distance covered by it in all the total distance covered by it in all the seven seconds
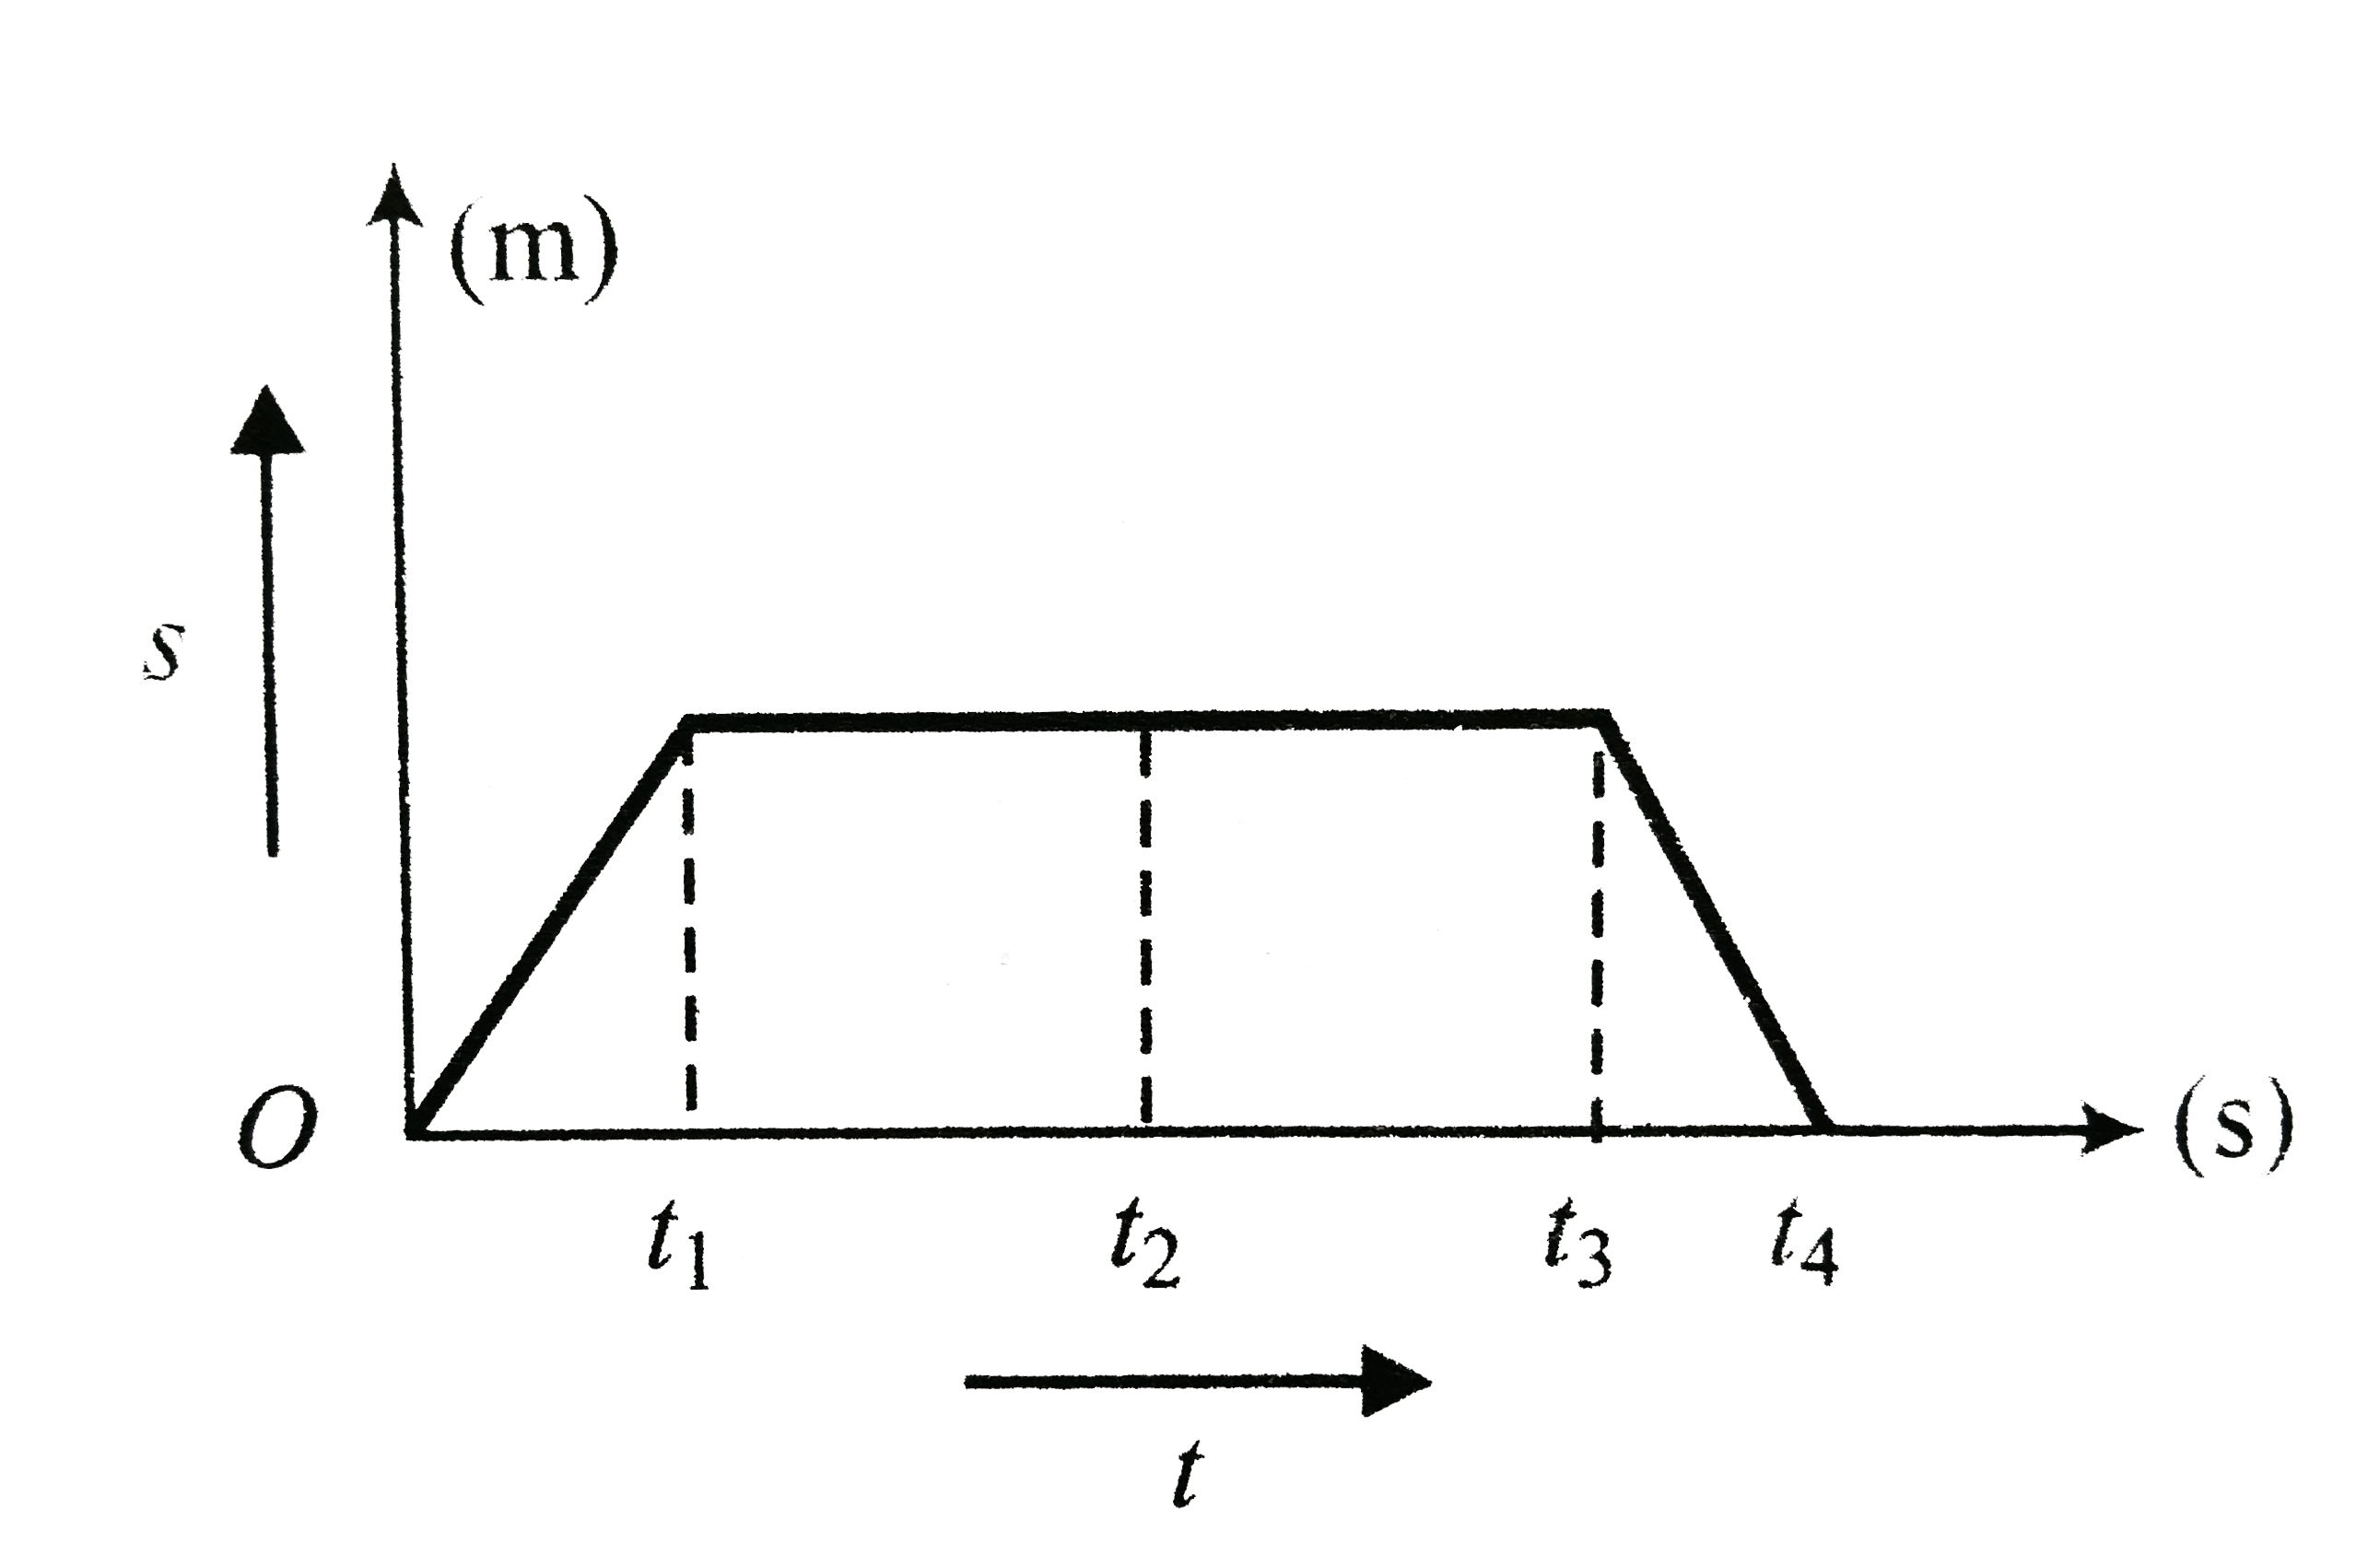
View SolutionThe displacement-time graph of a body is shown in.
 .
.
The velocity-time graph of the motion of the body will be .
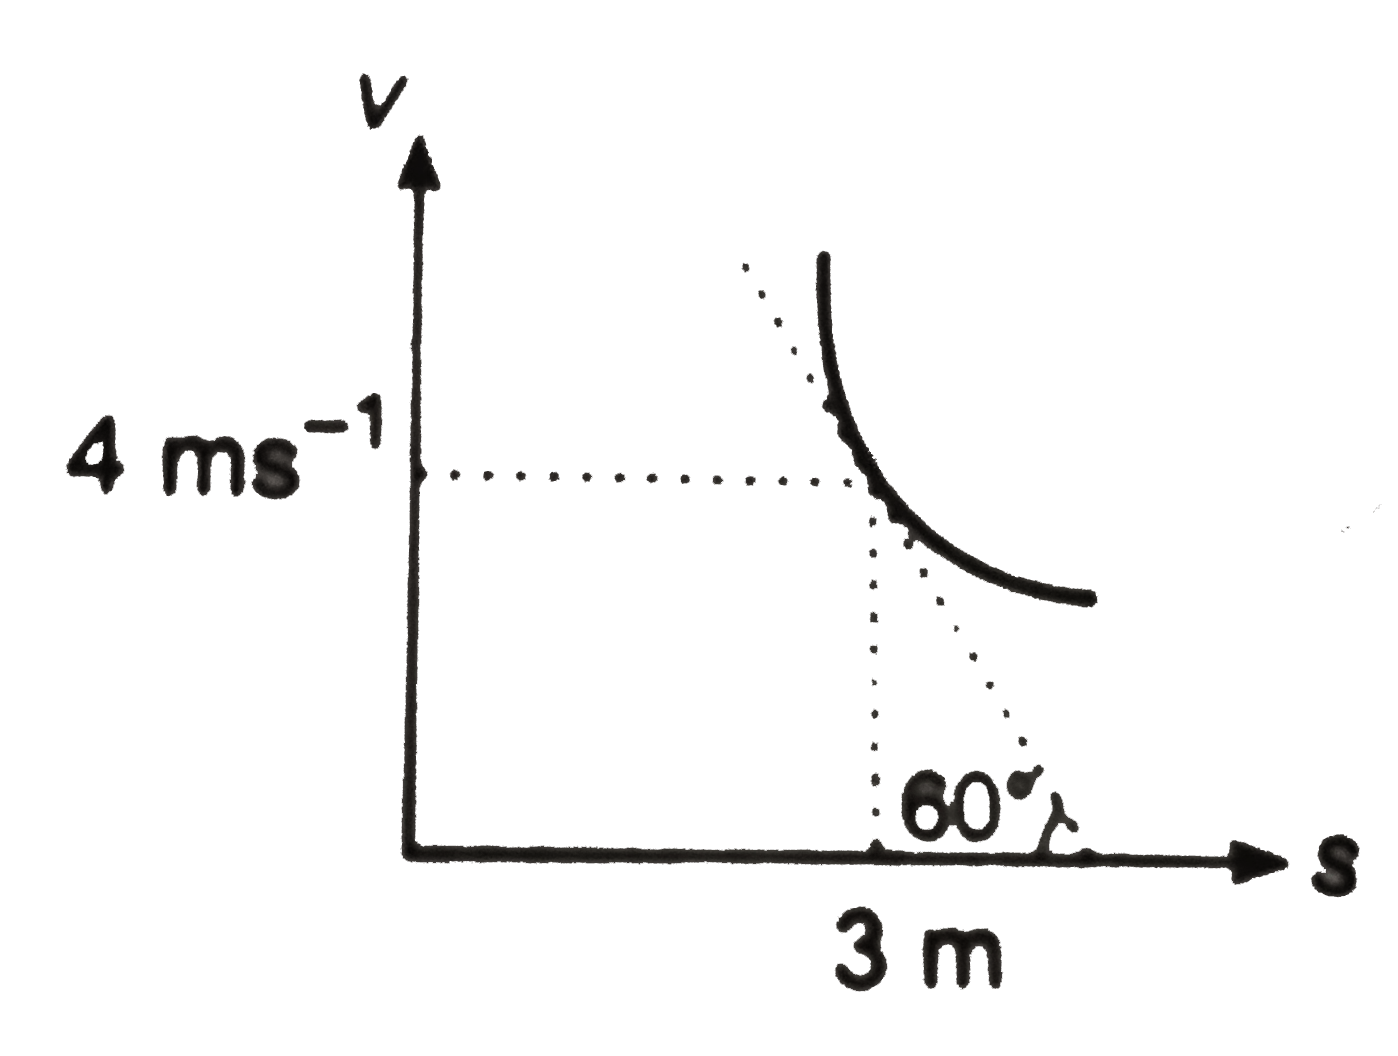
View SolutionA partial along a straight line whose velocity-displacement graph is as shown in the figure. What is the magnitude of acceleration when displacement is 3 m ?
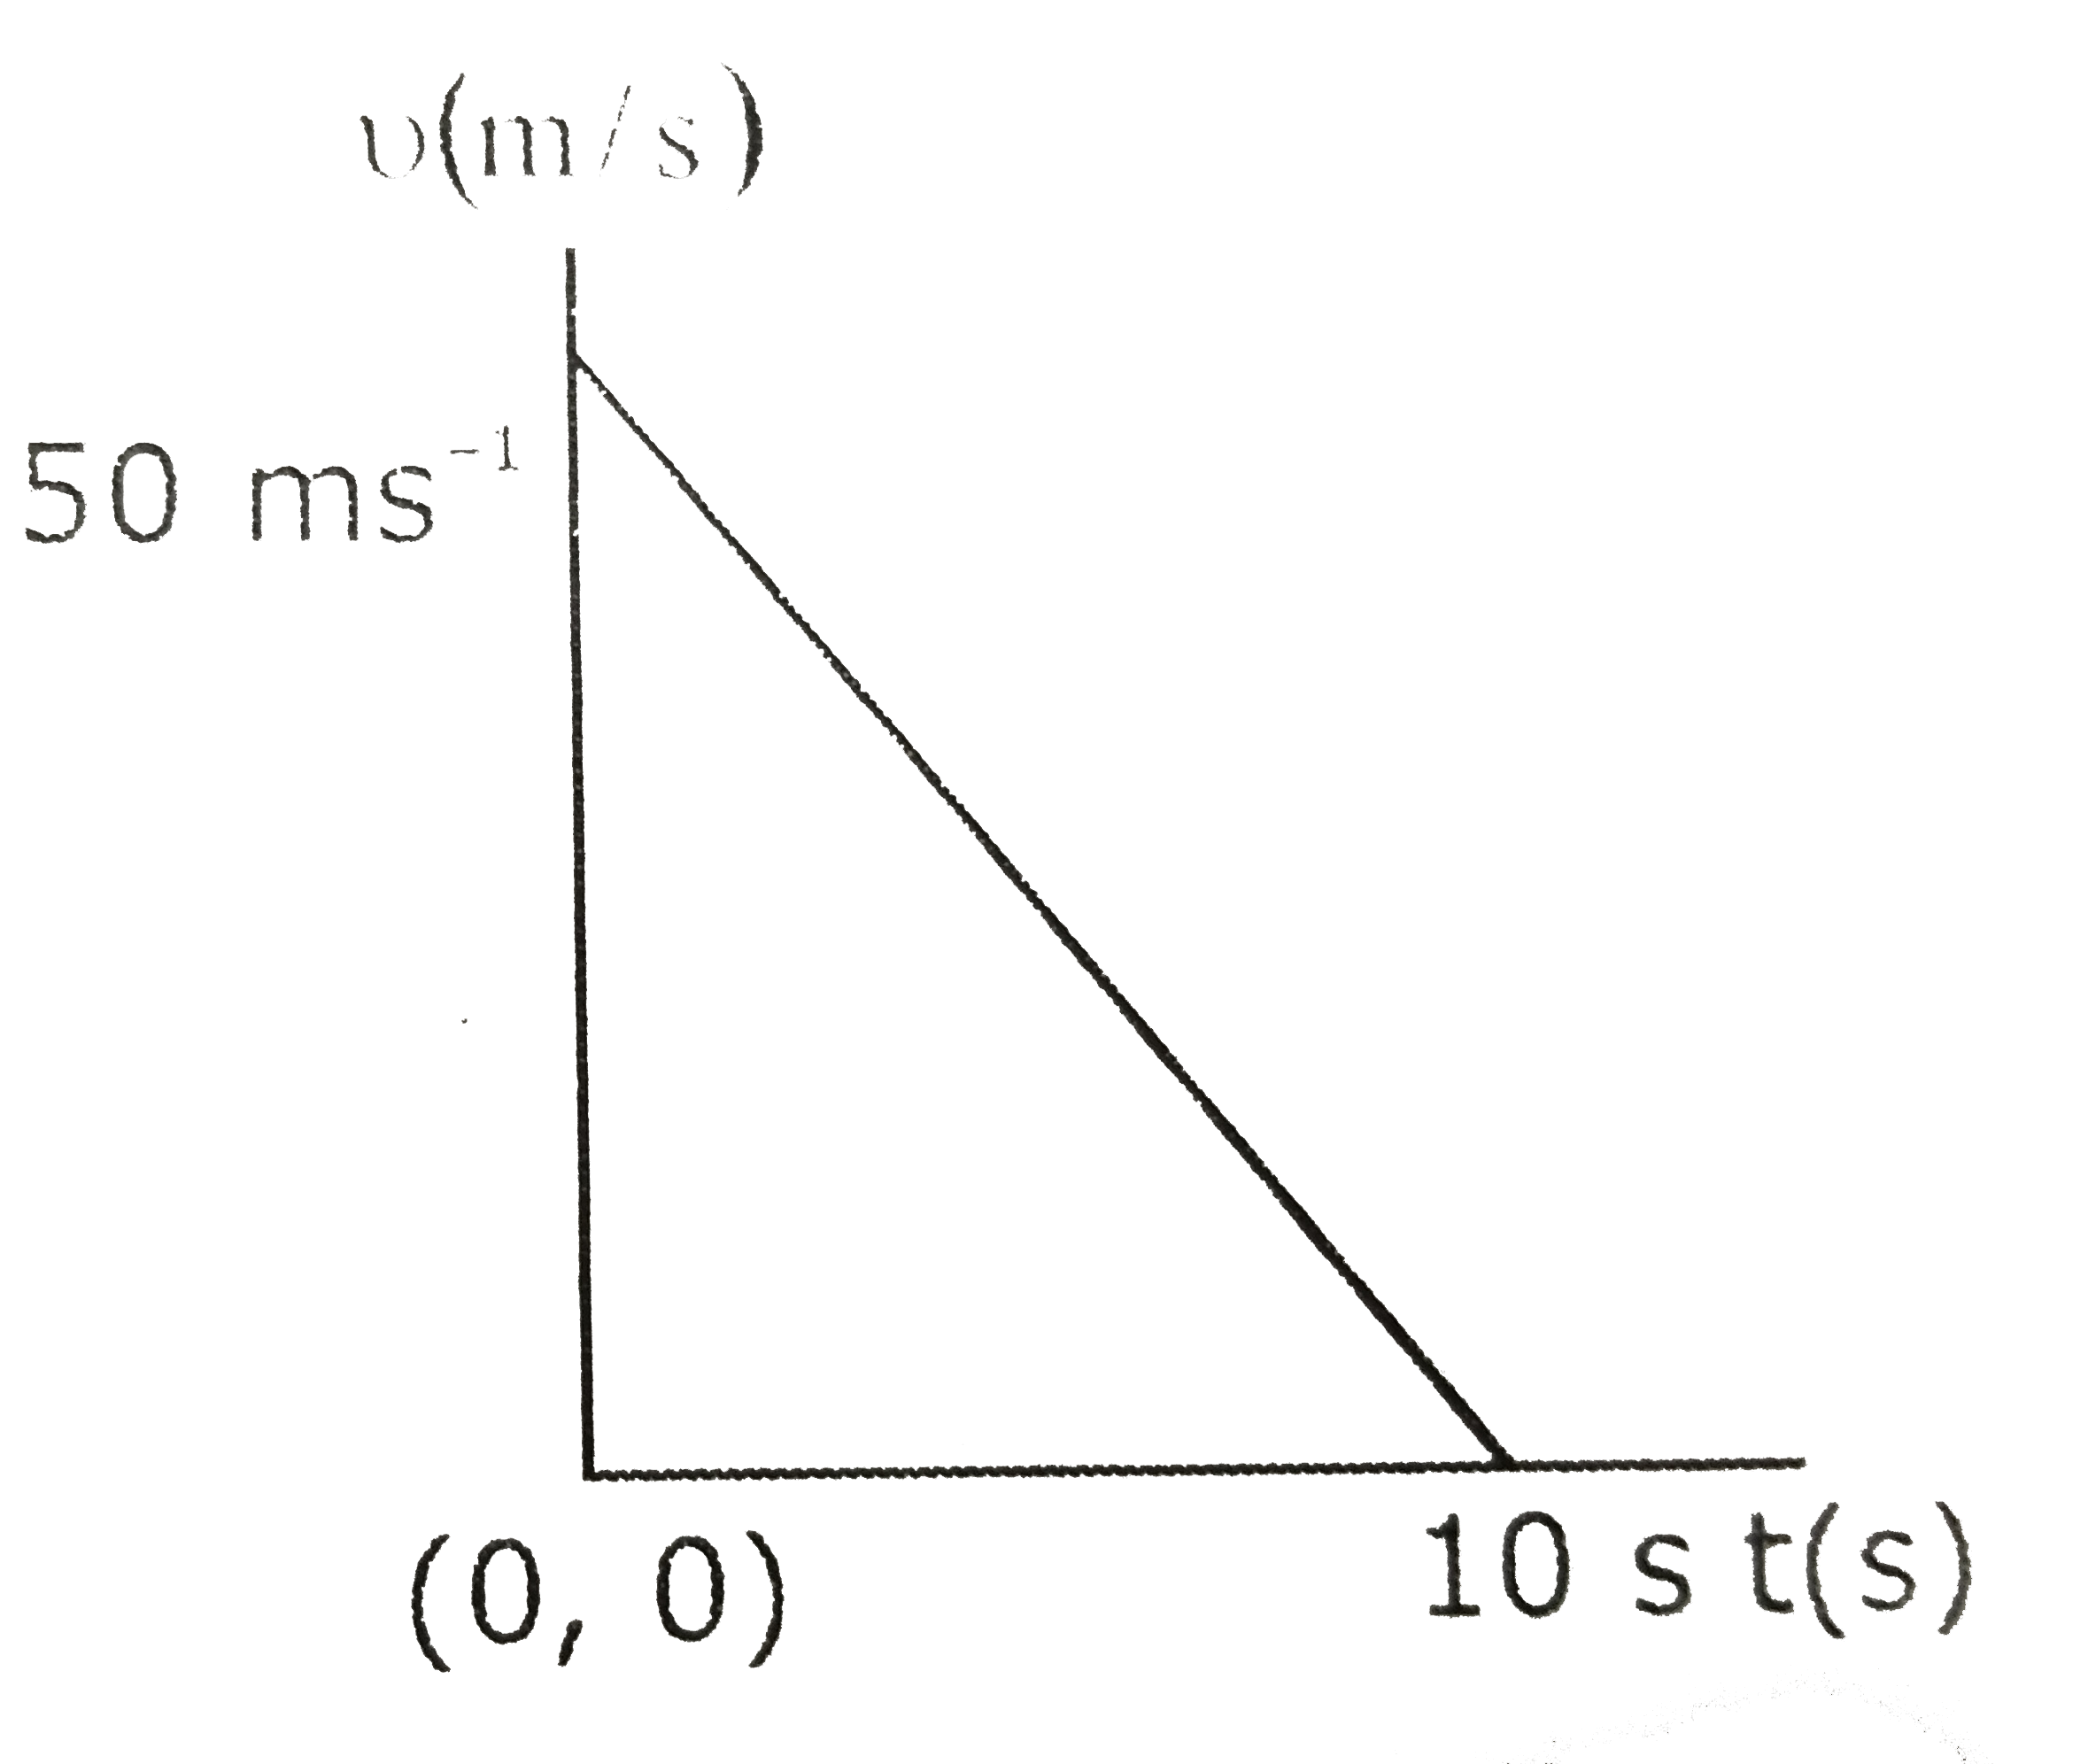
View SolutionVelocity -time graph for a body of mass 10 kg is shown in figure. Work -done on the body in first two seconds of the motion is :
View SolutionA particle has a velocity u towards east at t=0. Its acceleration is towards west and is constant. Let xA and xB be the magnitude of displacement in the first 10 seconds and the next 10 seconds:
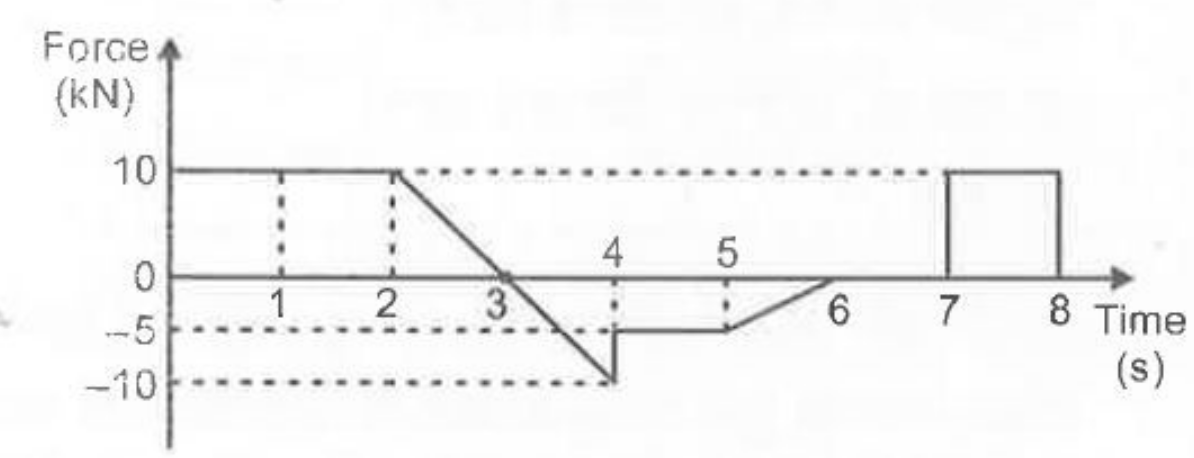
View SolutionThe force acting on a particle of mass 20 kg is indicated by force - time graph as shown in figure. The magnitude of change in linear momentum of particle during time interval 0 to 6 second is
View Solution