The velocity - time graph of an ascending passenger order lift is given in figure. What is the acceleration of the lift:
(i) during the first two seconds ,
(ii) between 2nd and 10th second,
(iii) during the last two seconds. .
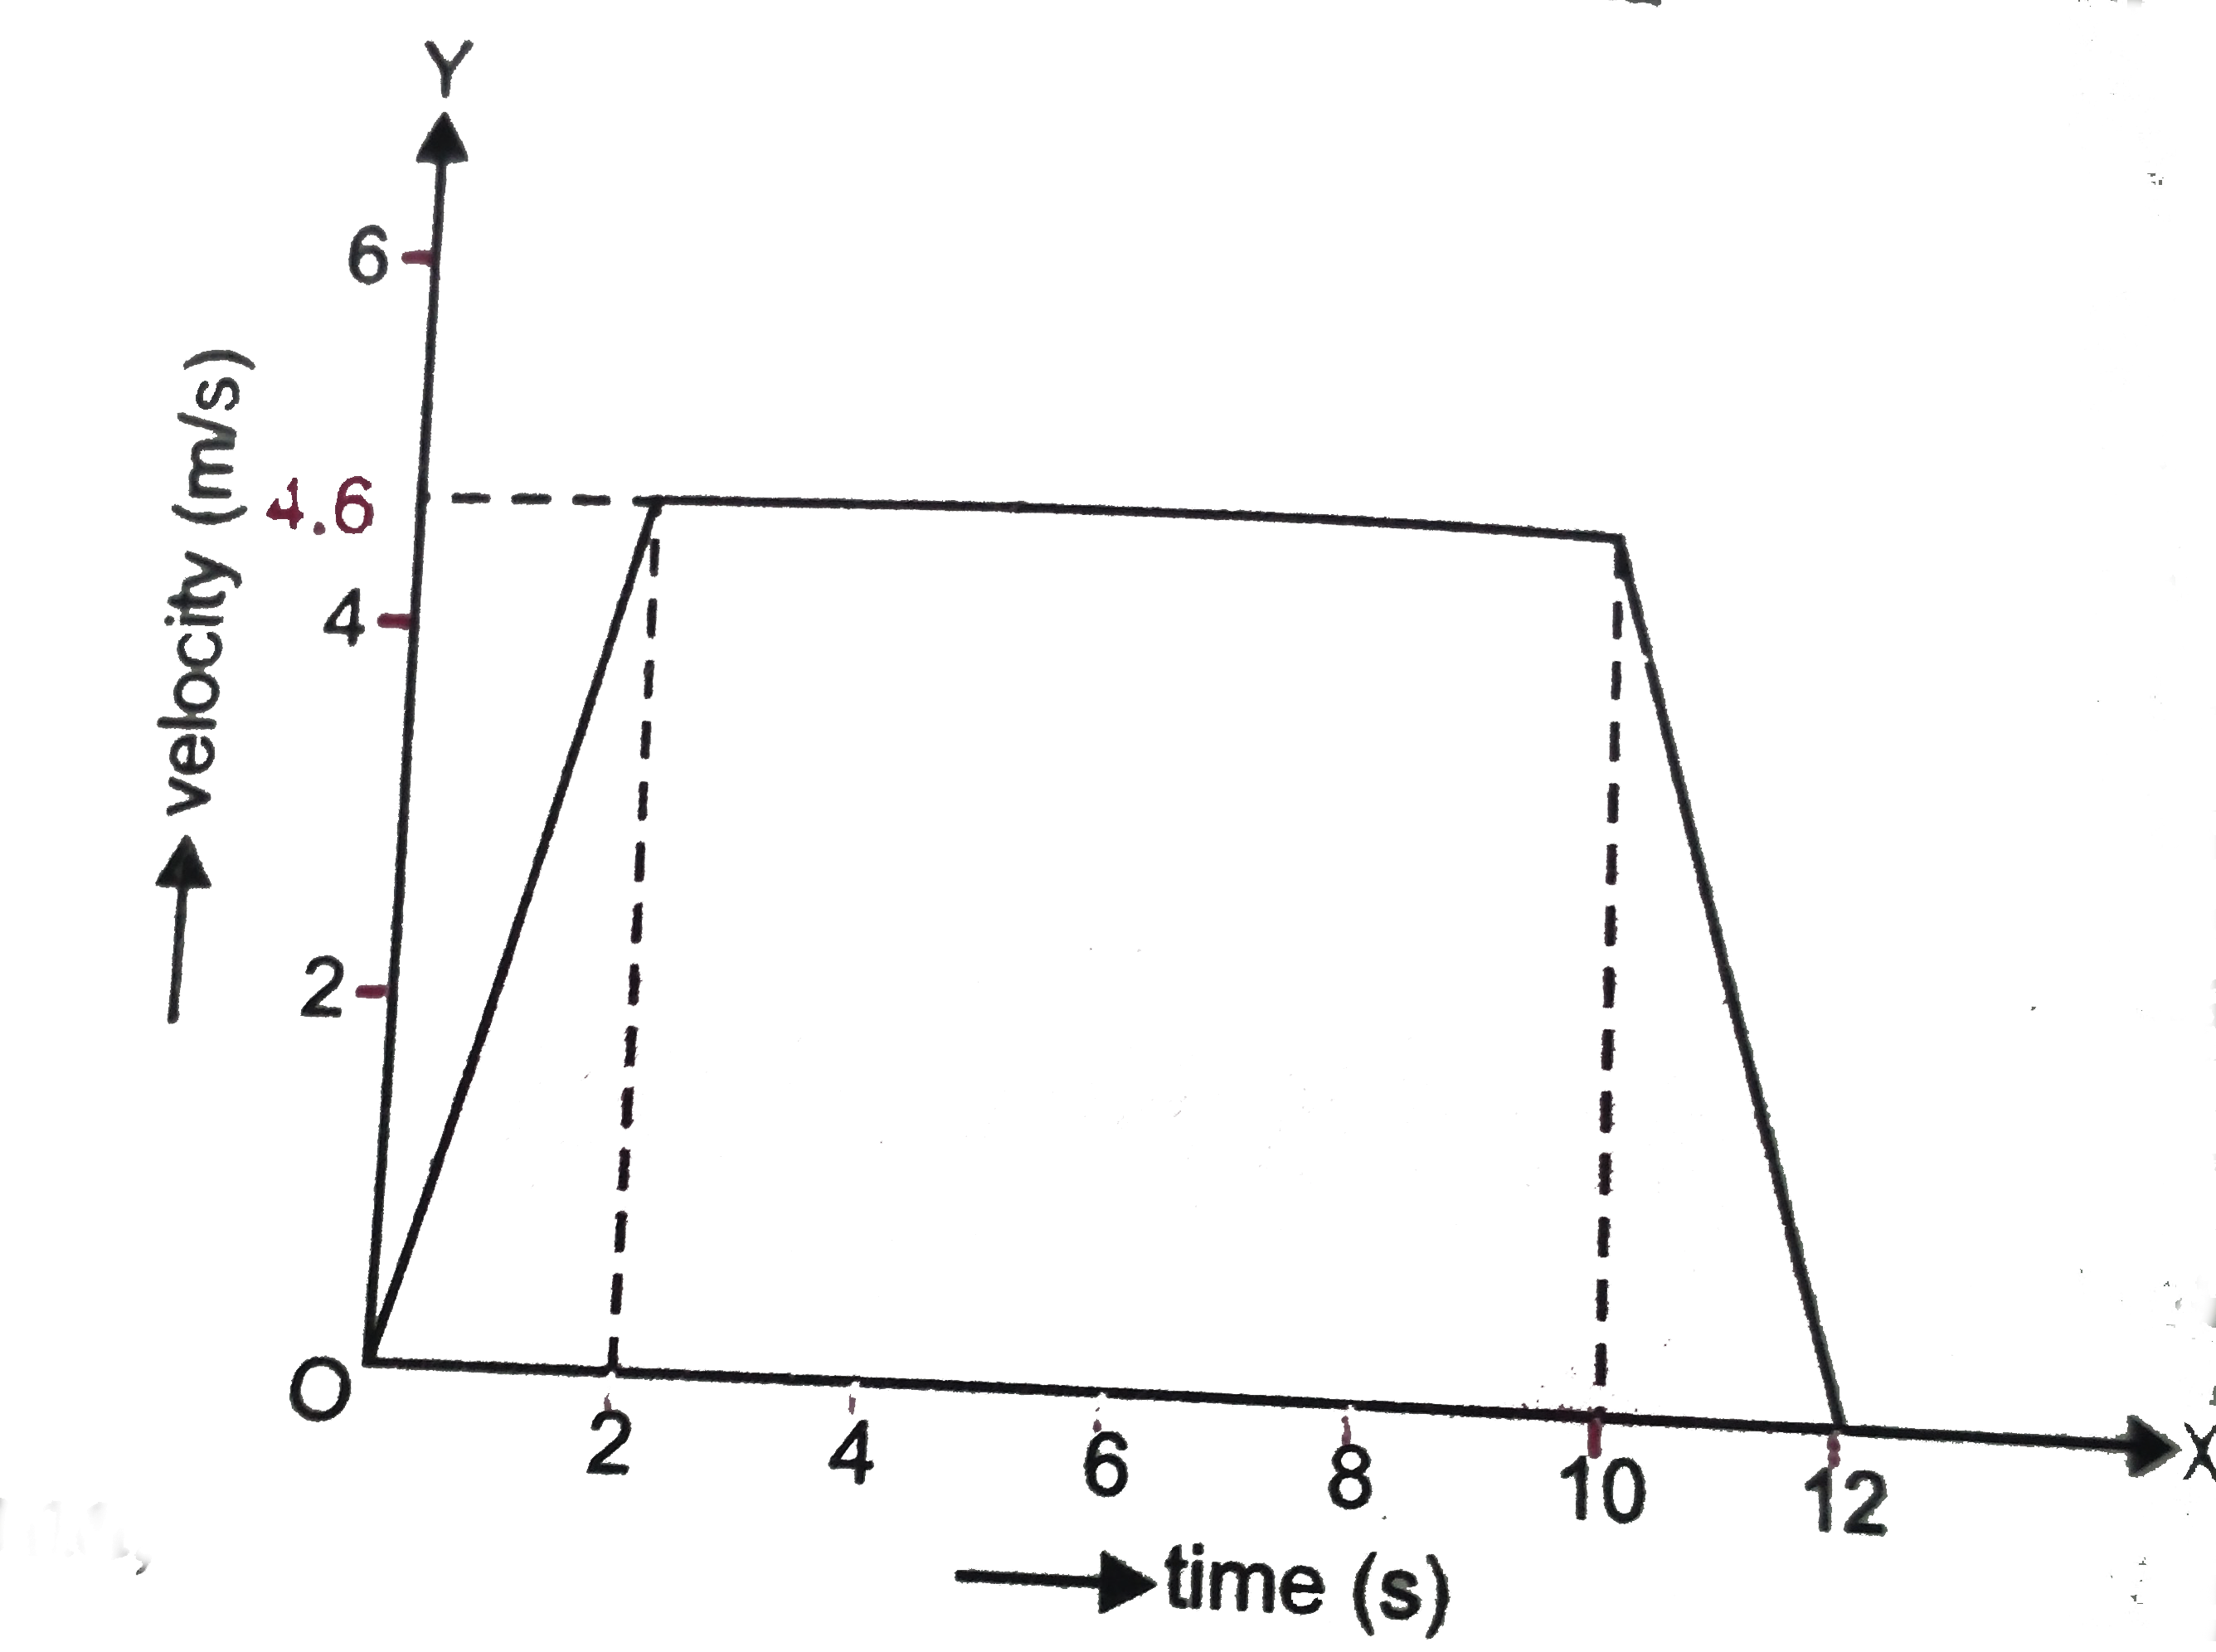
(i) For motion during the first two seconds ,
change of velocity =4.6−0=4.6m/s
time taken =2−0=2s
Thus , acceleration =change of velocitytime taken
=4.62=2.3m/s2
(ii) For motion between 2nd second and 10th second ,
change of velocity =4.6−4.6=zero
time taken =10−2=8s
Thus , acceleration =change of velocitytime taken=08=zero
(iii) For motion between 10th sec to 12th second , change of velocity =0−4.6=−4.6m/s
time taken =12−10=2s
Thus , acceleration =change of velocitytime taken=−4.62=−2.3m/s2
Negative sign shows retardation
Topper's Solved these Questions
- MOTIONBook:PRADEEPChapter:MOTIONExercise:NCERT queations
Explore 20 Videos
- MOTIONBook:PRADEEPChapter:MOTIONExercise:NCERT Exercises
Explore 10 Videos
- GRAVITATIONBook:PRADEEPChapter:GRAVITATIONExercise:Model Test paper (1)
Explore 36 Videos
- SOUNDBook:PRADEEPChapter:SOUNDExercise:Model Test (sec - B)
Explore 12 Videos
Similar Questions
The velocity - time graph of an ascending passenger order lift is given in figure. What is the acceleration of the lift:
(i) during the first two seconds ,
(ii) between 2nd and 10th second,
(iii) during the last two seconds. .

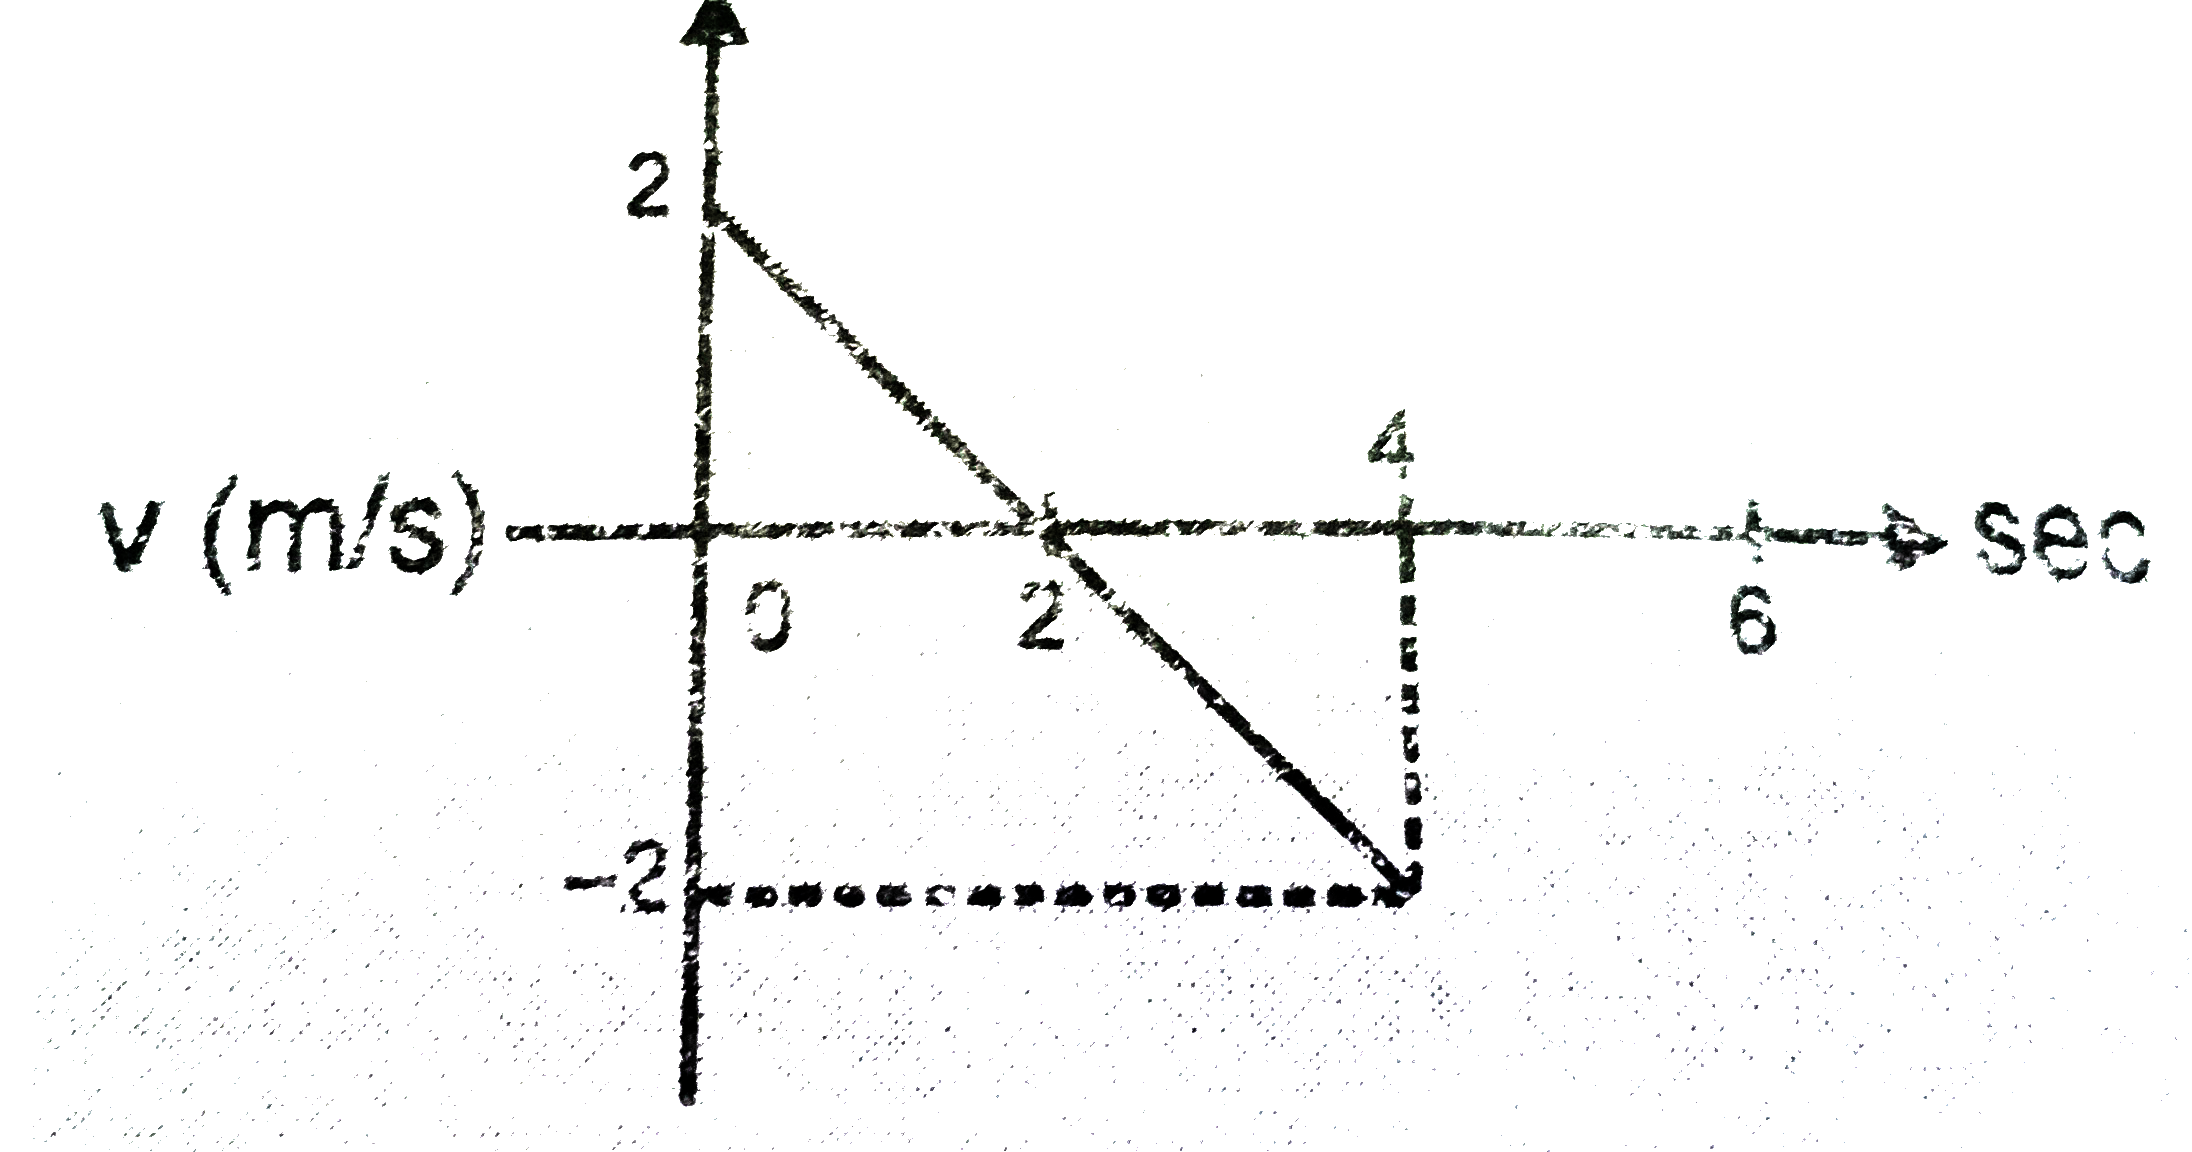
View SolutionVelocity time graph for a particle moving in a line is given.
Calculate the displacement of the particle and distance travelled in first 4 seconds.
View Solution
Knowledge Check
The velocity - time graph of a particle of mass 10 kg is shown in the figure. The net work done on the particle in the first two seconds of the motion is
 A−9300JB12000JC−4500JD−12000J
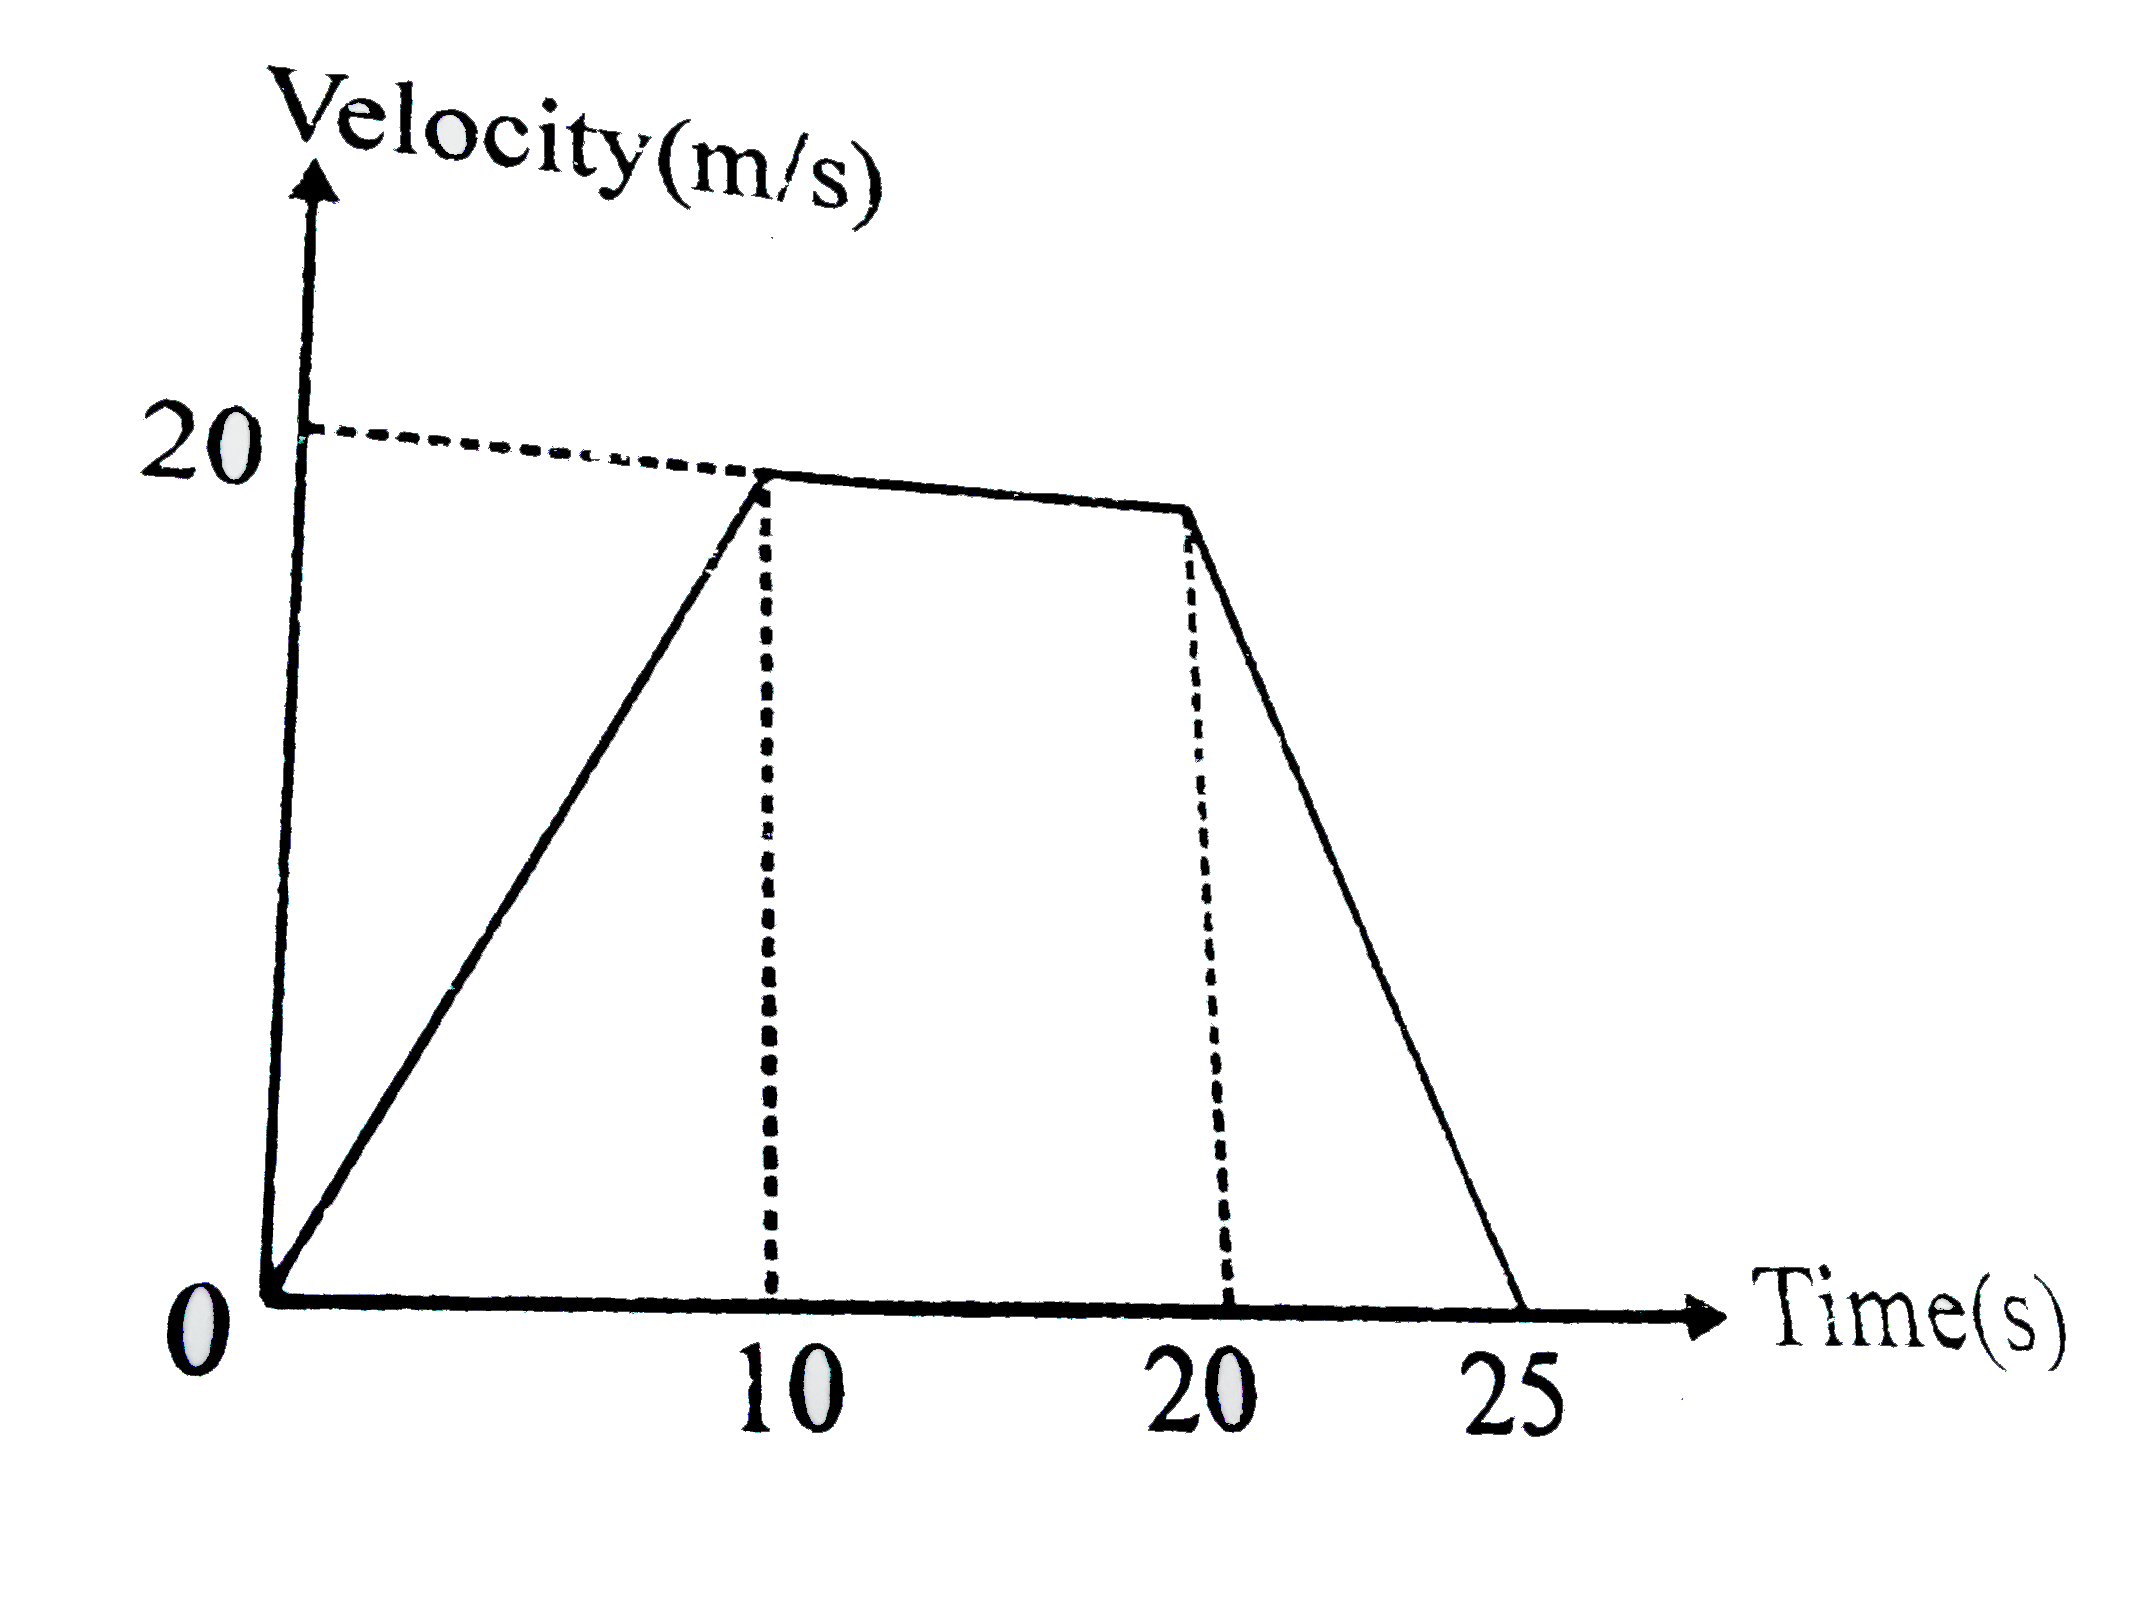
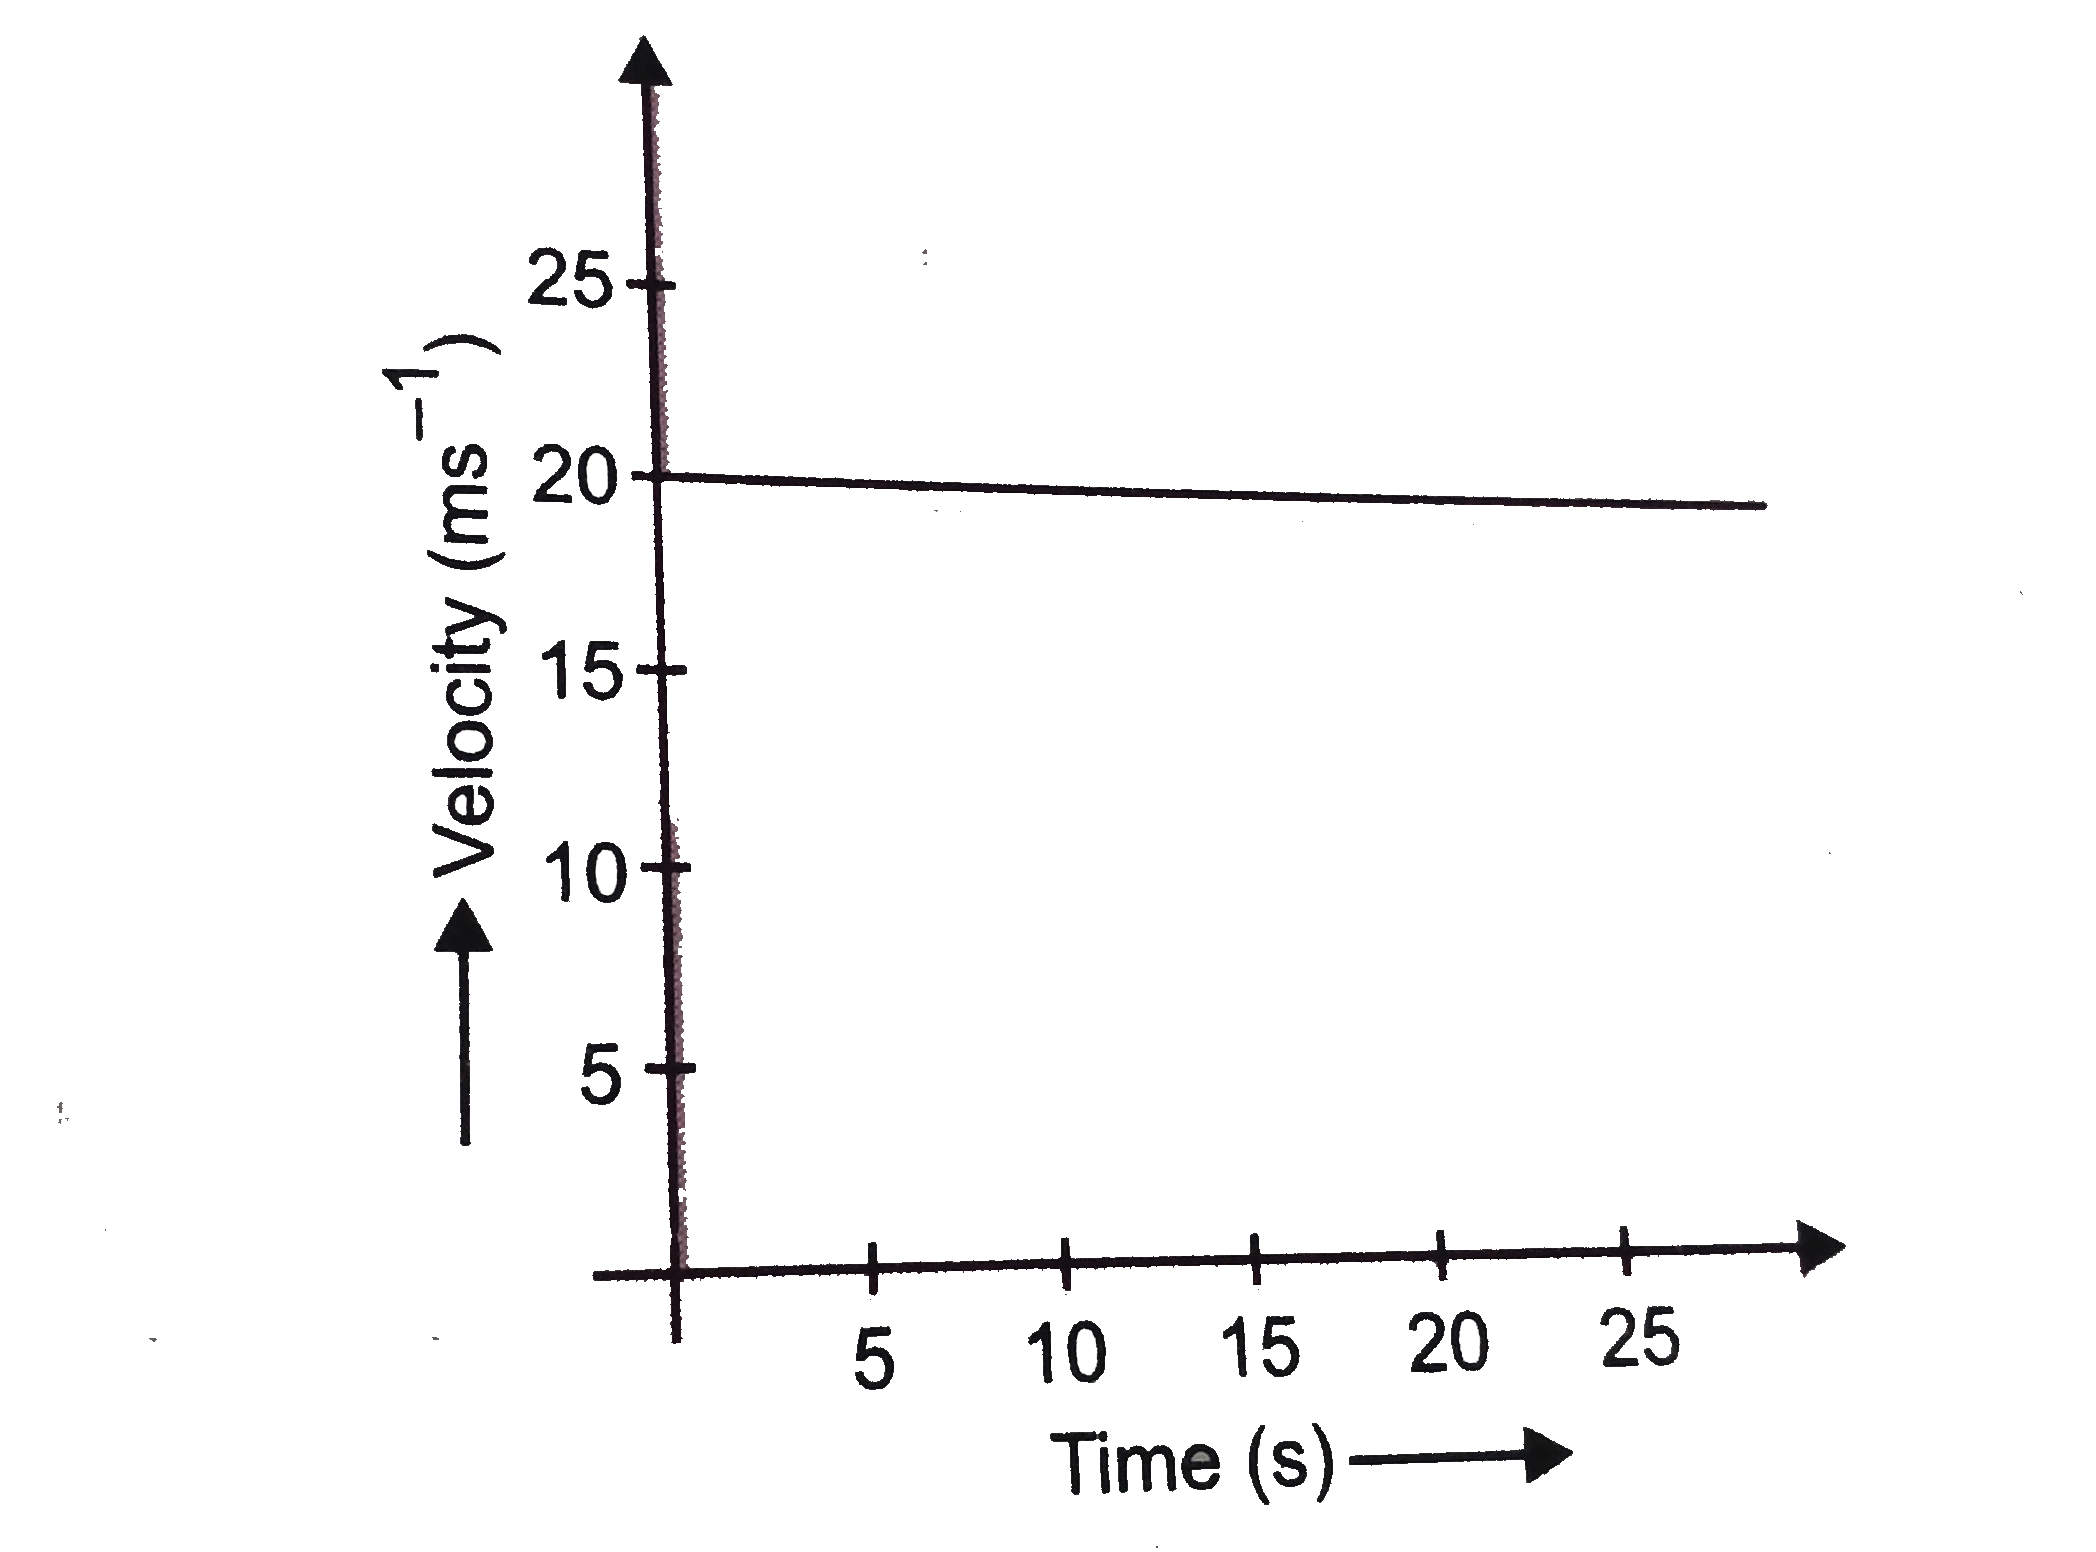
The velocity-time graph of a car moving along a straight road is shown in figure. The average velocity of the car in first 25 seconds is
 A20m/sB14m/sC10m/sD17.5m/s
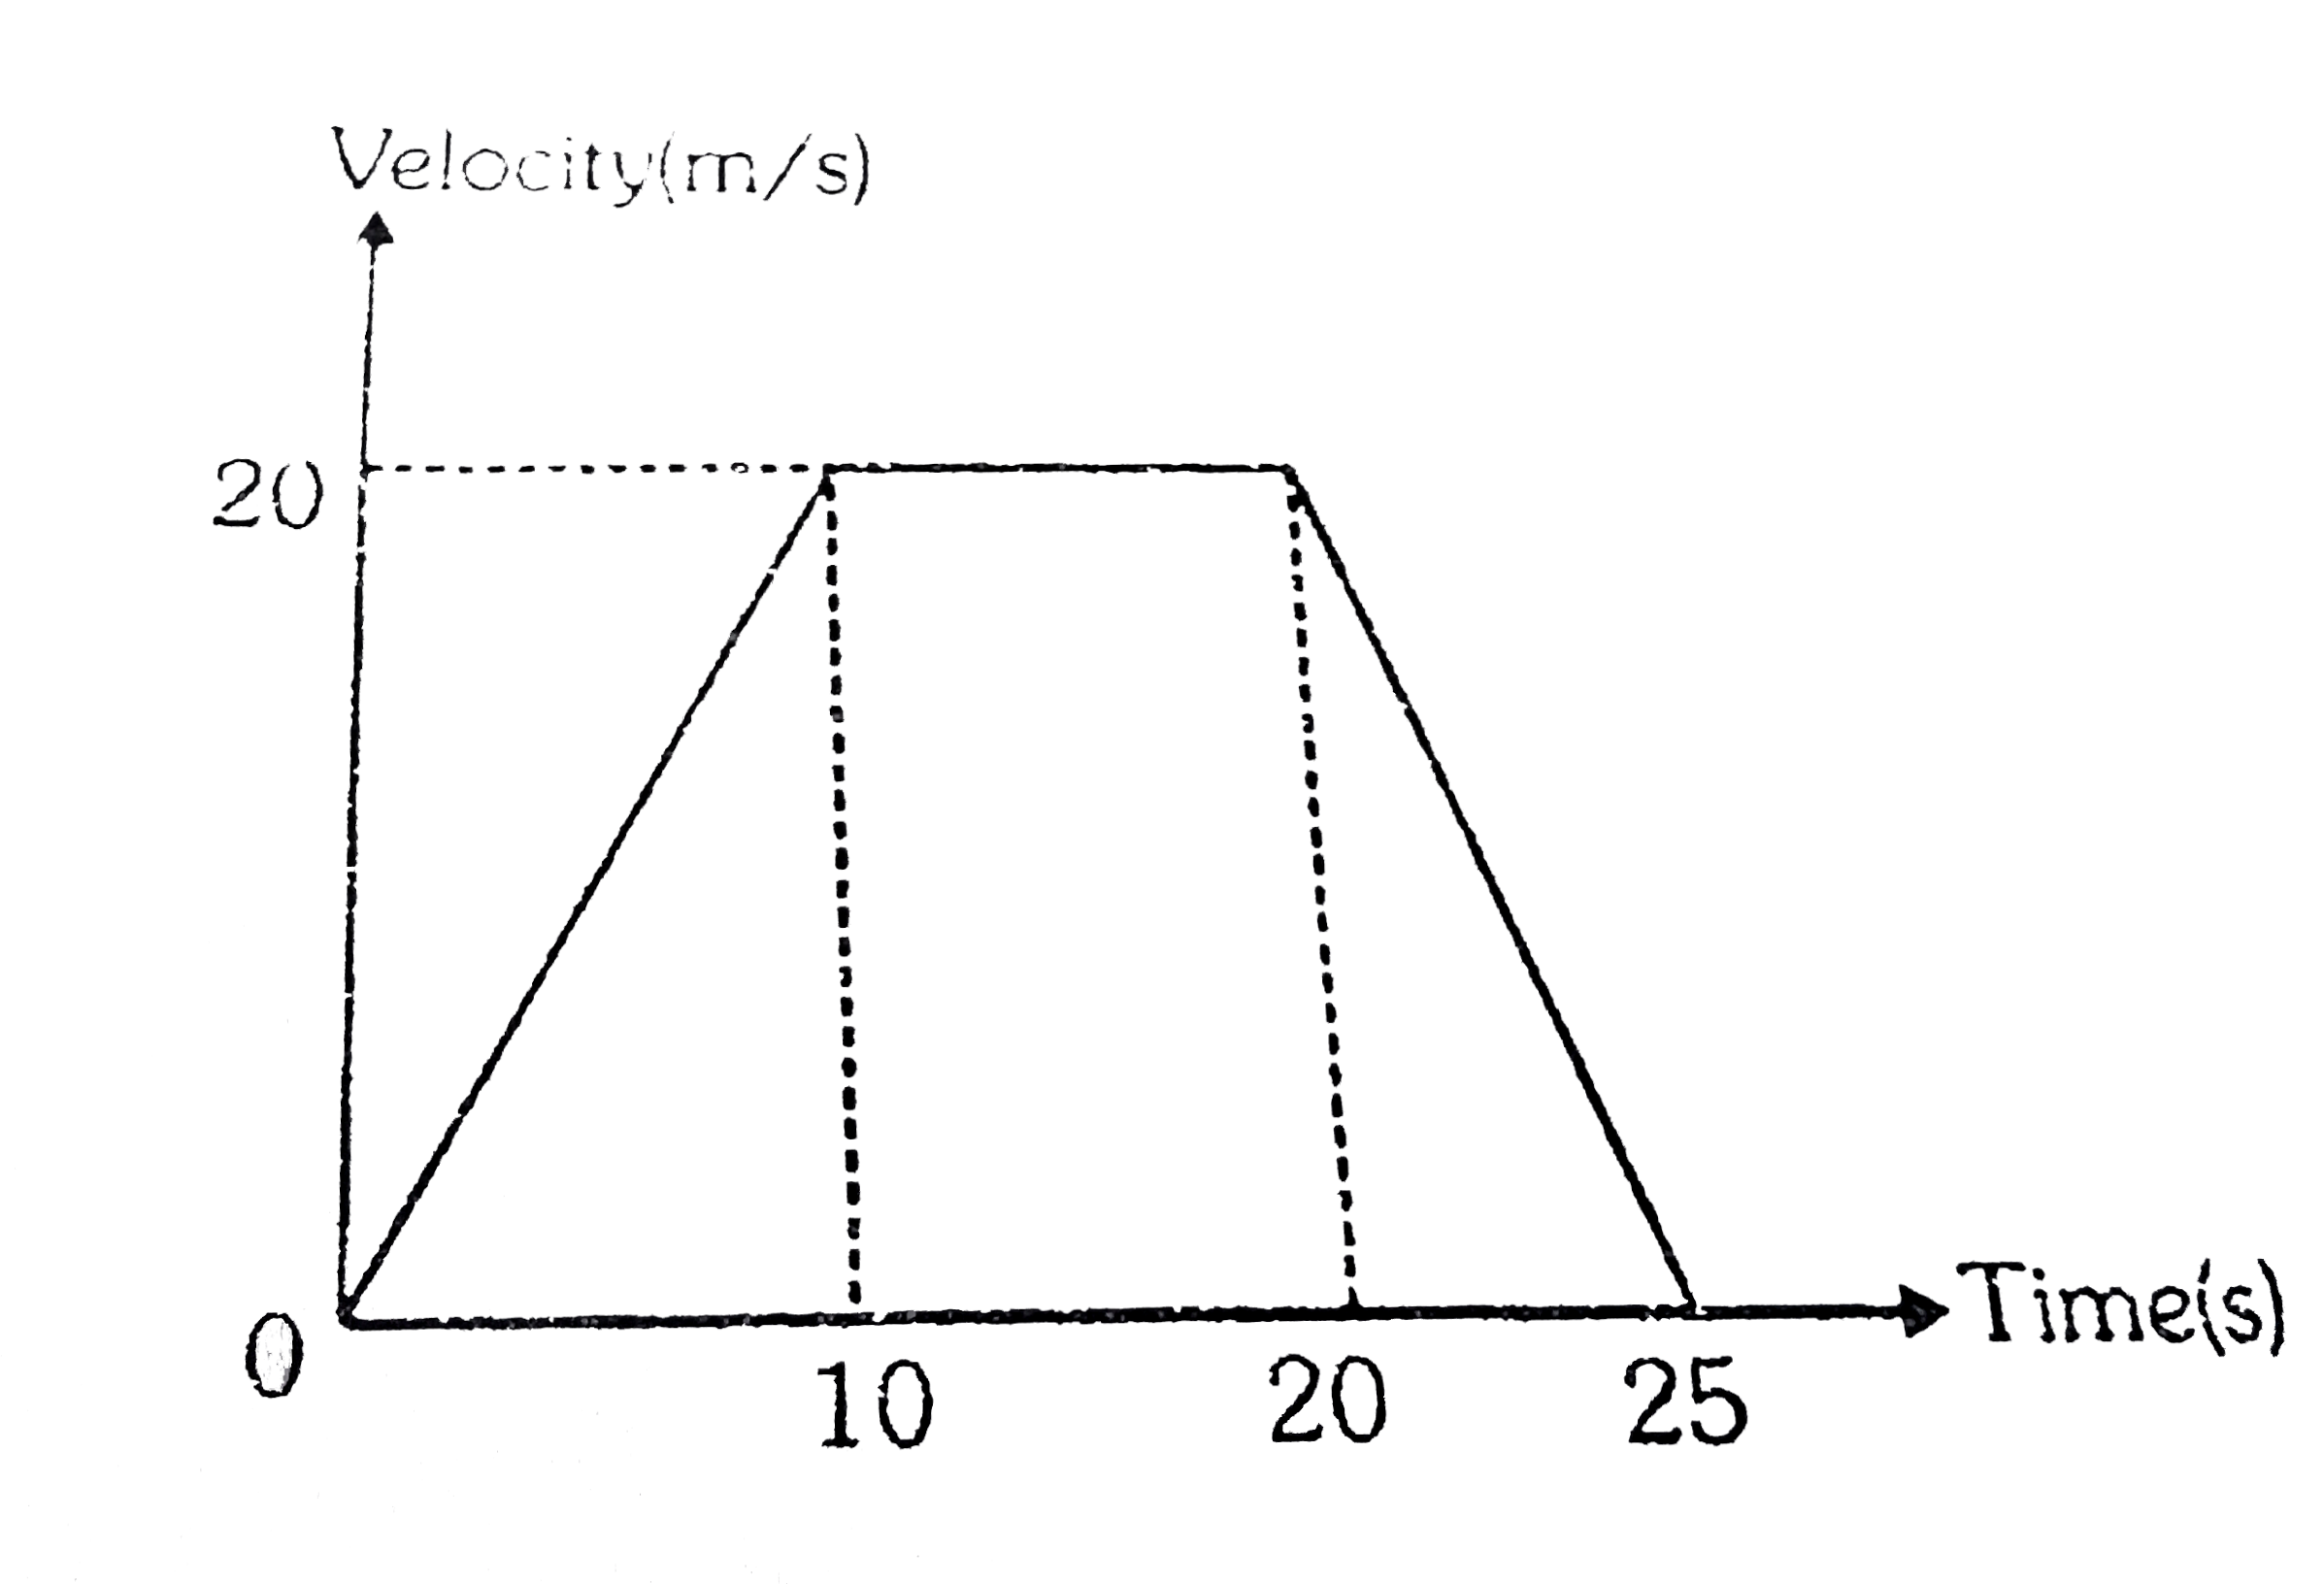
The velocity-time graph of a car moving along a straight road is shown in figure. The average velocity of the car is first 25 seconds is
 A20m/sB14m/sC10m/sD17.5m/s
The velocity-time graph of a particle moving along a straight line is shown in the figure-given below
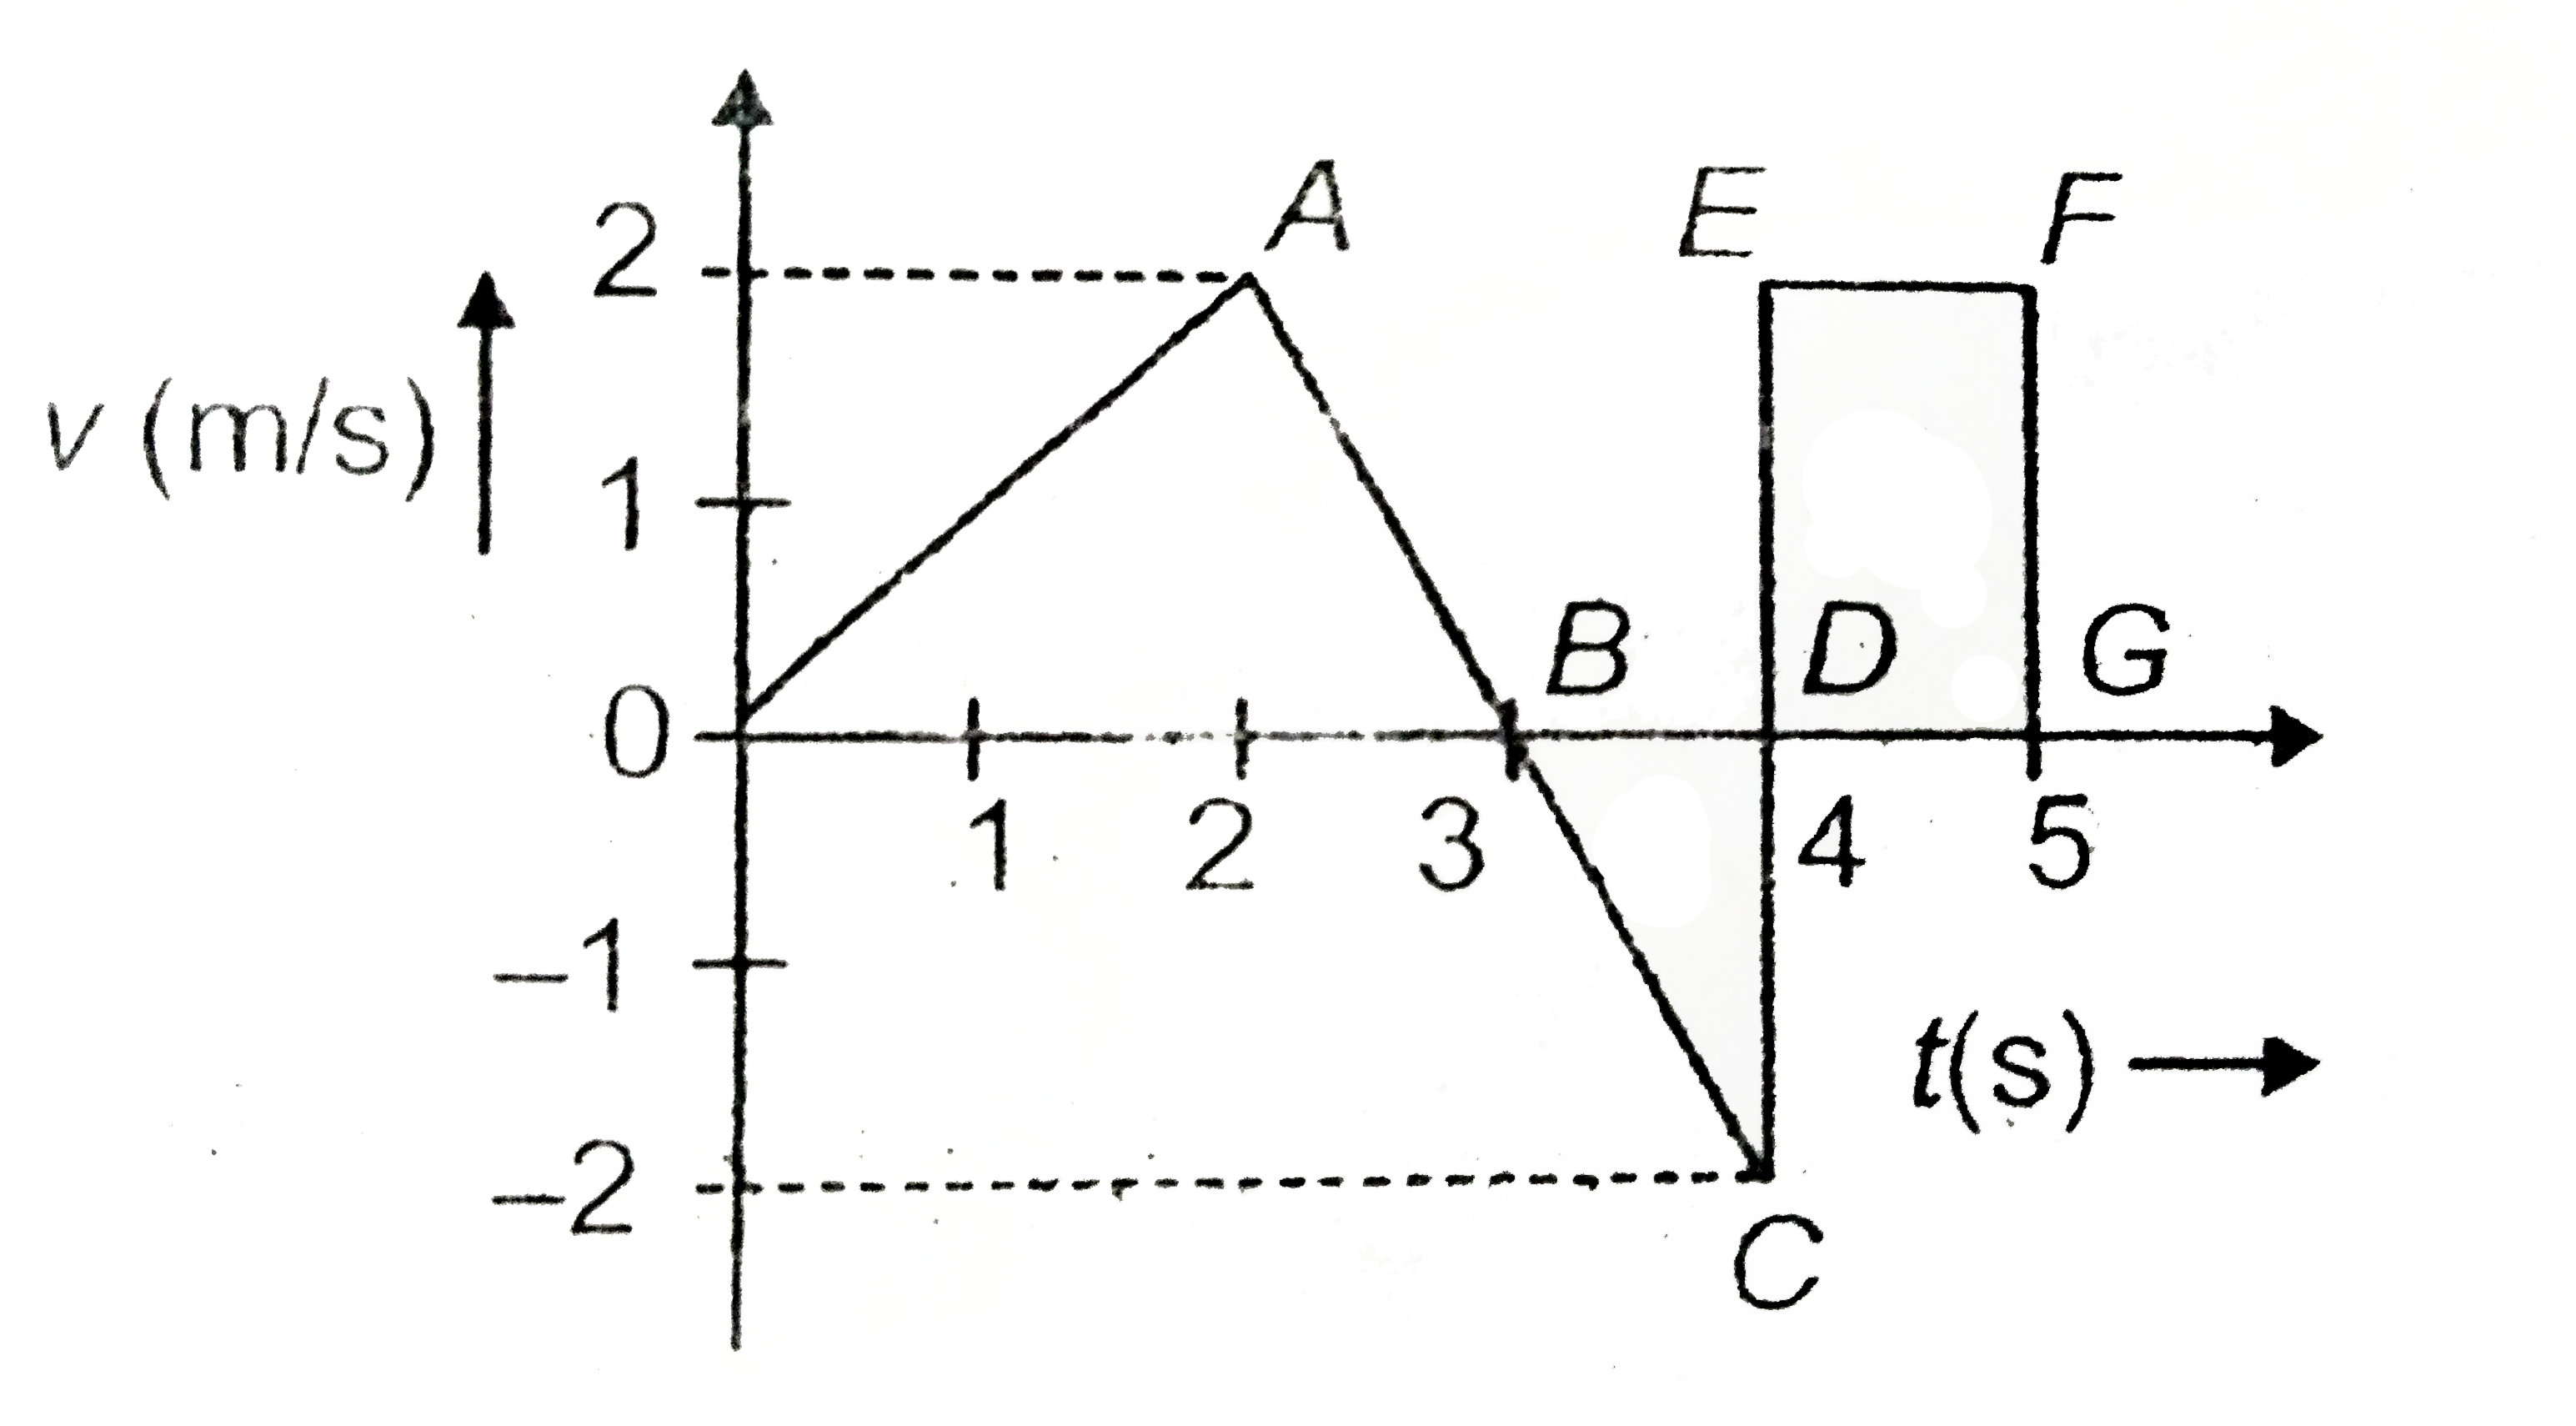
The displacement of the particle in 5 second is
View SolutionThe velocity-time graph shows the motion of a cyclist. Find (i) its acceleration (ii) its velocity and (iii) the distance covered by the cyclist in 15 seconds.
View SolutionThe velocity - time graph of a particle moving along a straight line is shown in the figure given below
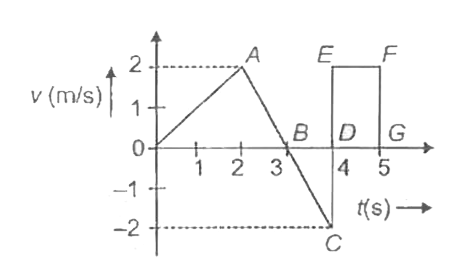
The displacement of the particle in 5 second is
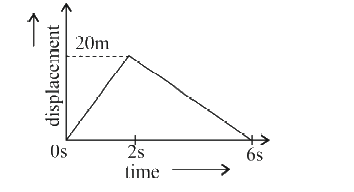
View SolutionFor the displacement time graph shown in figure -1.100, the ratio of the speeds during the first two seconds and the next four second is :
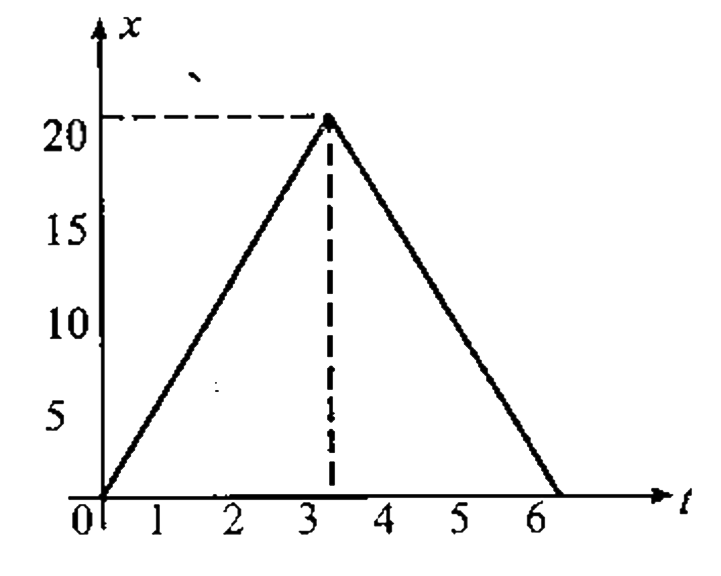
View SolutionFor the displacement-time graph shown in figure, the ratio of the magnitudes of the speeds during the first two second and the next four second is
View Solution

