(a) The velocity time graph of two bodies are shown in Figure. Slope of the graph for body A is positive. What does it signify ?
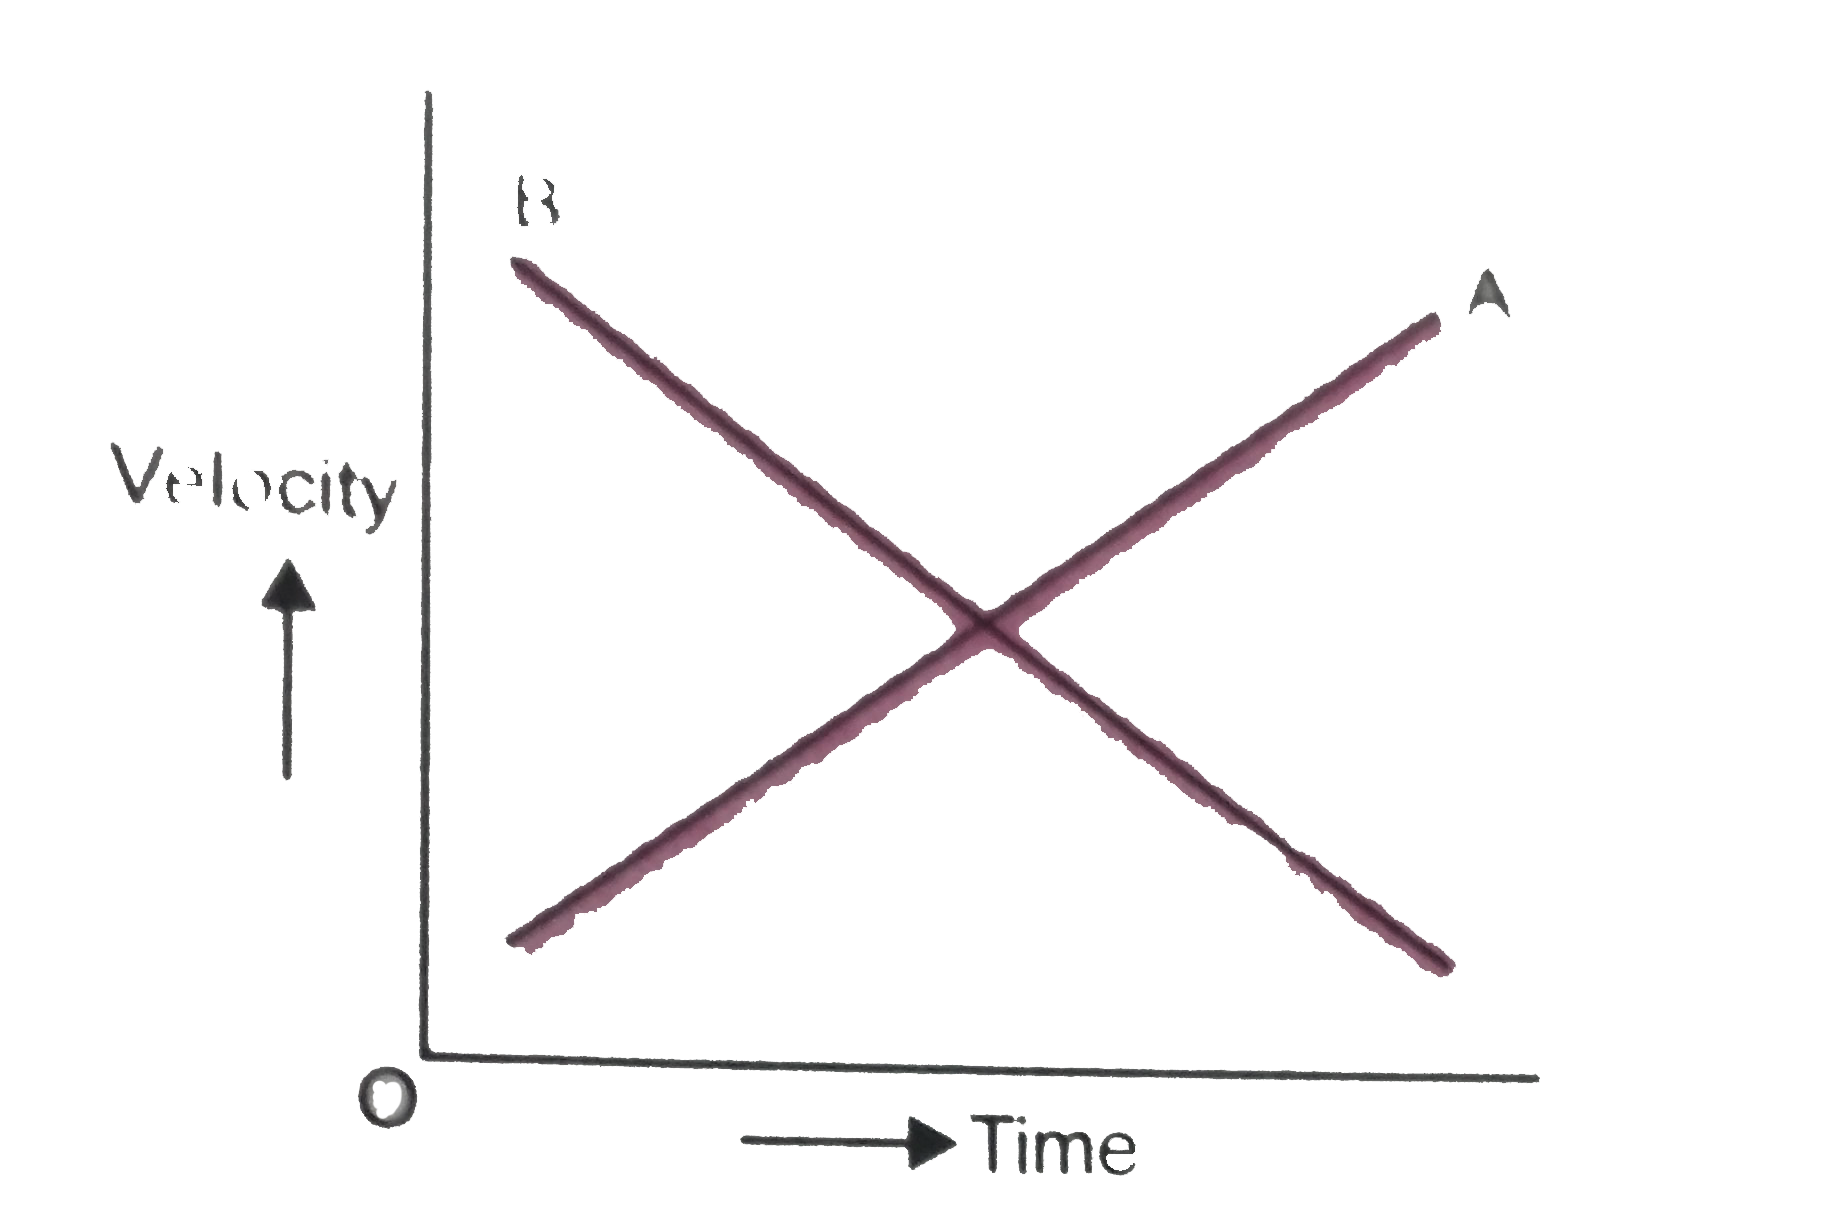
(b) The slope of velocity time graph of body B is negative. What does it represent ?
Step by step video, text & image solution for (a) The velocity time graph of two bodies are shown in Figure. Slope of the graph for body A is positive. What does it signify ? (b) The slope of velocity time graph of body B is negative. What does it represent ? by Physics experts to help you in doubts & scoring excellent marks in Class 9 exams.
Updated on:21/07/2023Topper's Solved these Questions
Similar Questions
Knowledge Check
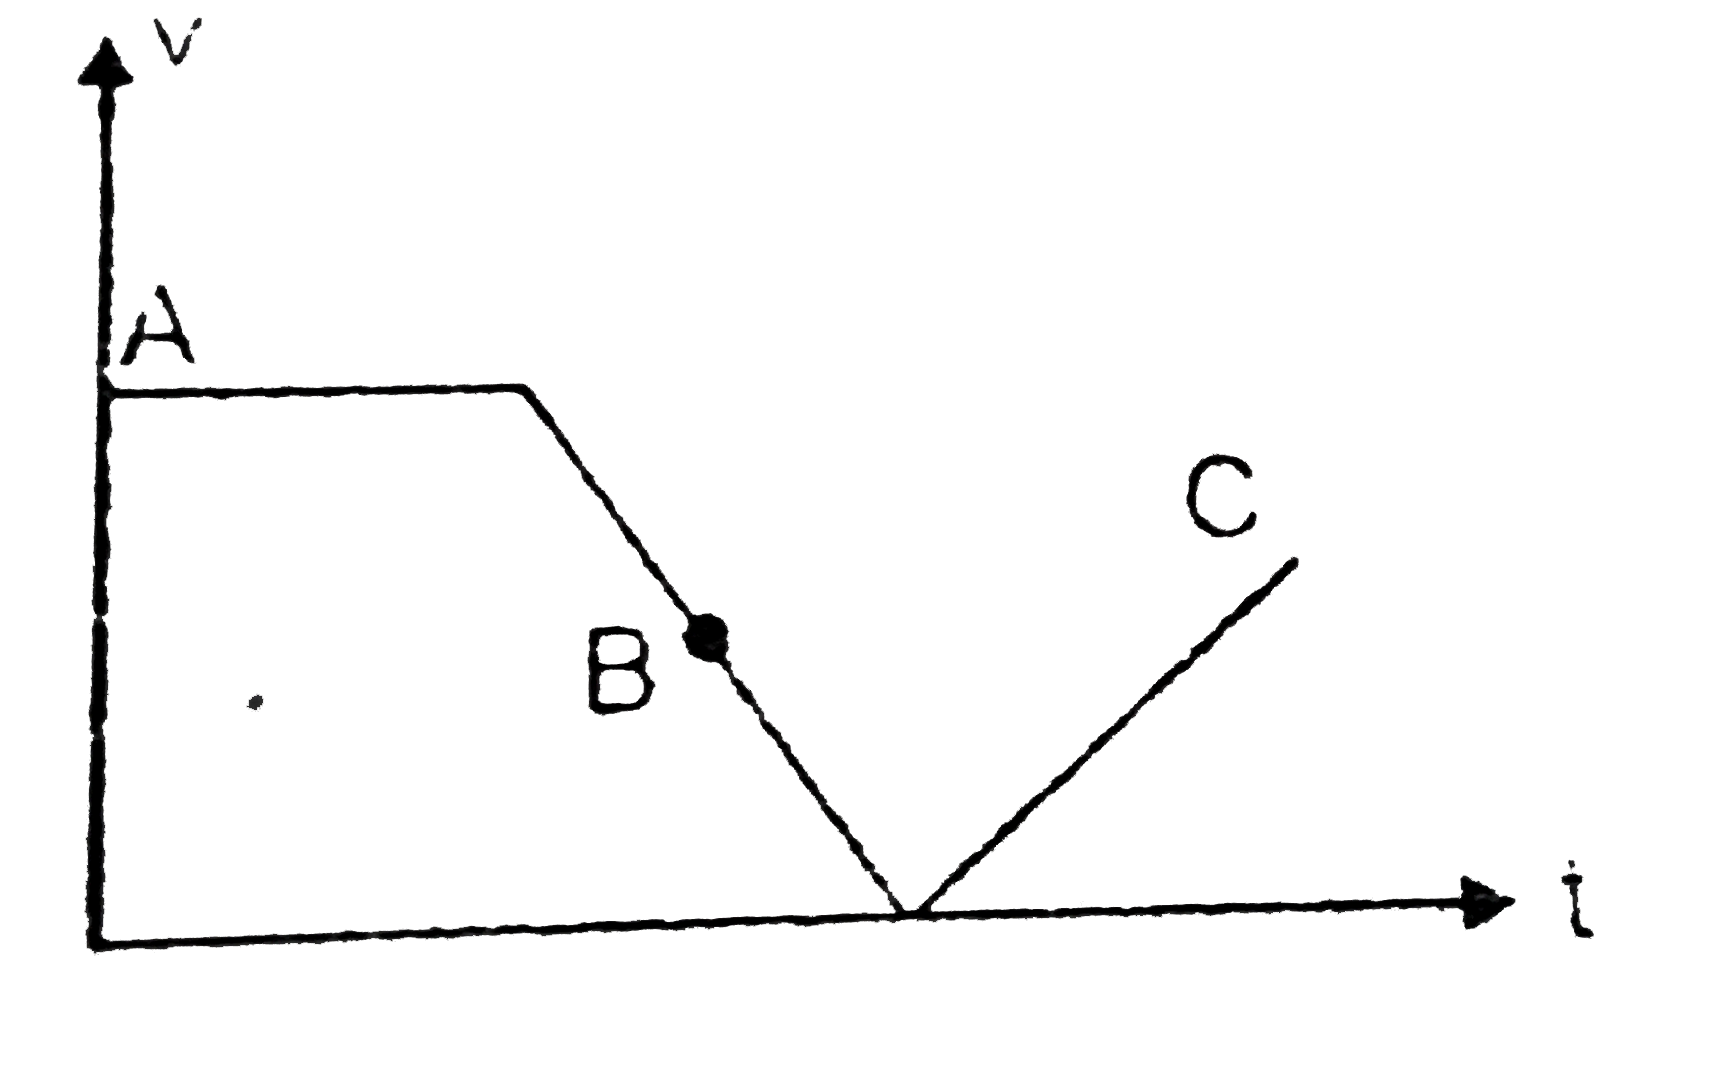
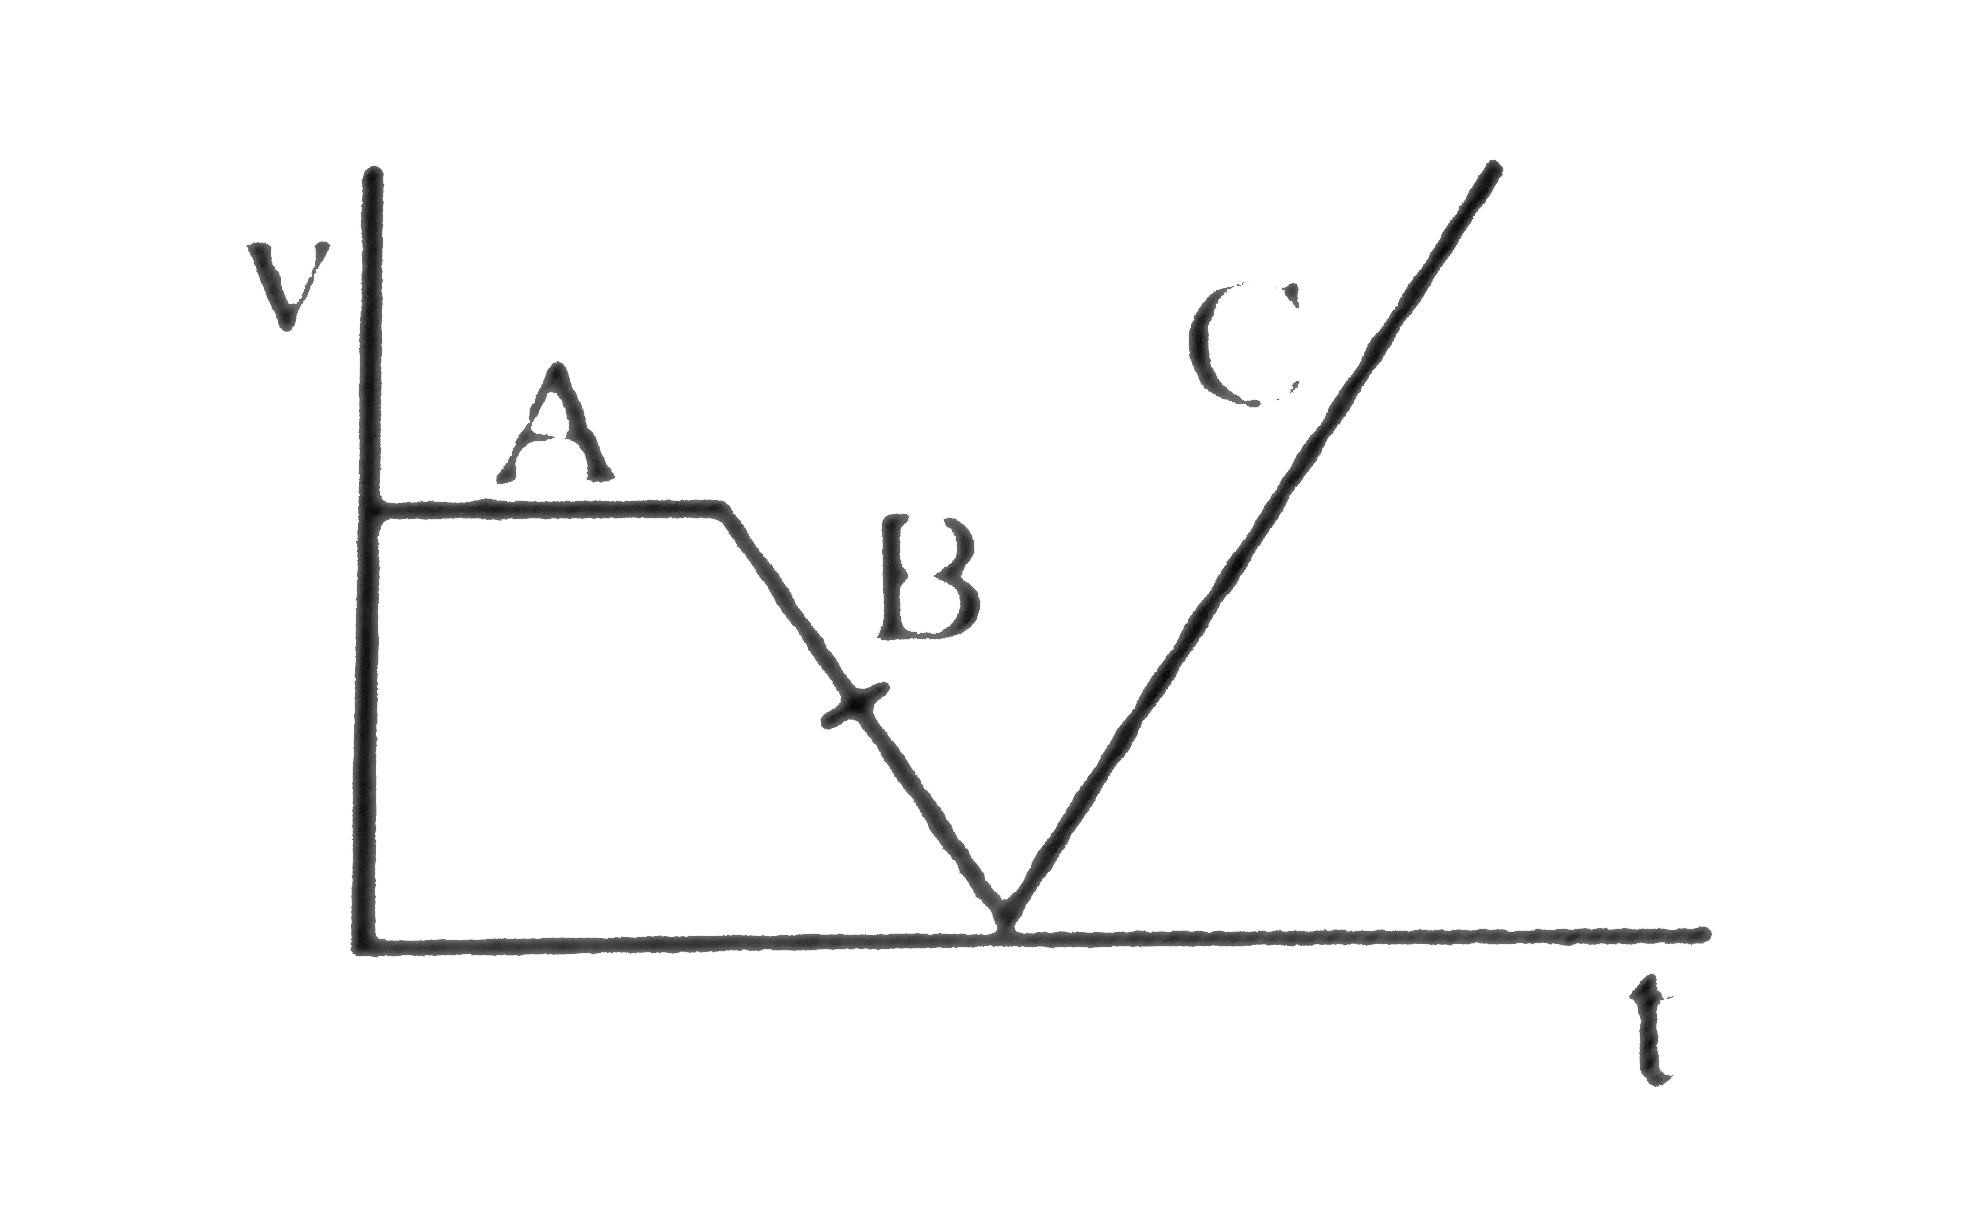
The velocity-time graph of a body is shown in the figure, it implies that at point B
 Athe force Is zeroBthere is a force toward motionCthere Is a force which opposes motionDthere is only gravitational force
The velocity - time graph of two bodies A and B is shown in figure. Choose correct statement.
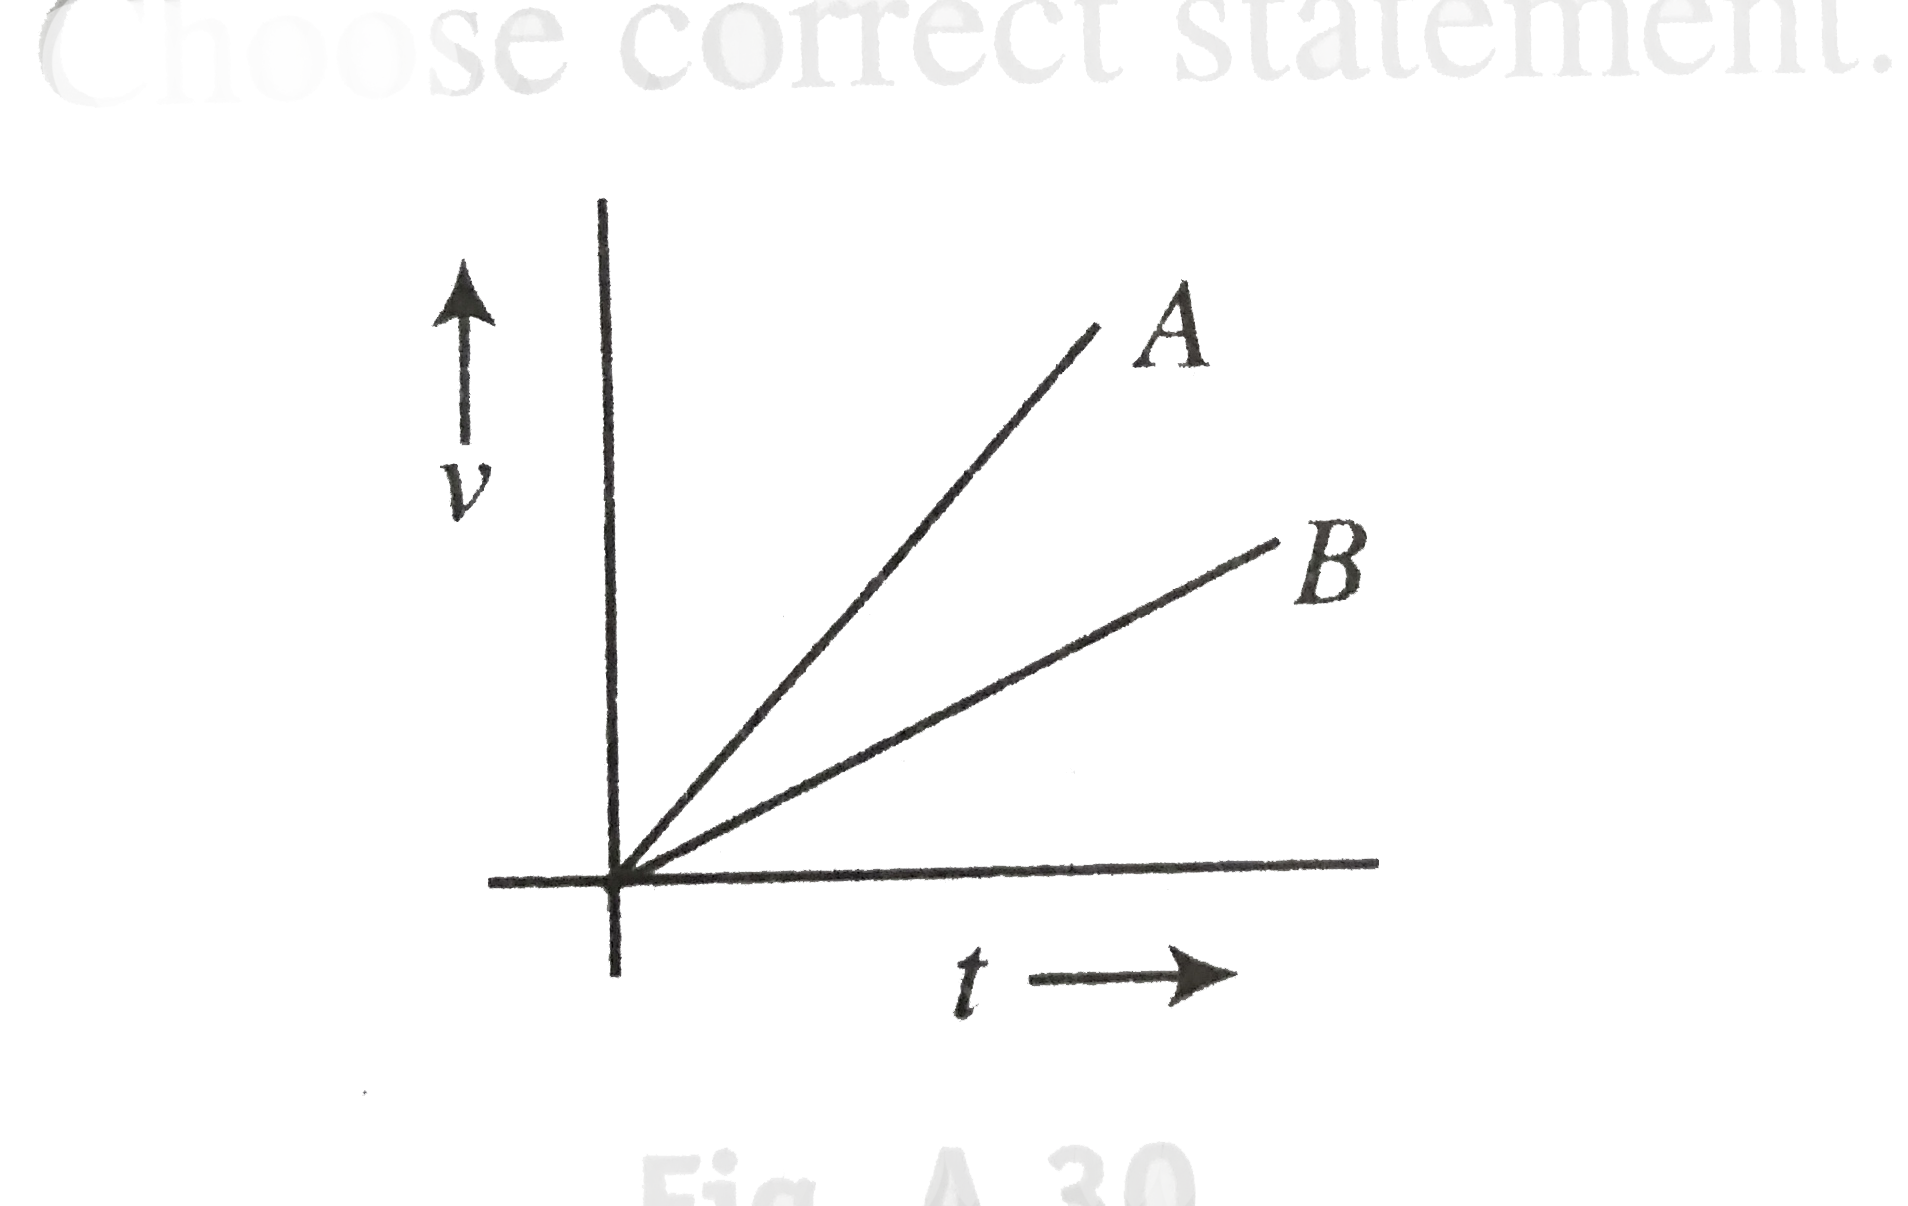 Aacceleration of Bgt acceleration of ABacceleration of A gt acceleration of BCboth are starting from same pointDA covers greater distance than B in the same time.
The velocity - time graph for two bodies A and B are shown in figure. Then, the acceleration of A and B are in the ratio
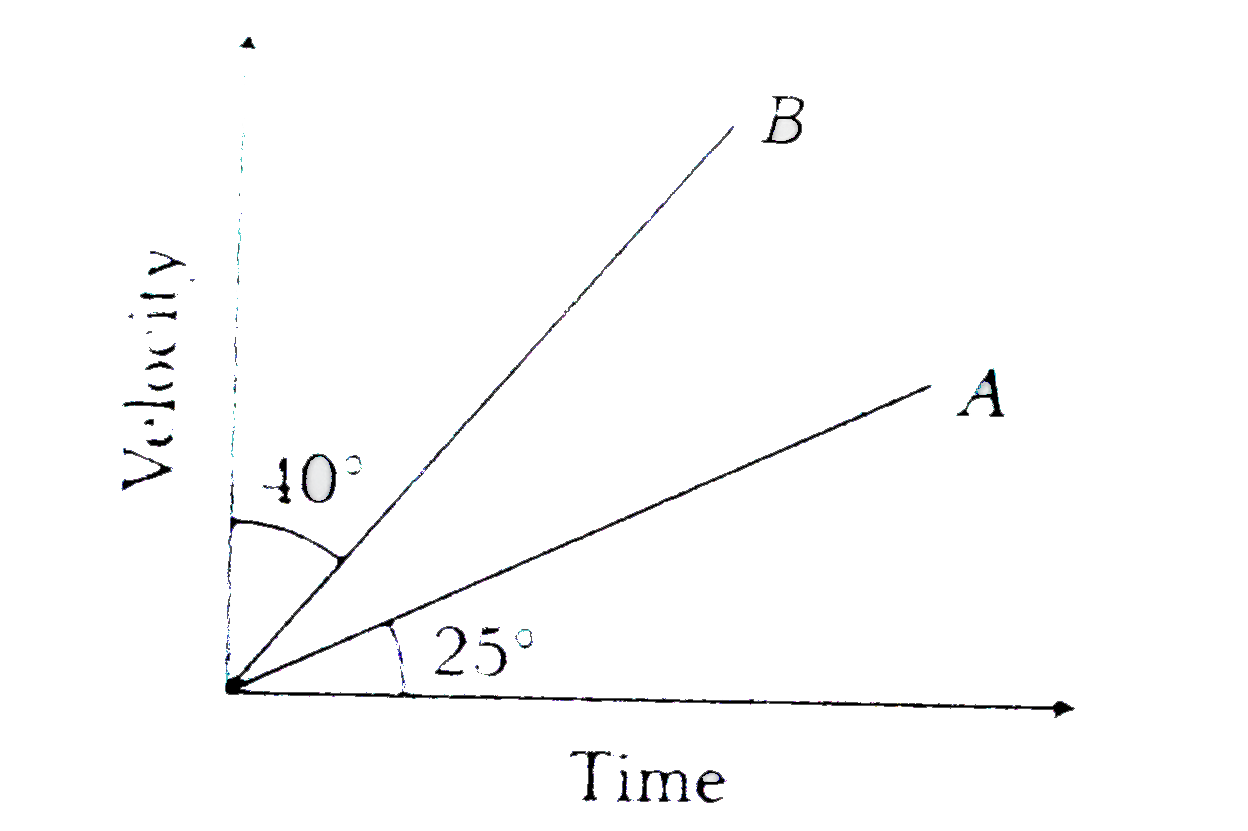 Asin25∘ to sin50∘Btan25∘ to tan40∘Ccos25∘ to cos50∘Dtan25∘ to tan50∘
Velocity versus time graph of a body is shown in figure. It explains that
View SolutionThe velocity time graph of a body is as showh in
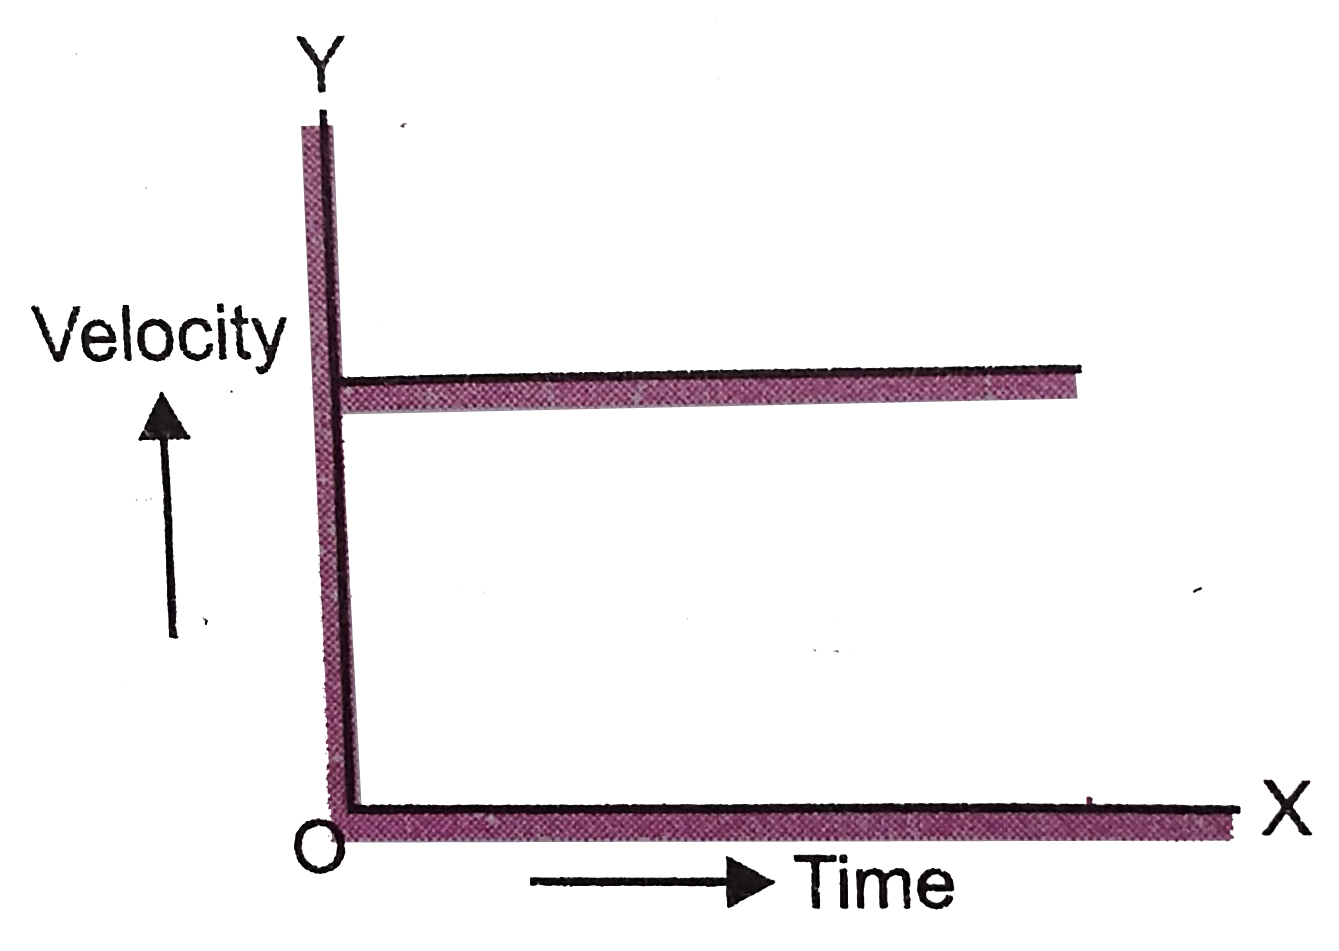
what would be the acceleration of the body ?
View SolutionThe velocity time graph of a body represented as shown in Fig. Calculate the distance by the body in 5 second.

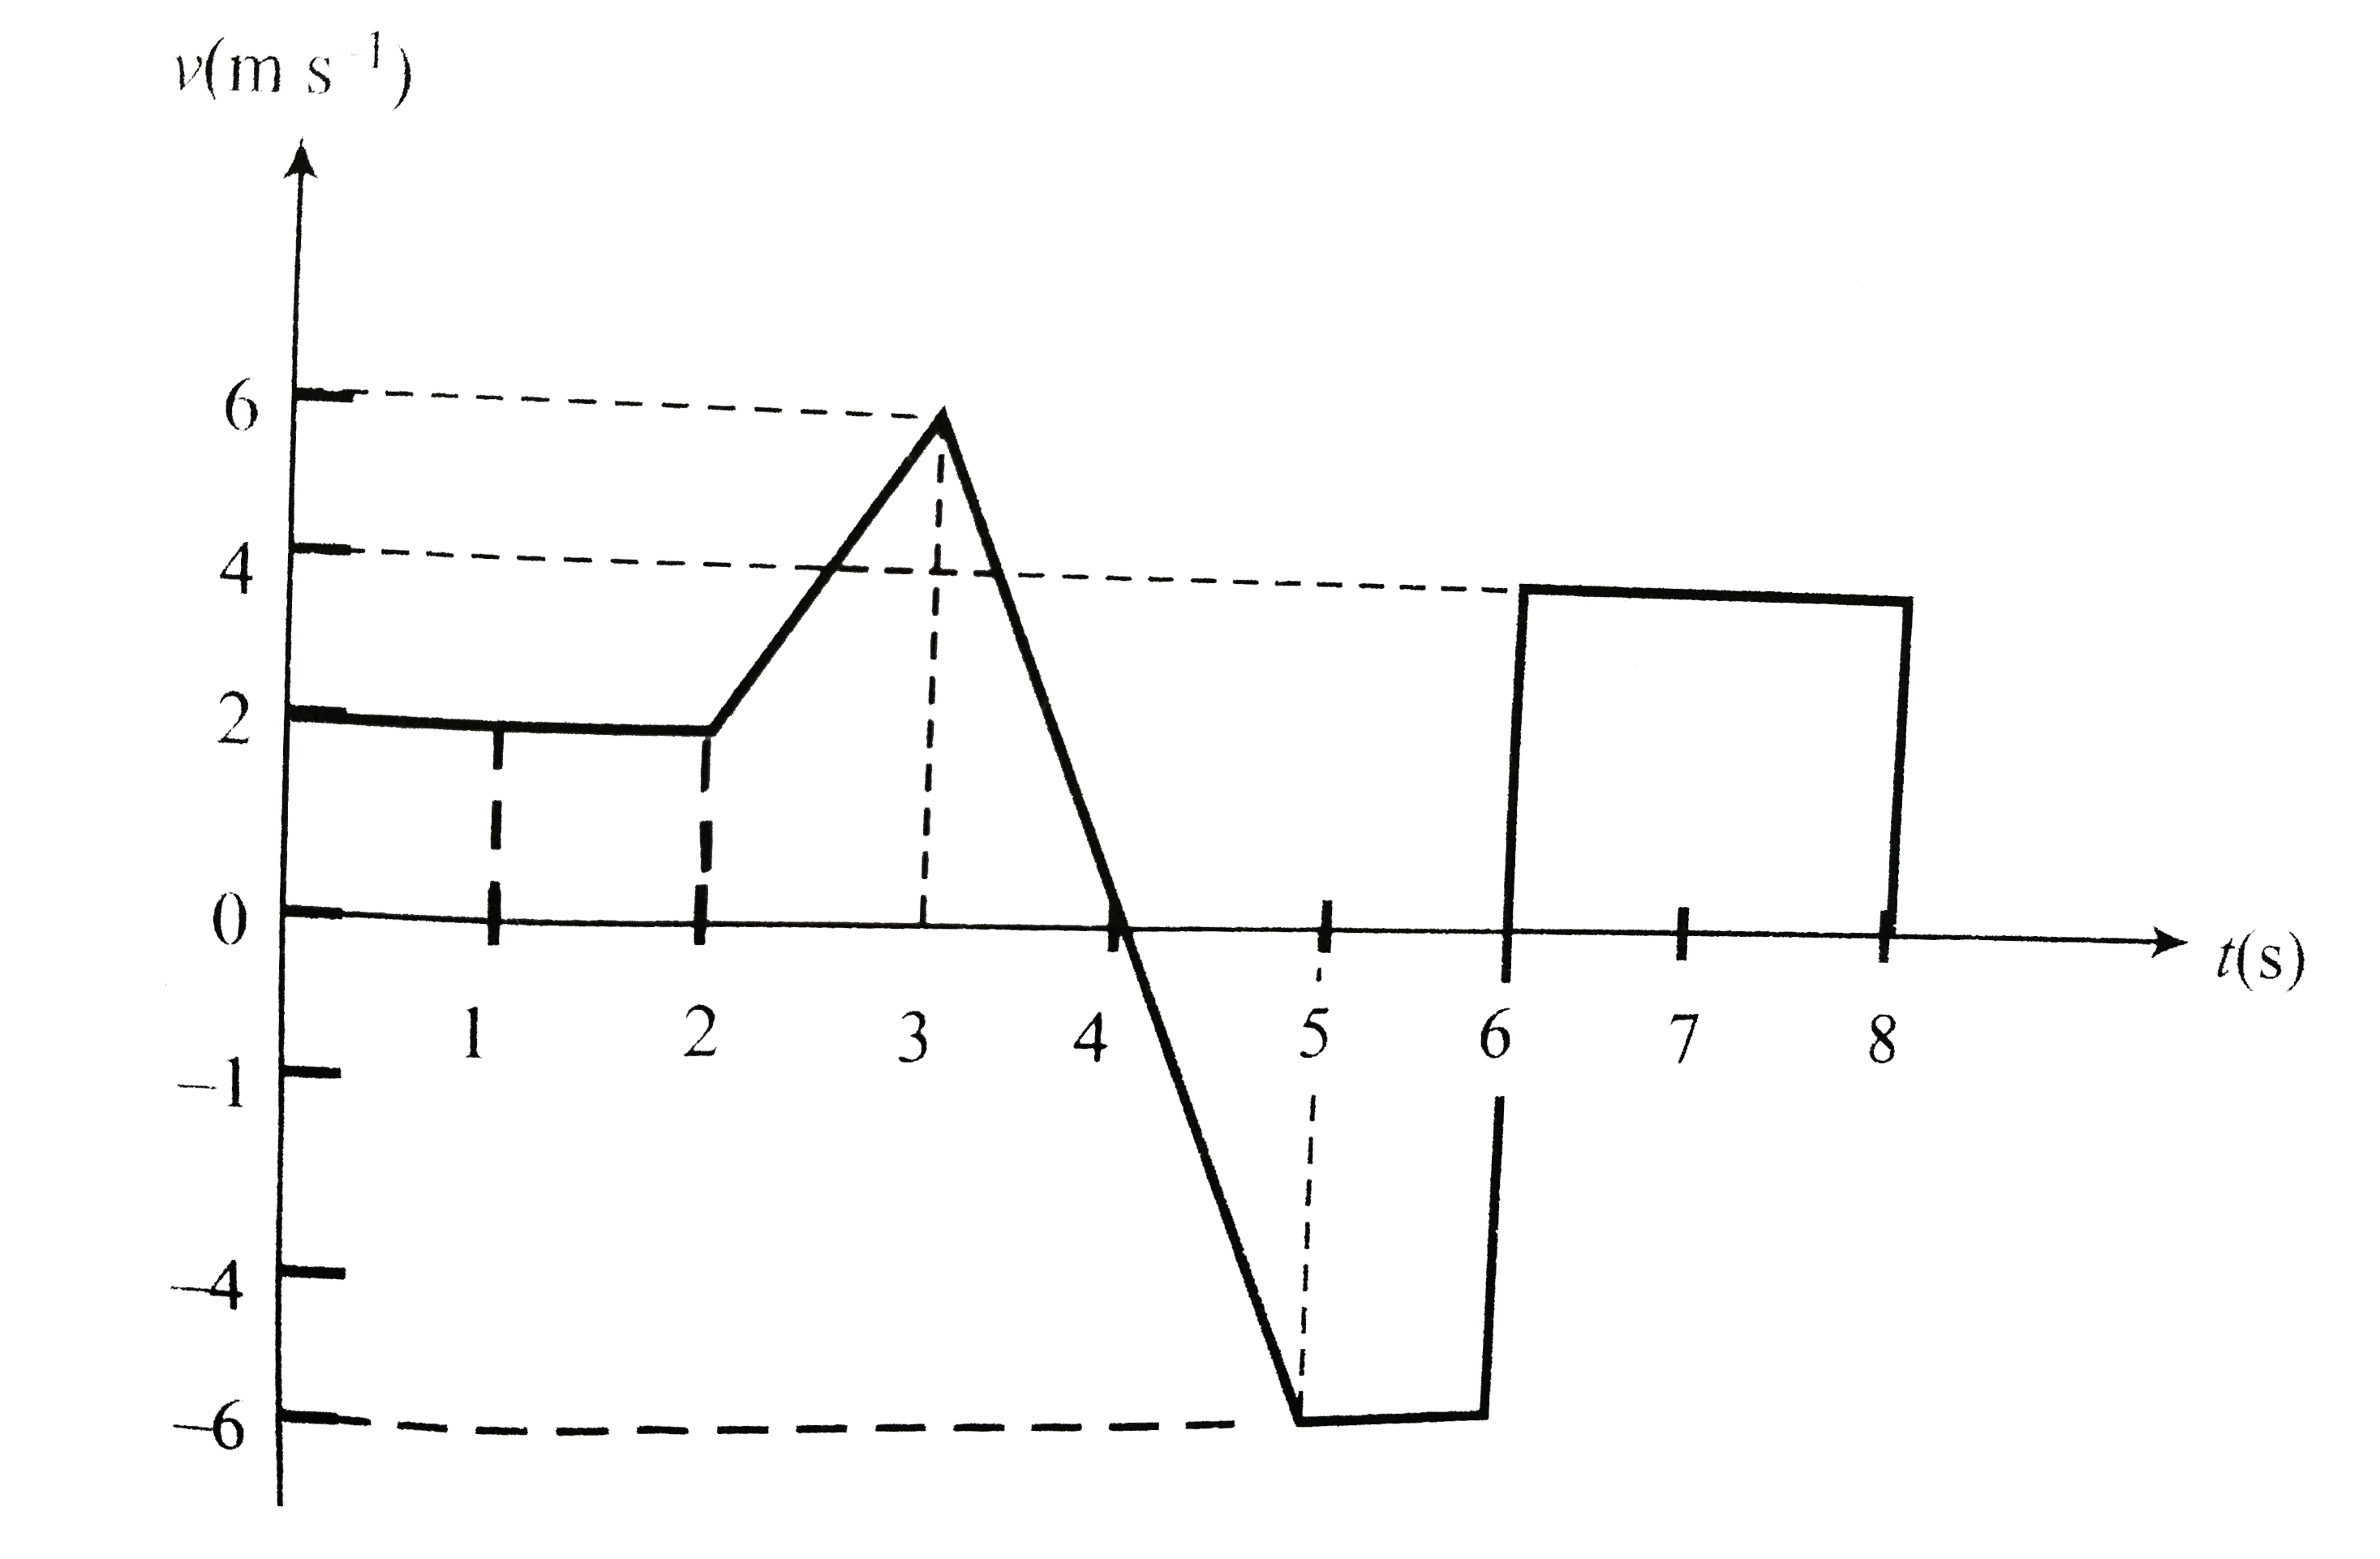
View SolutionThe velocity-time graph of a body is shown in .
The displacement of the body in 8s is.
 .
.
View SolutionVelocity-time graph of a body thrown vertically up is
View Solution


