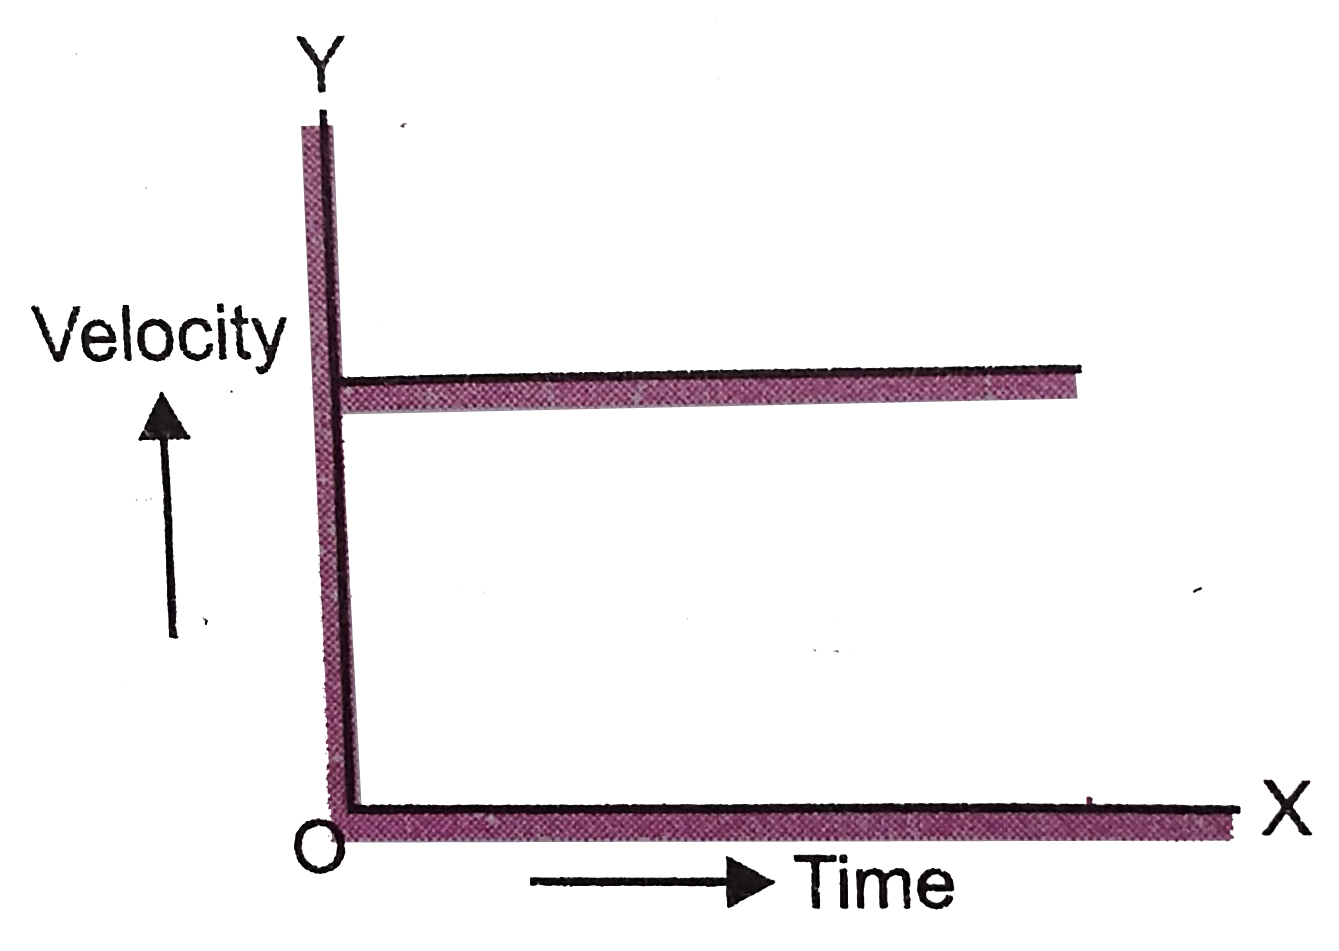
The velocity time graph of a body represented as shown in Fig. Calculate the distance by the body in 5 second.

Video Solution
Text Solution
Distance travelled = area under the straight line OA
=12×5×10=25m
|
Topper's Solved these Questions
- MOTIONBook:PRADEEPChapter:MOTIONExercise:(NCERT) multiple choice
Explore 11 Videos
- MOTIONBook:PRADEEPChapter:MOTIONExercise:Mock test
Explore 24 Videos
- MOTIONBook:PRADEEPChapter:MOTIONExercise:Formative Assessment 1(b) - Oral testing (Exercise)
Explore 1 Video
- GRAVITATIONBook:PRADEEPChapter:GRAVITATIONExercise:Model Test paper (1)
Explore 36 Videos
- SOUNDBook:PRADEEPChapter:SOUNDExercise:Model Test (sec - B)
Explore 12 Videos
Similar Questions
Knowledge Check
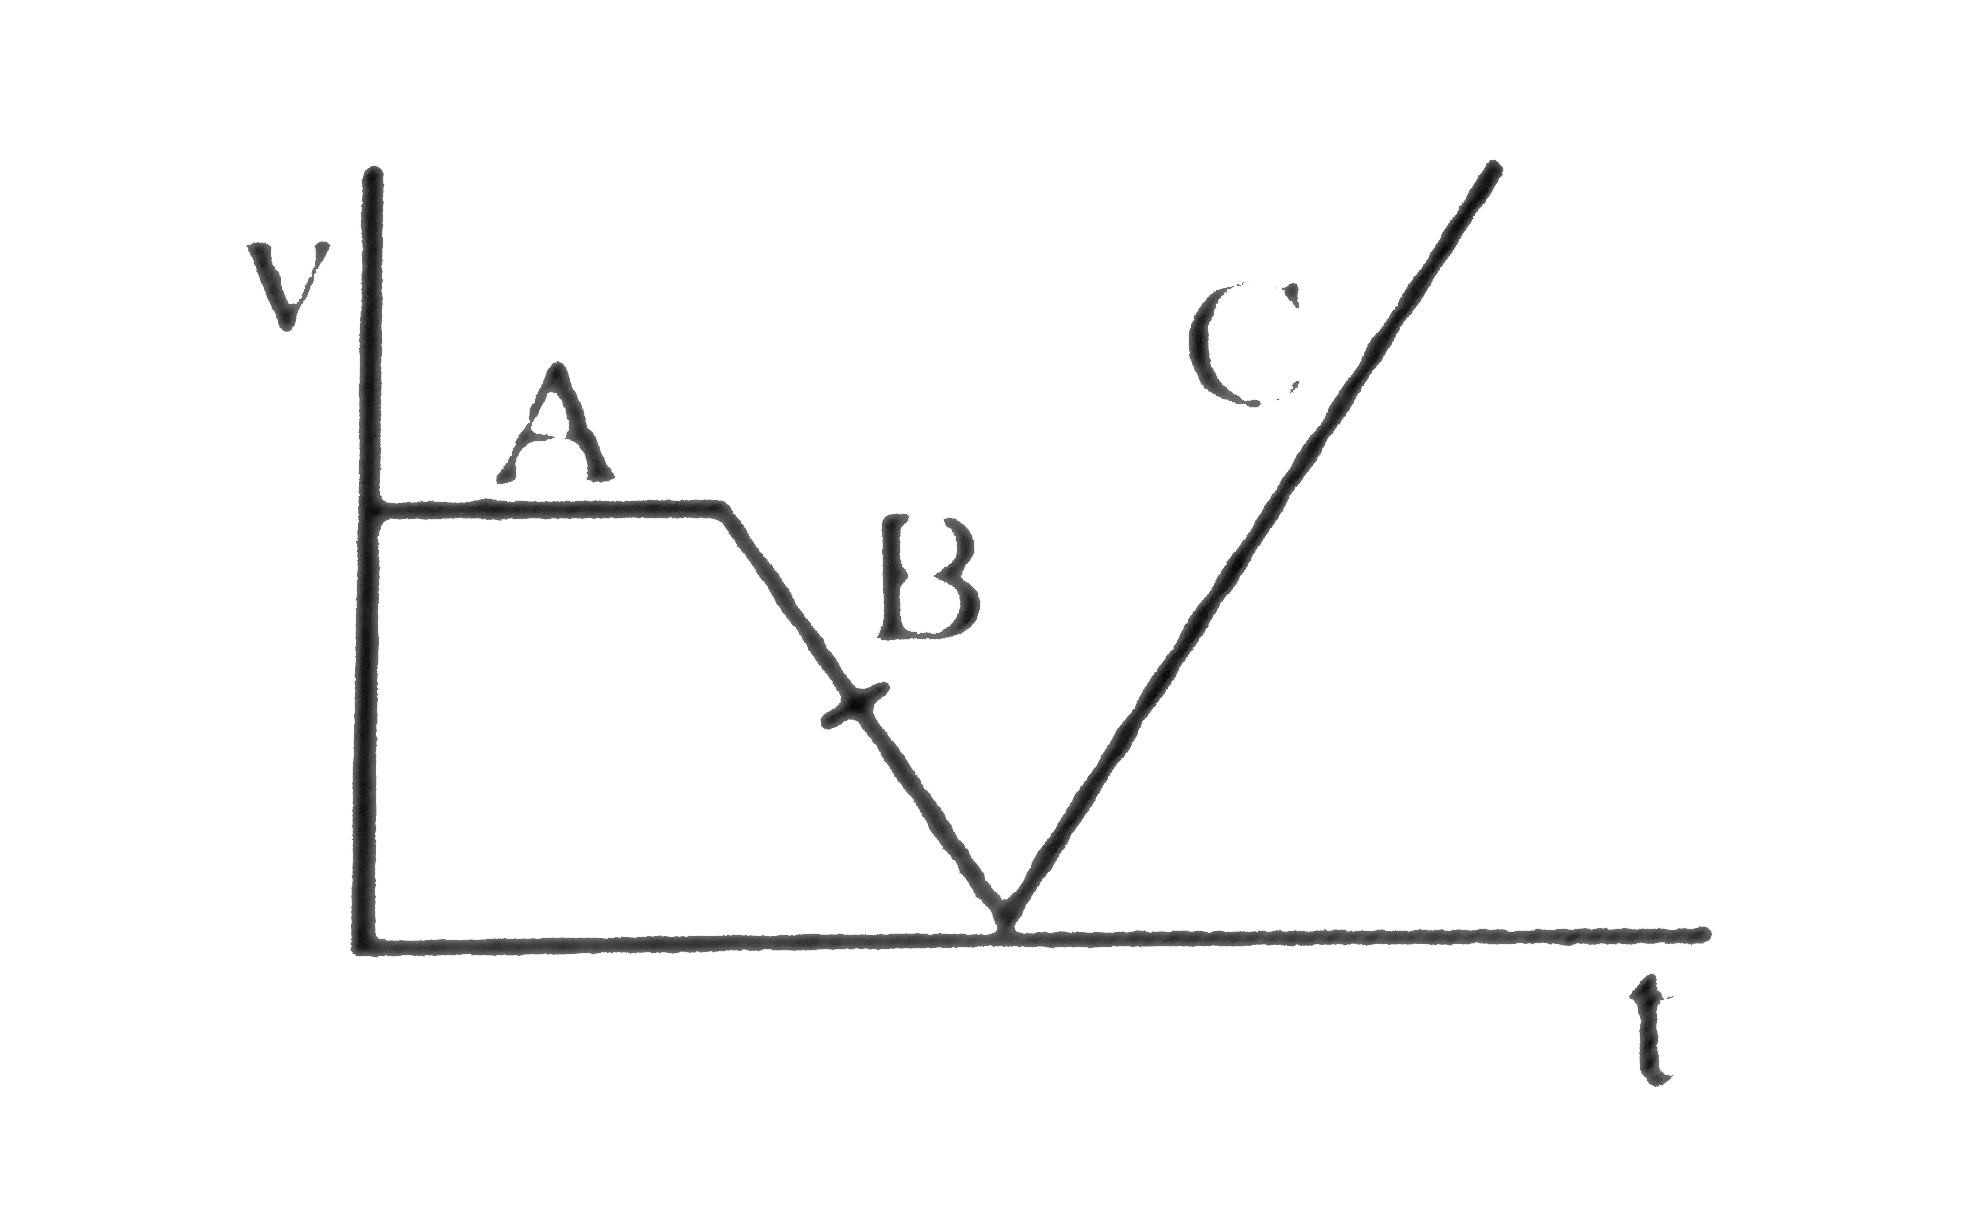
Velocity-time graph of a body thrown vertically up is
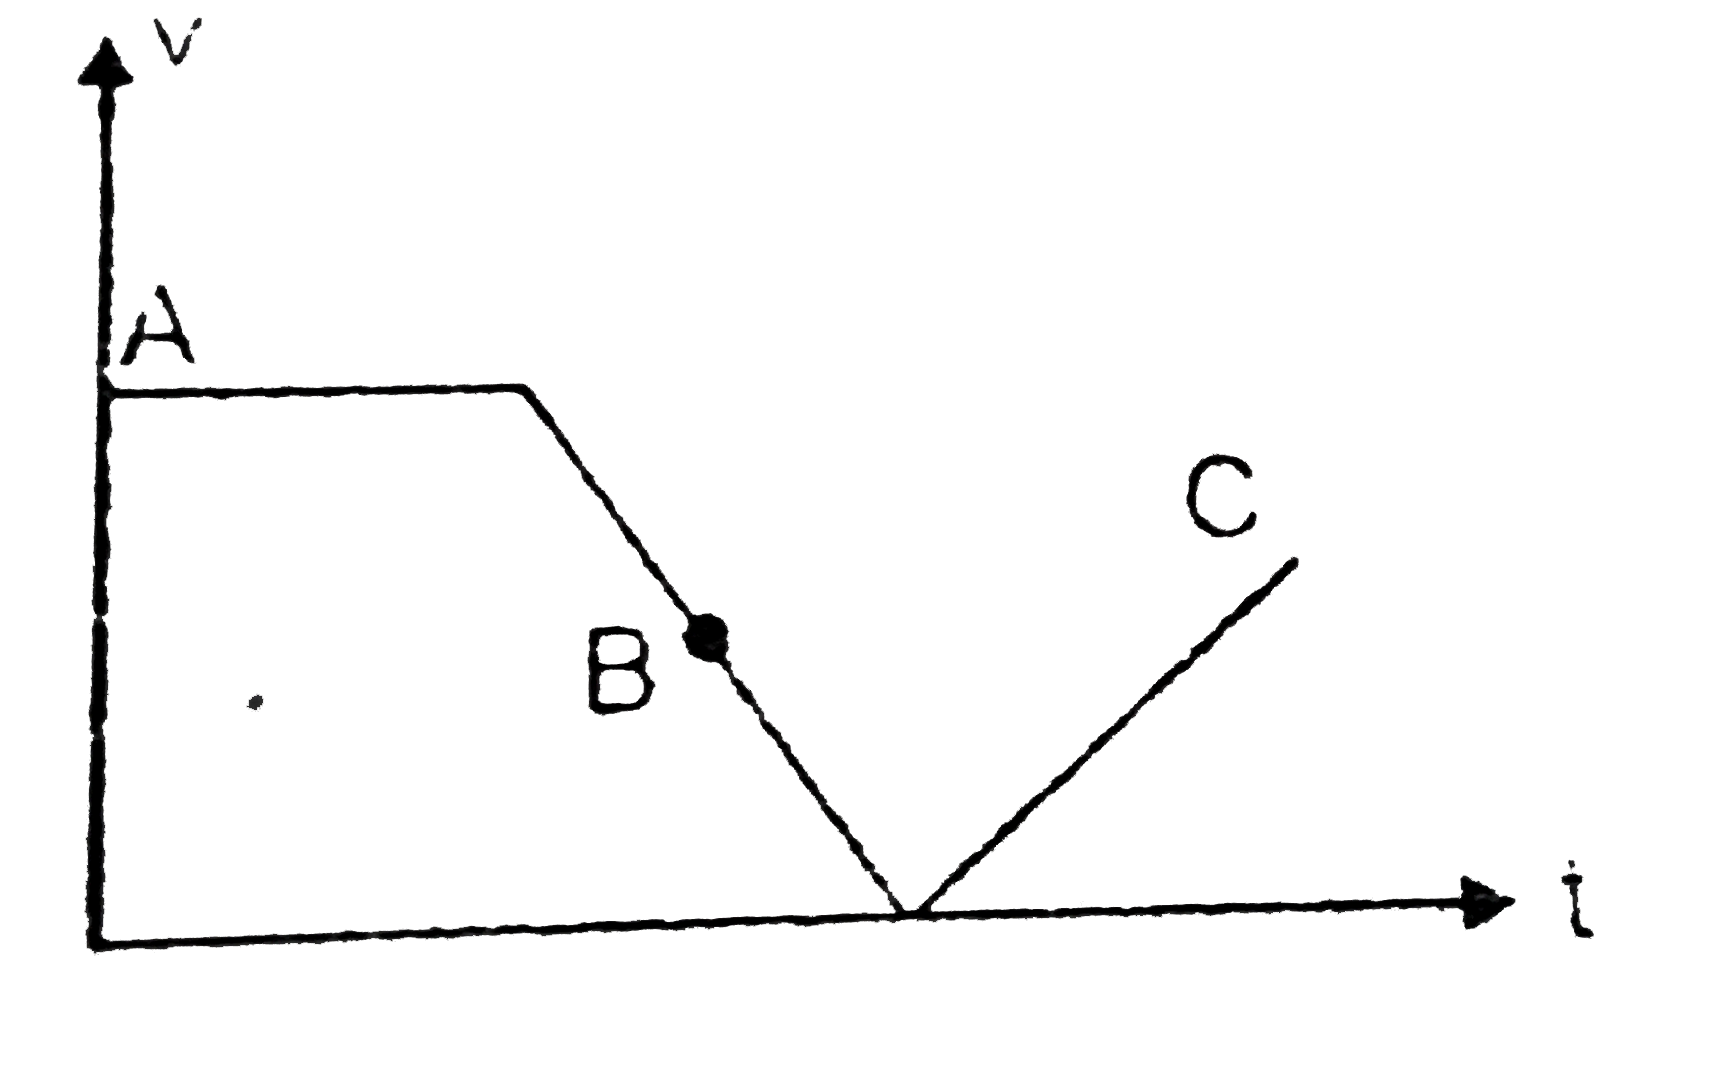
Aa straight lineBa parabolaCa hyperbolaDcircleThe veloctiy - time graph of a body is shown in the fig. It implies that at point B.
 AThe force is zeroBThere is a force towards motionCThere is a force which opposes motionDThere is only gravitational force
The velocity-time graph of a body is shown in the figure, it implies that at point B
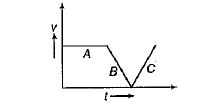 Athe force Is zeroBthere is a force toward motionCthere Is a force which opposes motionDthere is only gravitational force
The velocity versus time graph of a body in a straight line is as shown in figure. The displacment of the body in five seconds is
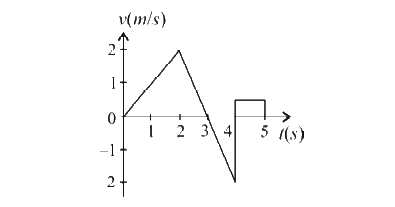
View SolutionVelocity versus time graph of a body is shown in figure. It explains that
View SolutionThe velocity -time graph for a body with non-uniform motion is a
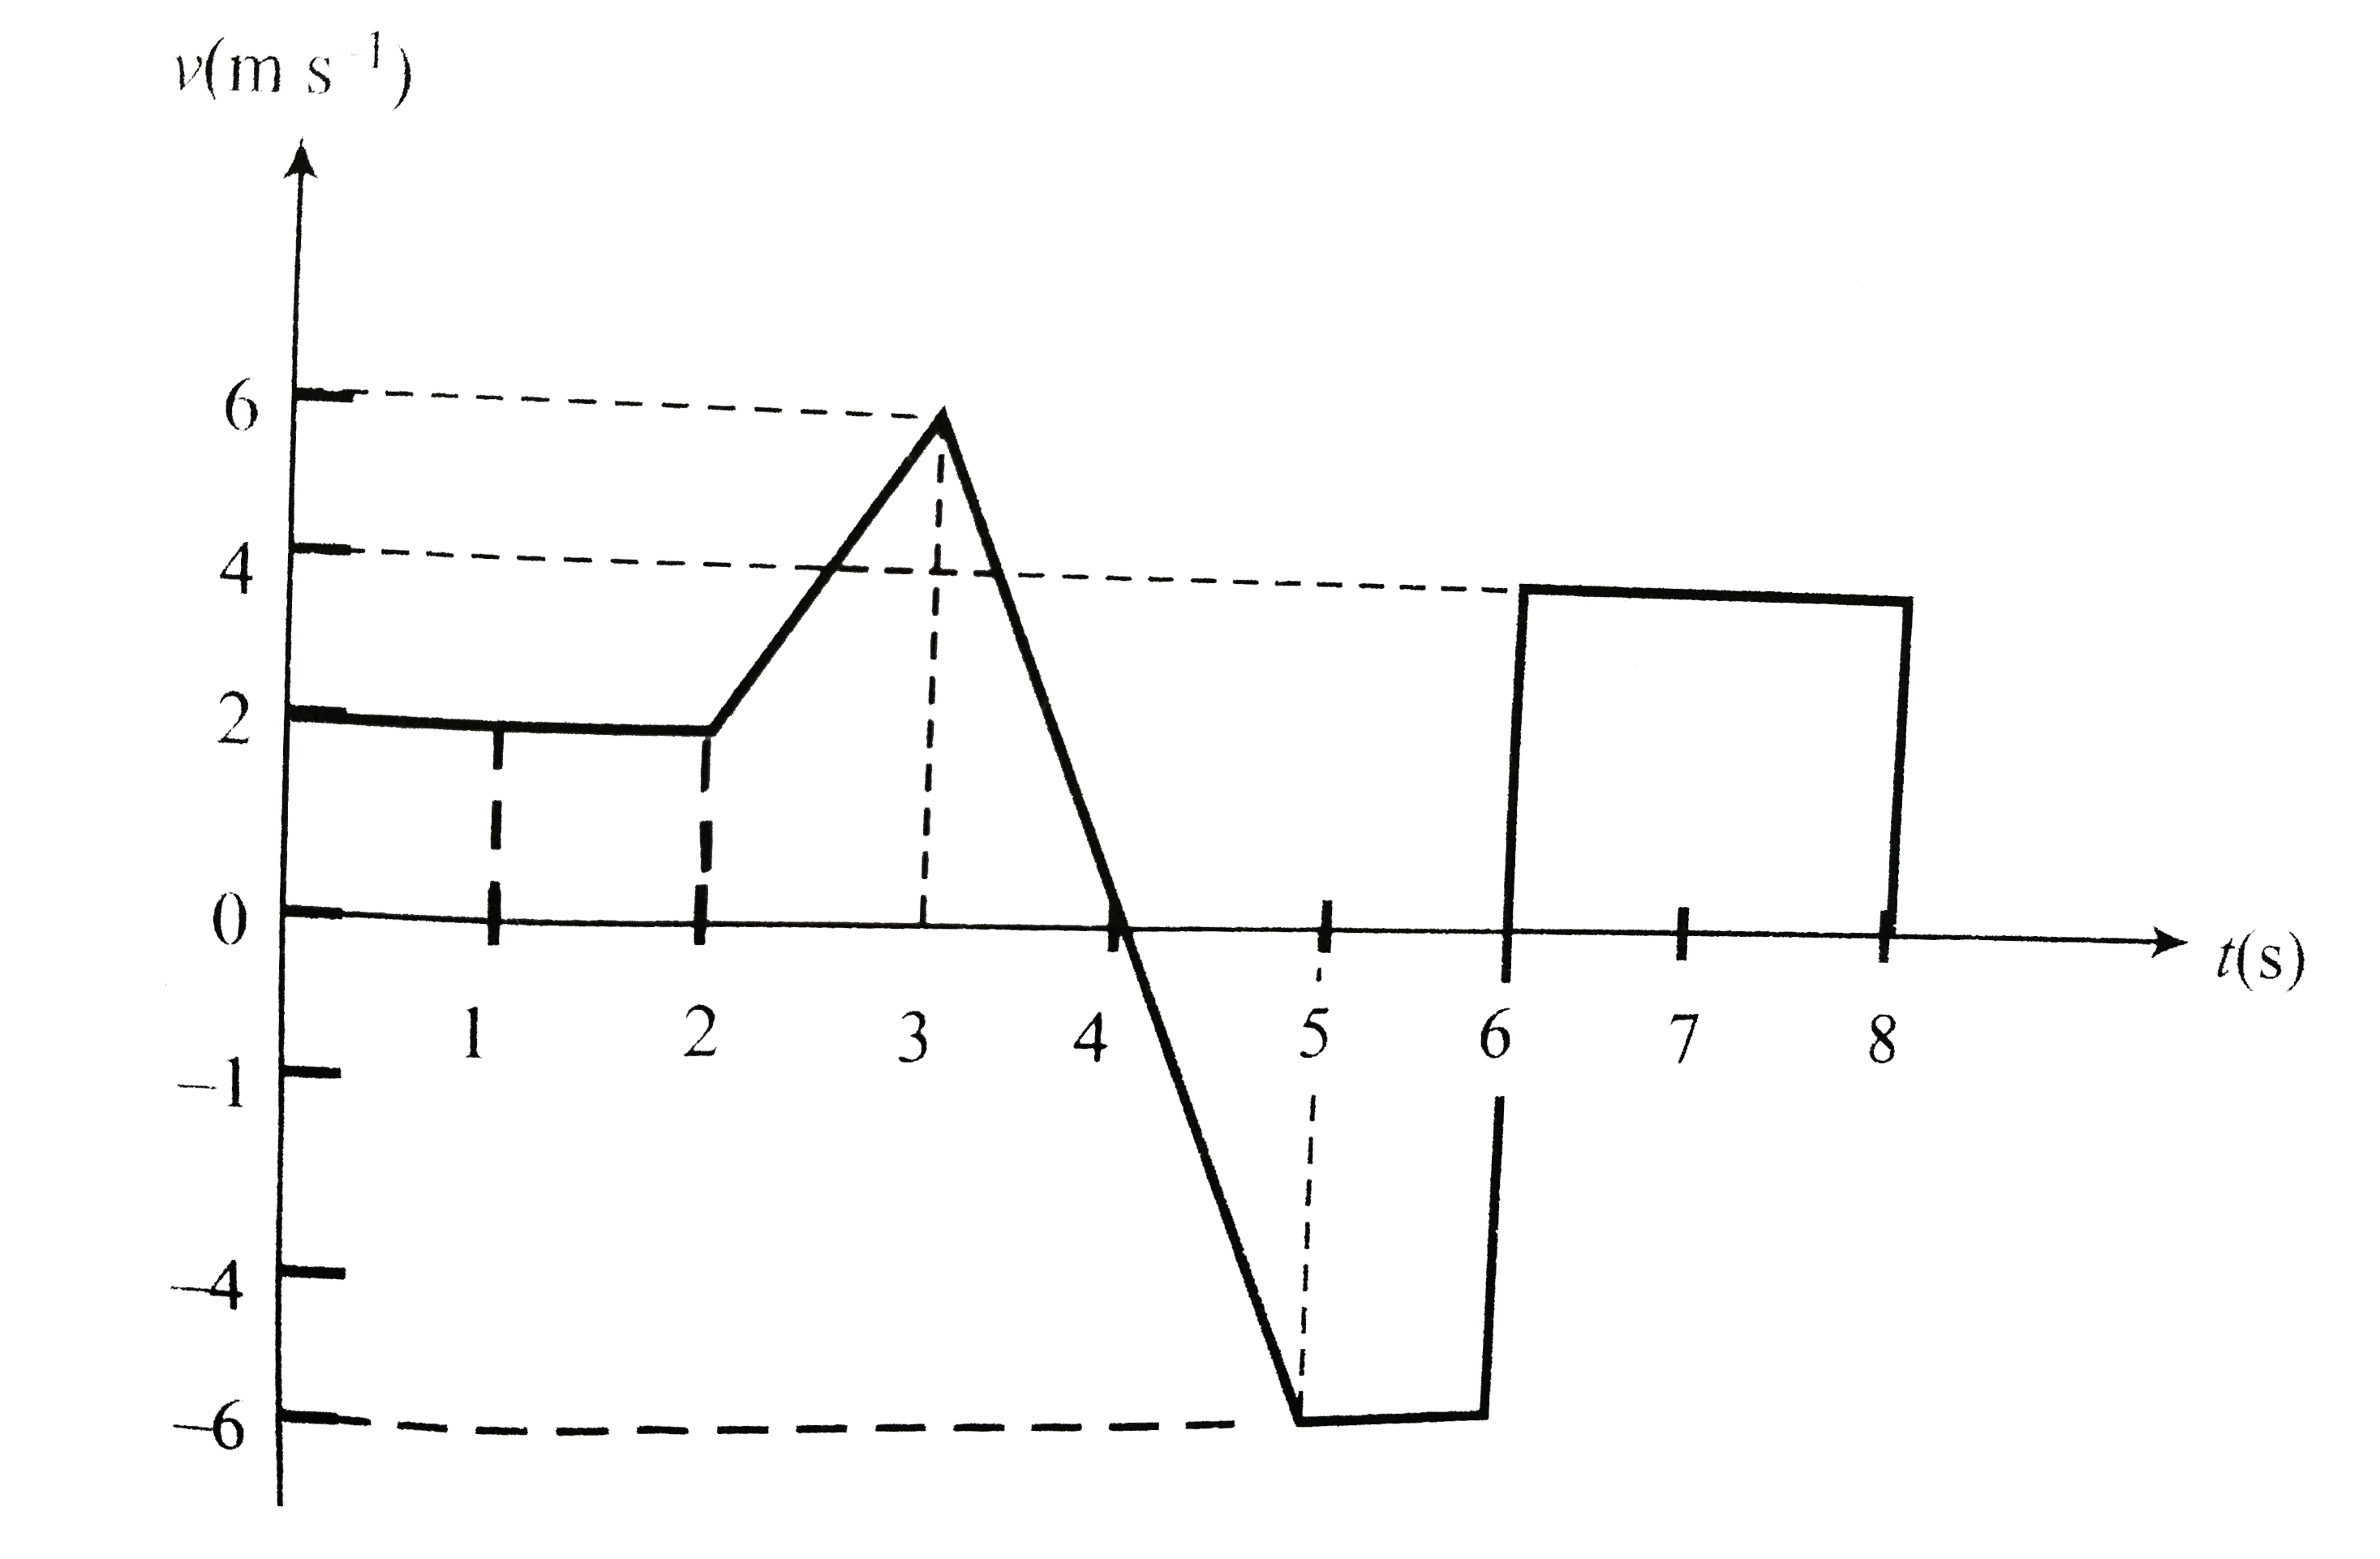
View SolutionThe velocity-time graph of a body is shown in .
The displacement of the body in 8s is.
 .
.
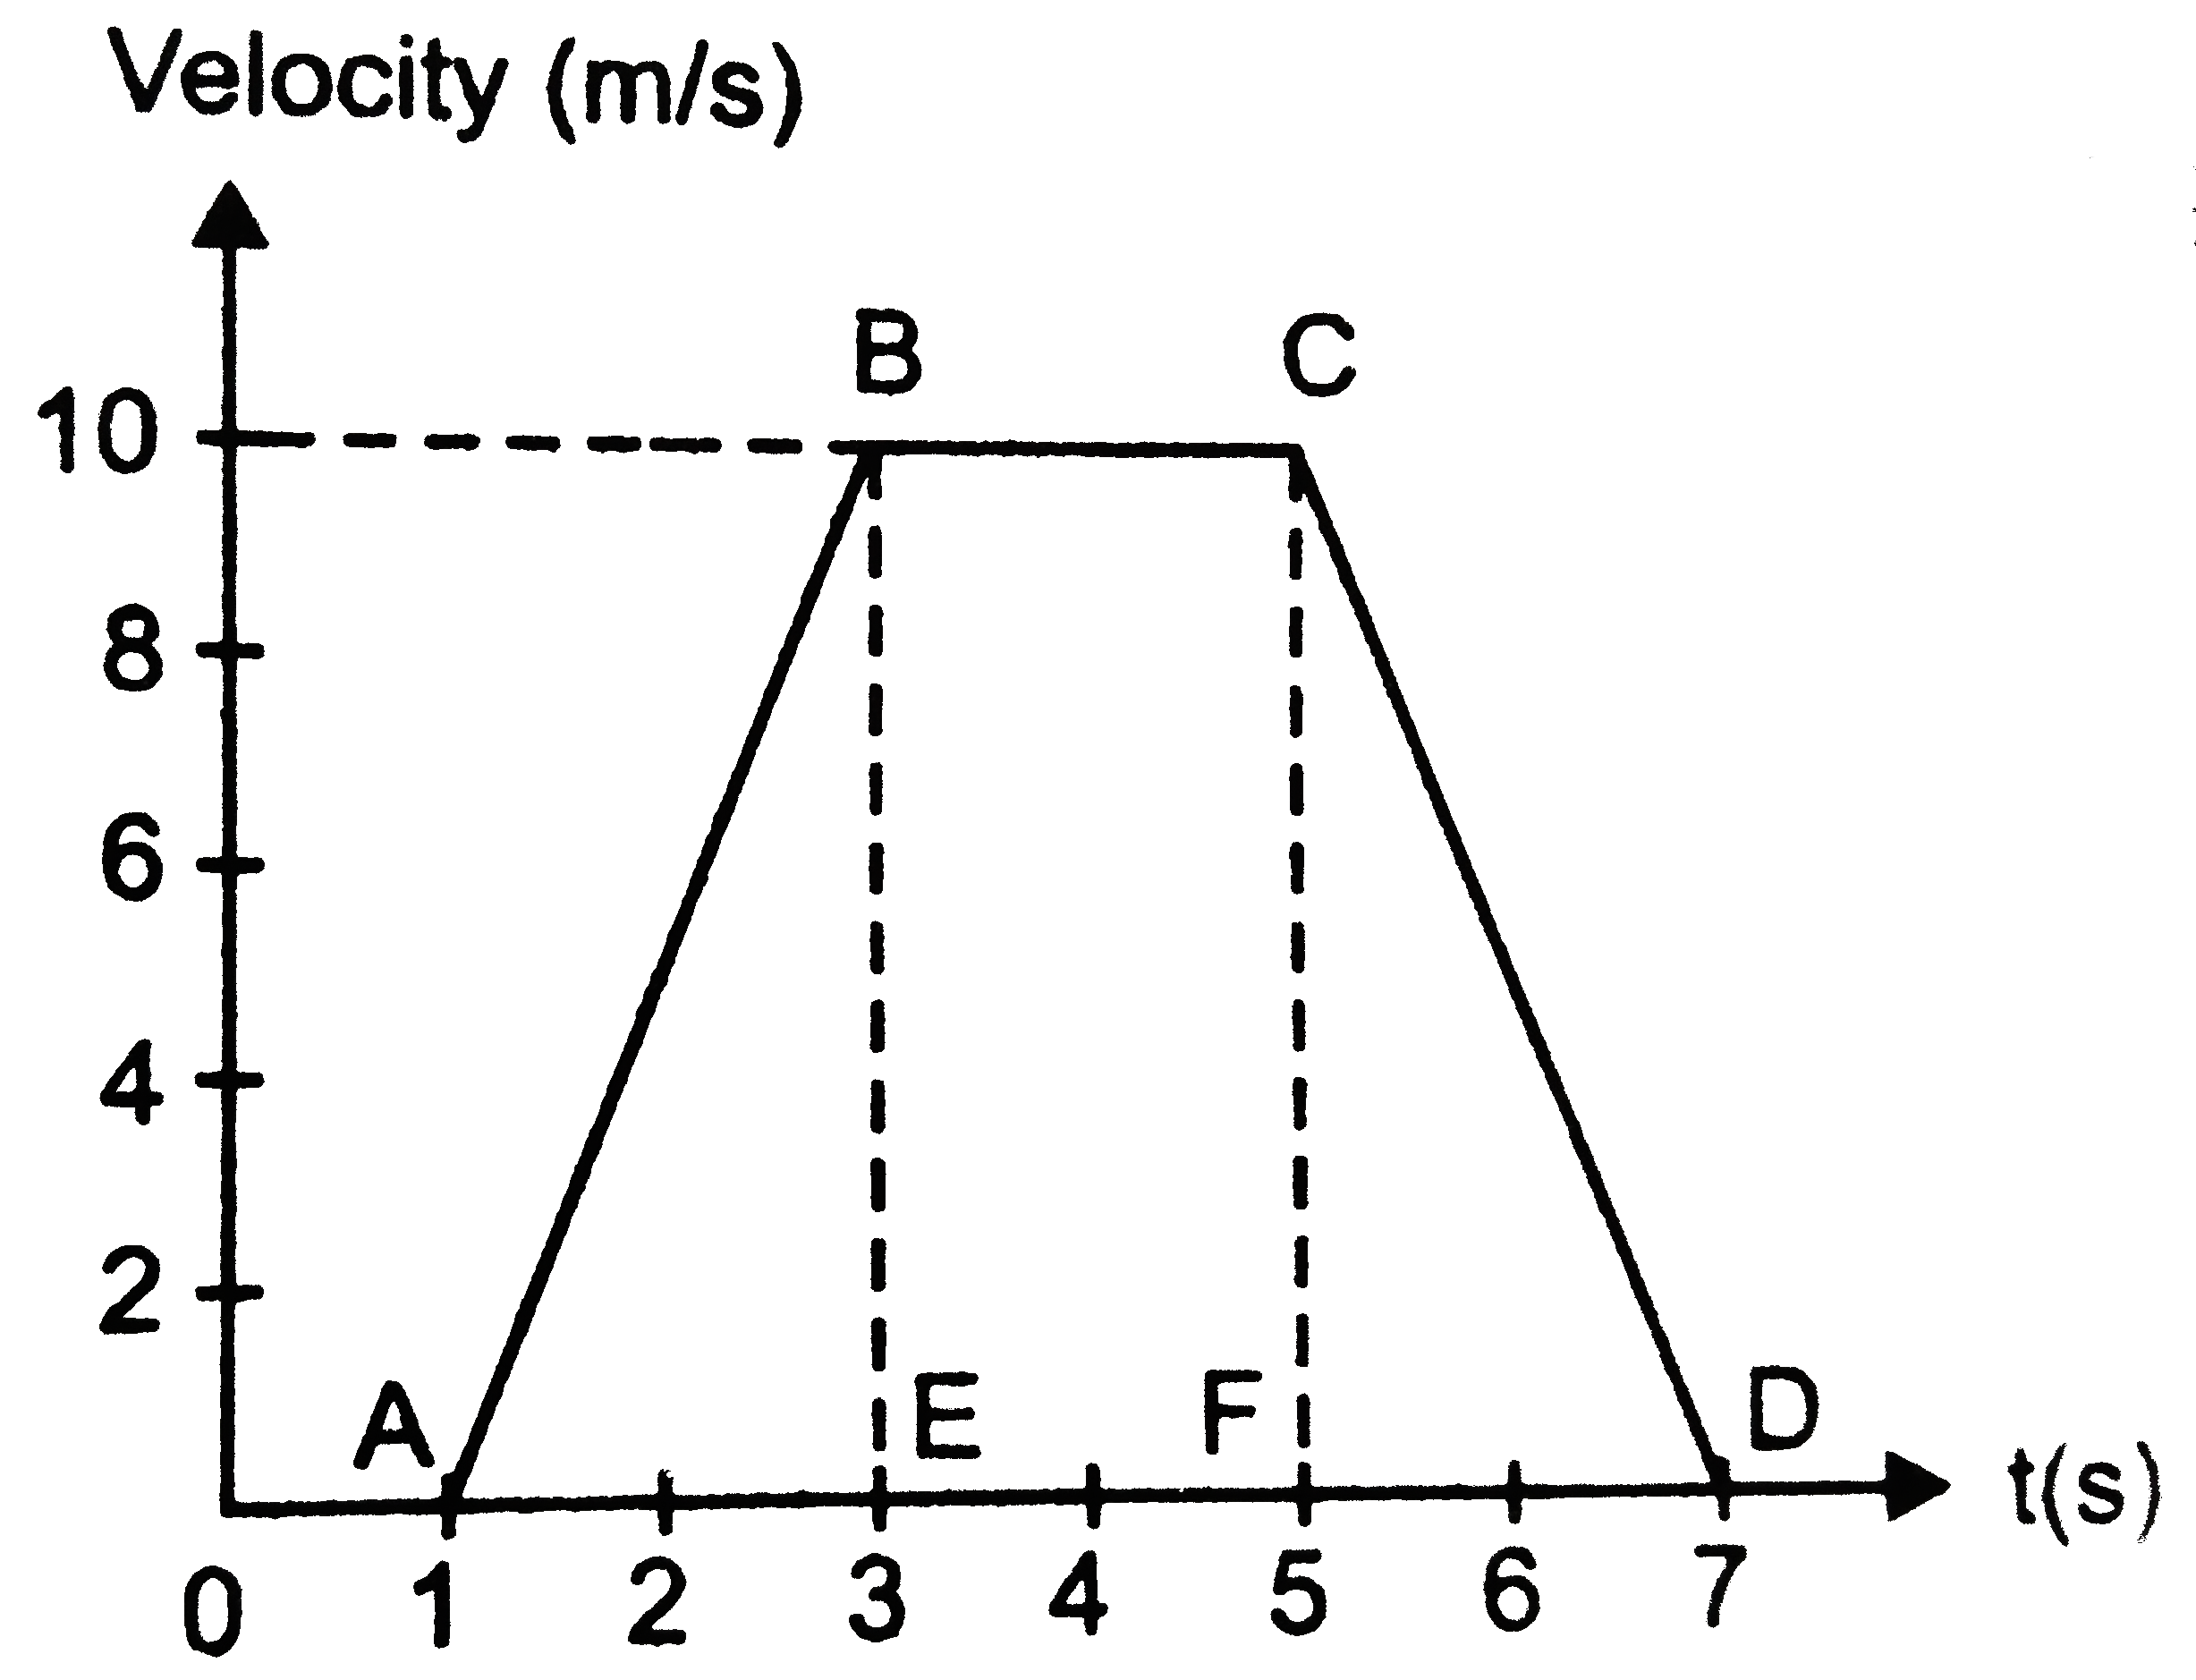
View SolutionFor the velocity tiem graph shown in Fig. 2 (CF).14, the distance covered by the body in last two seconds of its what fraction if the total distance covered by it in all the seven seconds?
 .
.
View Solution


