For sperical mirros graph plotted between and .
Step by step video & image solution for For sperical mirros graph plotted between - (1)/(V) and -(1)/(u)is . by Physics experts to help you in doubts & scoring excellent marks in Class 12 exams.
Updated on:21/07/2023Topper's Solved these Questions
- RAY OPTICSBOOK - AAKASH SERIESCHAPTER - RAY OPTICSEXERCISE - PROBLEMS ( LEVEL-I)
57 Videos
- RAY OPTICSBOOK - AAKASH SERIESCHAPTER - RAY OPTICSEXERCISE - PROBLEMS ( LEVEL-II)
60 Videos
- RAY OPTICSBOOK - AAKASH SERIESCHAPTER - RAY OPTICSEXERCISE - EXERCISE (SHORT ANSWER QUESTIONS )
24 Videos
- PRACTICAL PHYSICSBOOK - AAKASH SERIESCHAPTER - PRACTICAL PHYSICSEXERCISE - LECTURE SHEET LEVEL-II (ADVANCED) Linked Comprehension Type Questions
4 Videos
- SEMICONDUCTOR DEVICESBOOK - AAKASH SERIESCHAPTER - SEMICONDUCTOR DEVICESEXERCISE - EXERCISE - III
3 Videos
Similar Questions
For a concave mirrorr, if real image is formed the graph between 1u and 1v is of the form
View SolutionFor an ideal solution, if a graph is plotted between 1PT and yA (mole fraction of A in vapour phase) where p0A>p0B then
View SolutionAt constant temperature if a graph plotted between logP and log(1V) has an intercept of unity then what will be the value of constant (k)
View SolutionIn Searl's experiment a graph is plotted between
View SolutionThe graph between 1v and 1u for a concave mirror looks like.
View SolutionThe graph between 1v and 1u for a concave mirror looks like.
View SolutionWhat do we get for a plot between V and 1/P ?
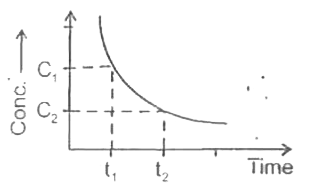
View SolutionThe graph plotted between concentration versus time

View SolutionIn determining the angle of minimum deviation for a given prism, a graph is plotted between the angle of incidence (j) and the angle of deviation (δ). Which of the following graphs will correctly
View SolutionA graph is plotted between Ecell and log.[Zn2+][Cu2+] . The curve is linear with intercept on Ecell axis equals to 1.10V. Calculate Ecell for the cell.
Zn(s)∣∣∣∣Zn2+(0.1M)∣∣∣∣Cu2+(0.01M)∣Cu
View Solution
