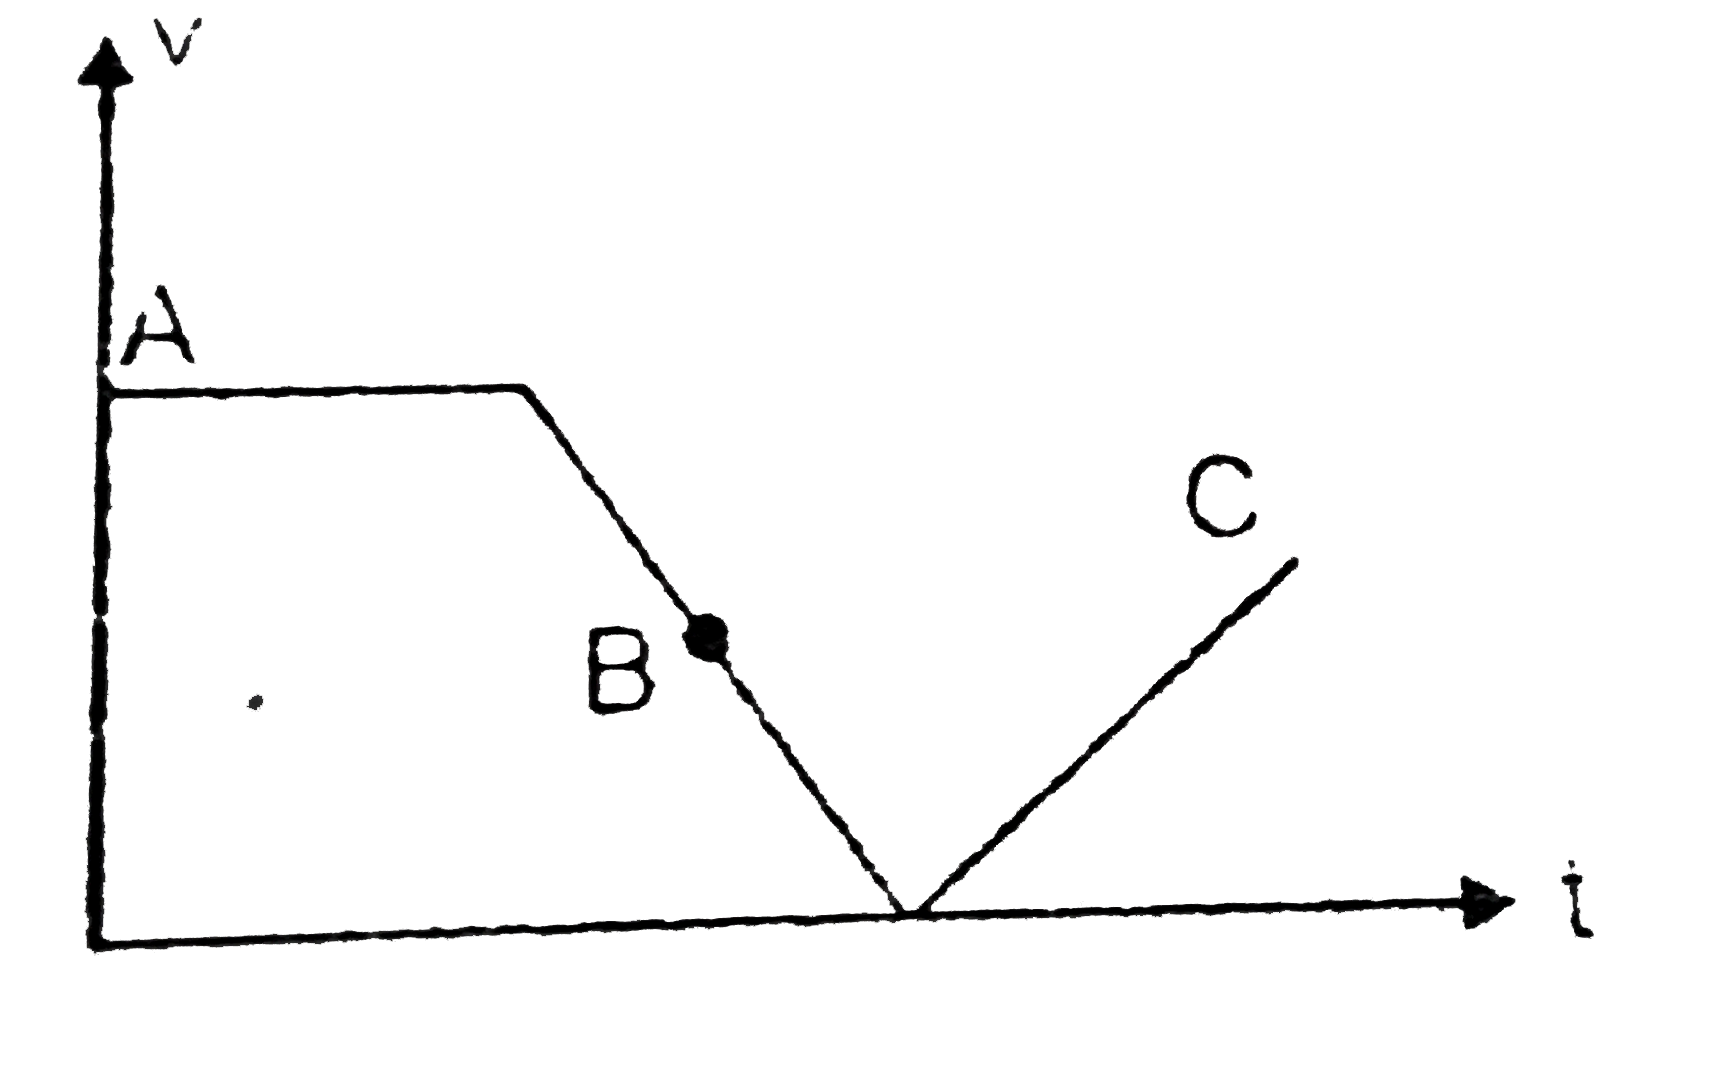
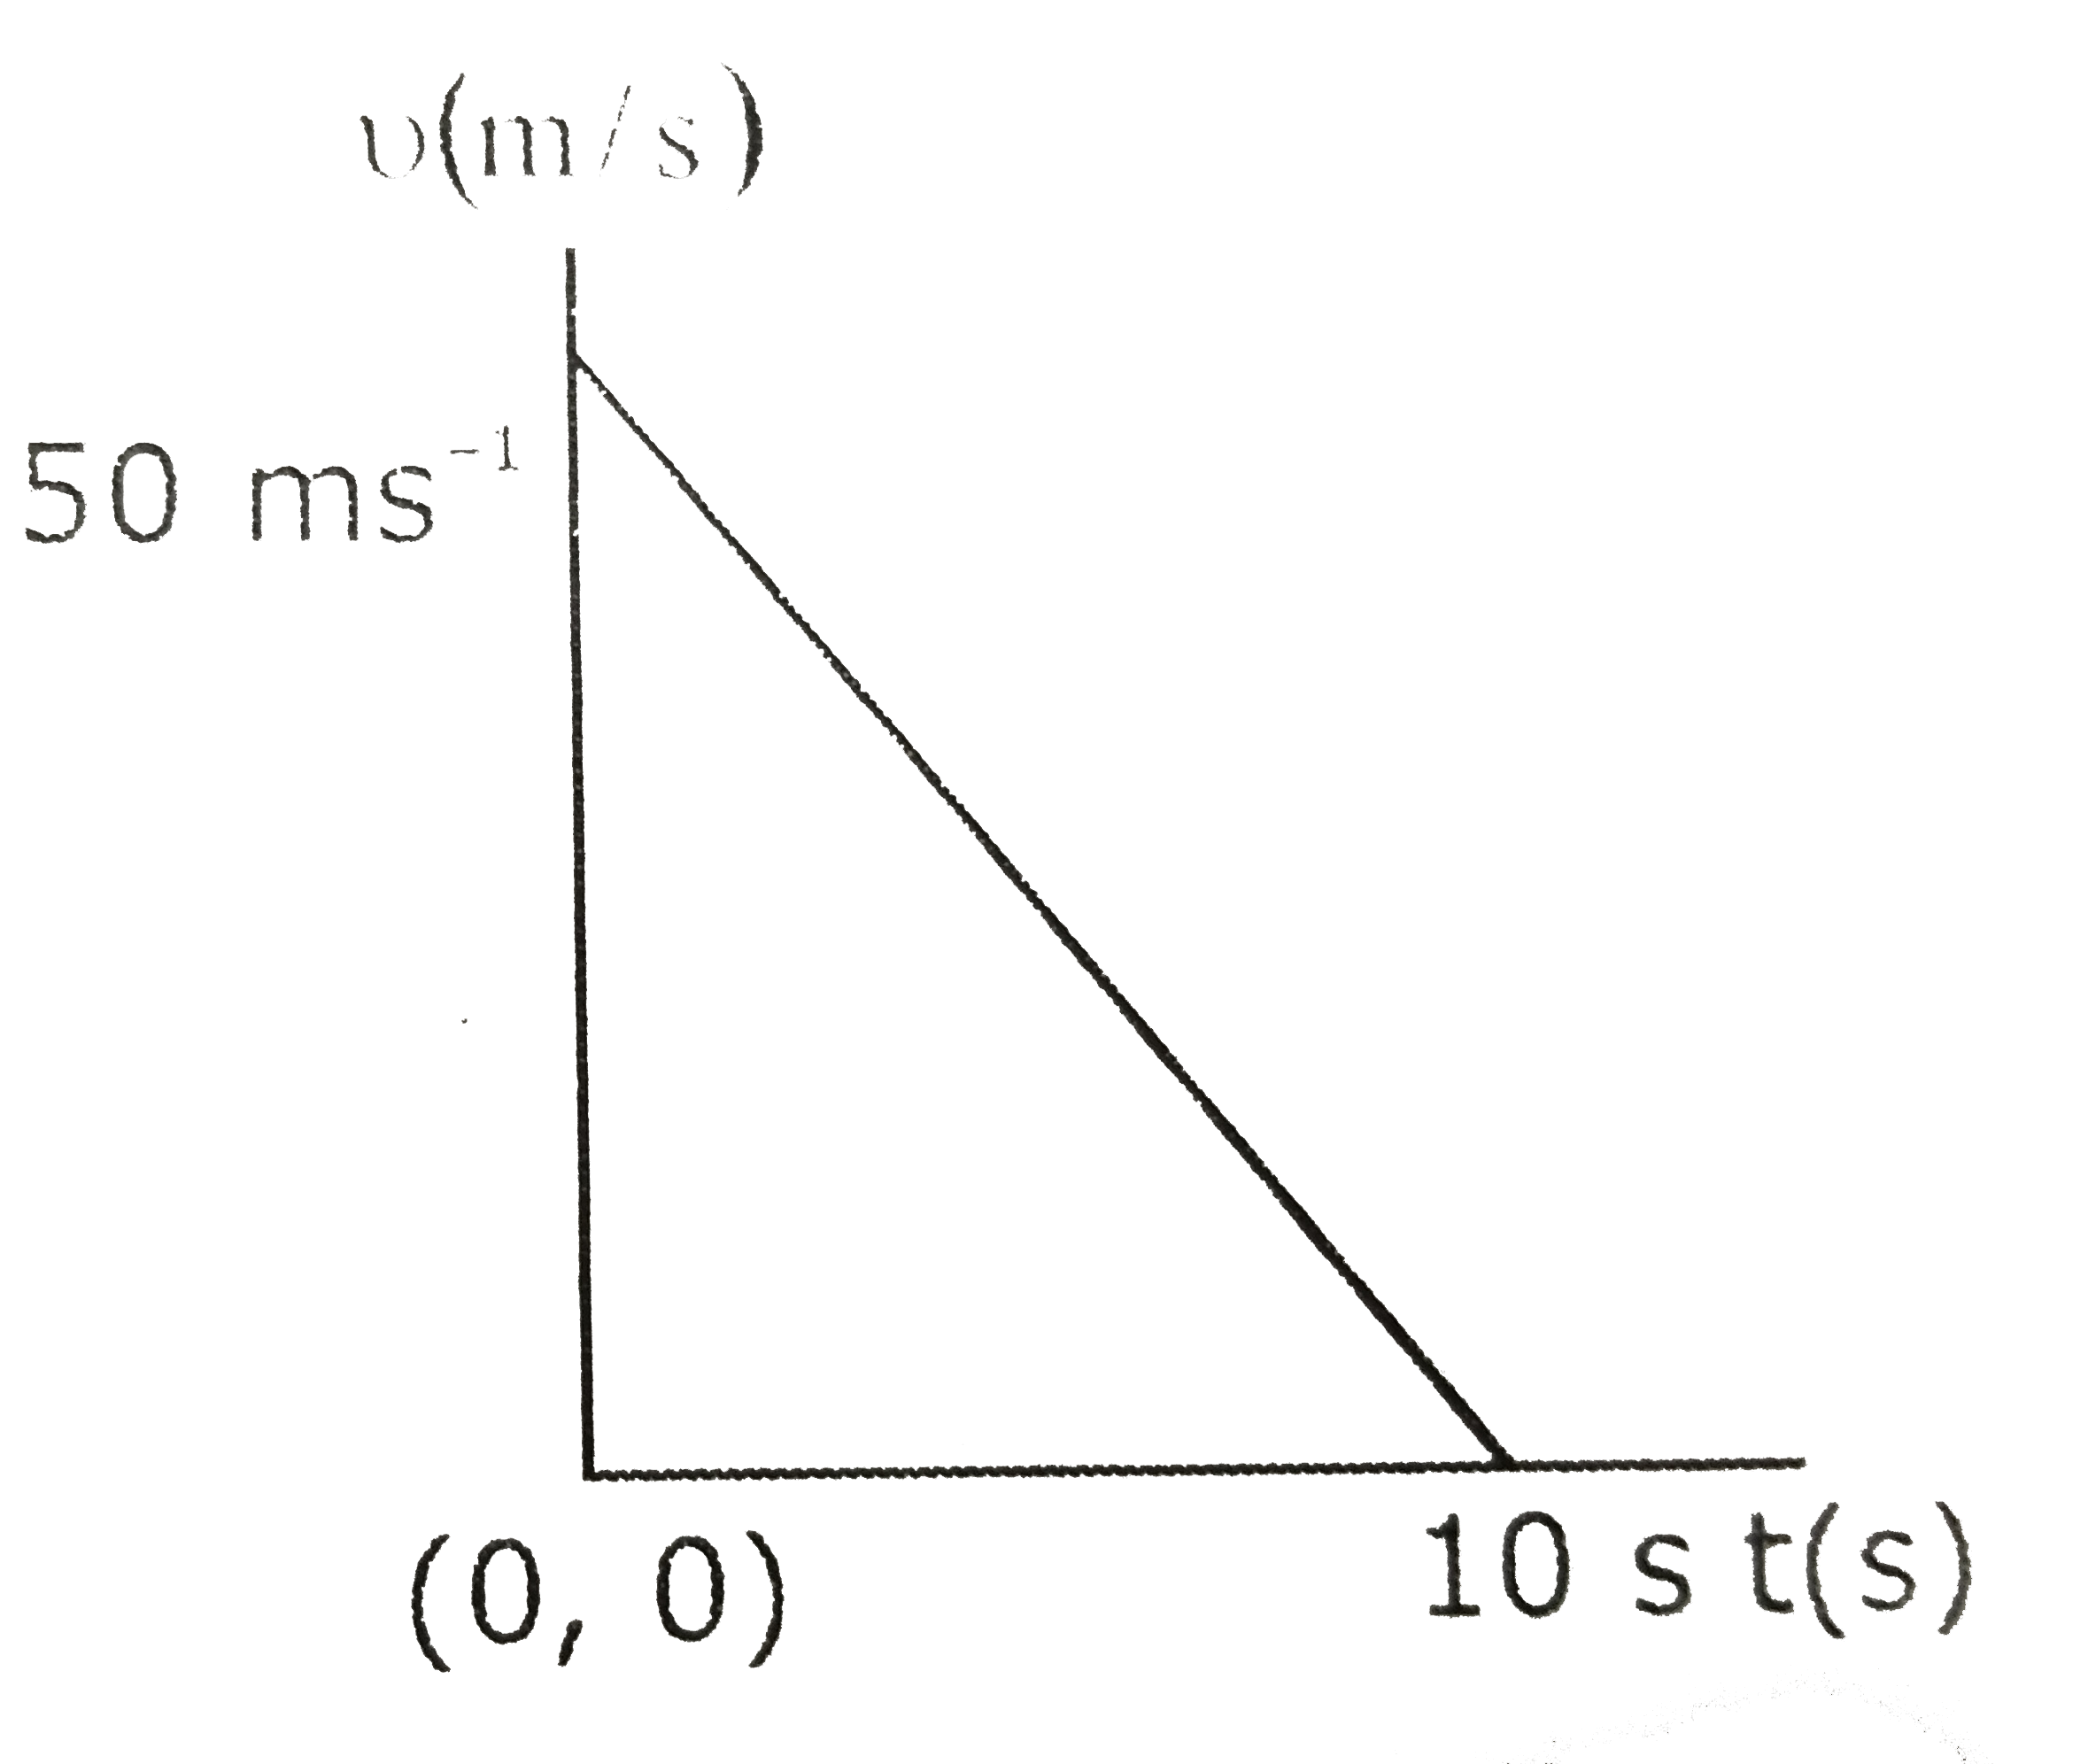
Velocity-time graph for the motion of a certain body is shown in fig.Explain the nature of this motion .Find the initial velocity and acceleration and write the equation for the variation of displacement with time.What happens to the moving body at point B?How will the body move after this moment?
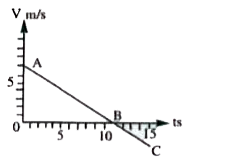
The velocity-time graph is a straight line with -ve slope.The motion is uniformly retarding up to point B and there after uniformly accelerated up to C.
At point B the body stops and the its direction of velocity reversed.
The intital velocity at point A is V0=7ms−1
∴a=vf−v0Δt=0−7ms−111s=−711ms−2=0.64ms2
The equation of motion for this body which gives variation of displacement with time is
S=7t−120.64t2=7t−0.32t2.
Similar Questions
Velocity-time graph for the motion of a certain body is shown in Fig. Explain the nature of this motion. Find the initial velocity and acceleration and write the equation for the variation of displacement with time. What happens to the moving body at point B? How does the body move after this moment ?
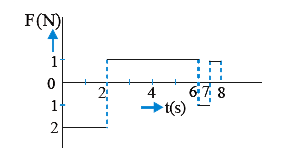
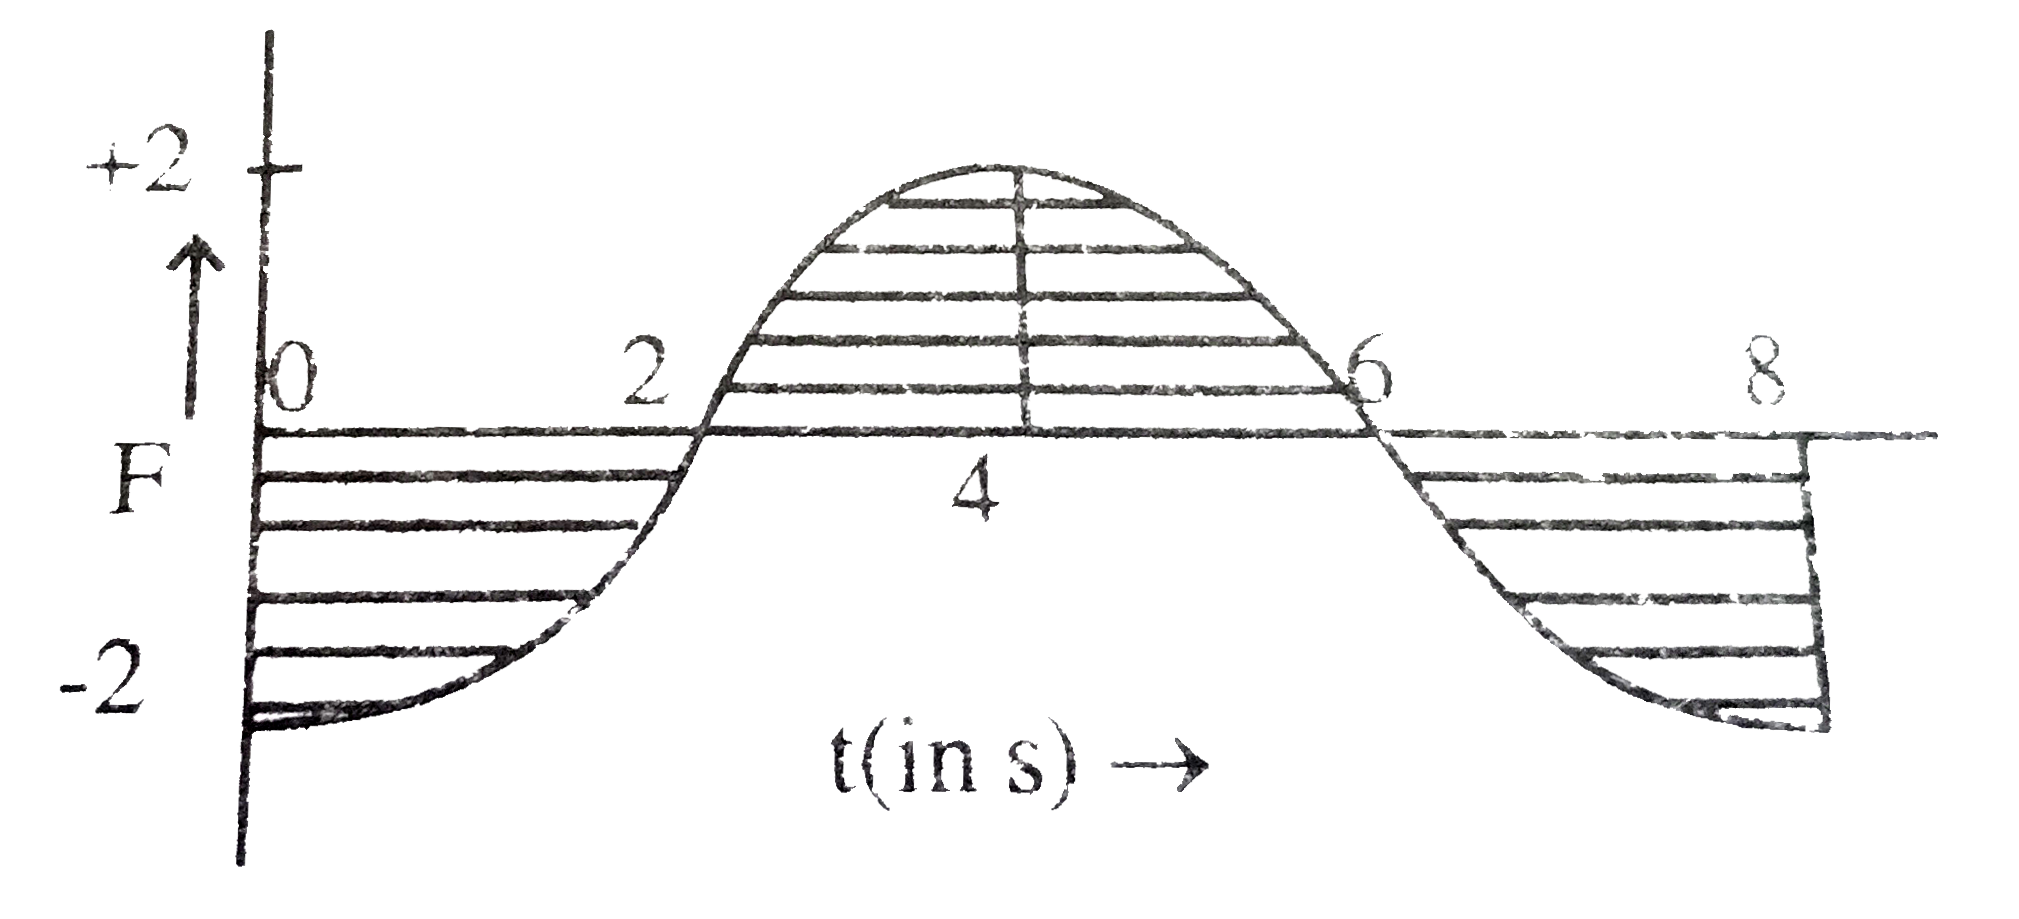
View SolutionA force-time graph for the motion of a body is shown in fig. Change in linear momentum between 0 and 8s is :
View Solution
Knowledge Check
The velocity time graph of a body is shown in fig. 3.3. it implies that at point B
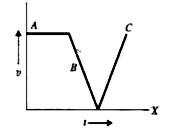 Athe force is zeroBthere is a force towards motionCthere is force which oppose motionDnone of the above
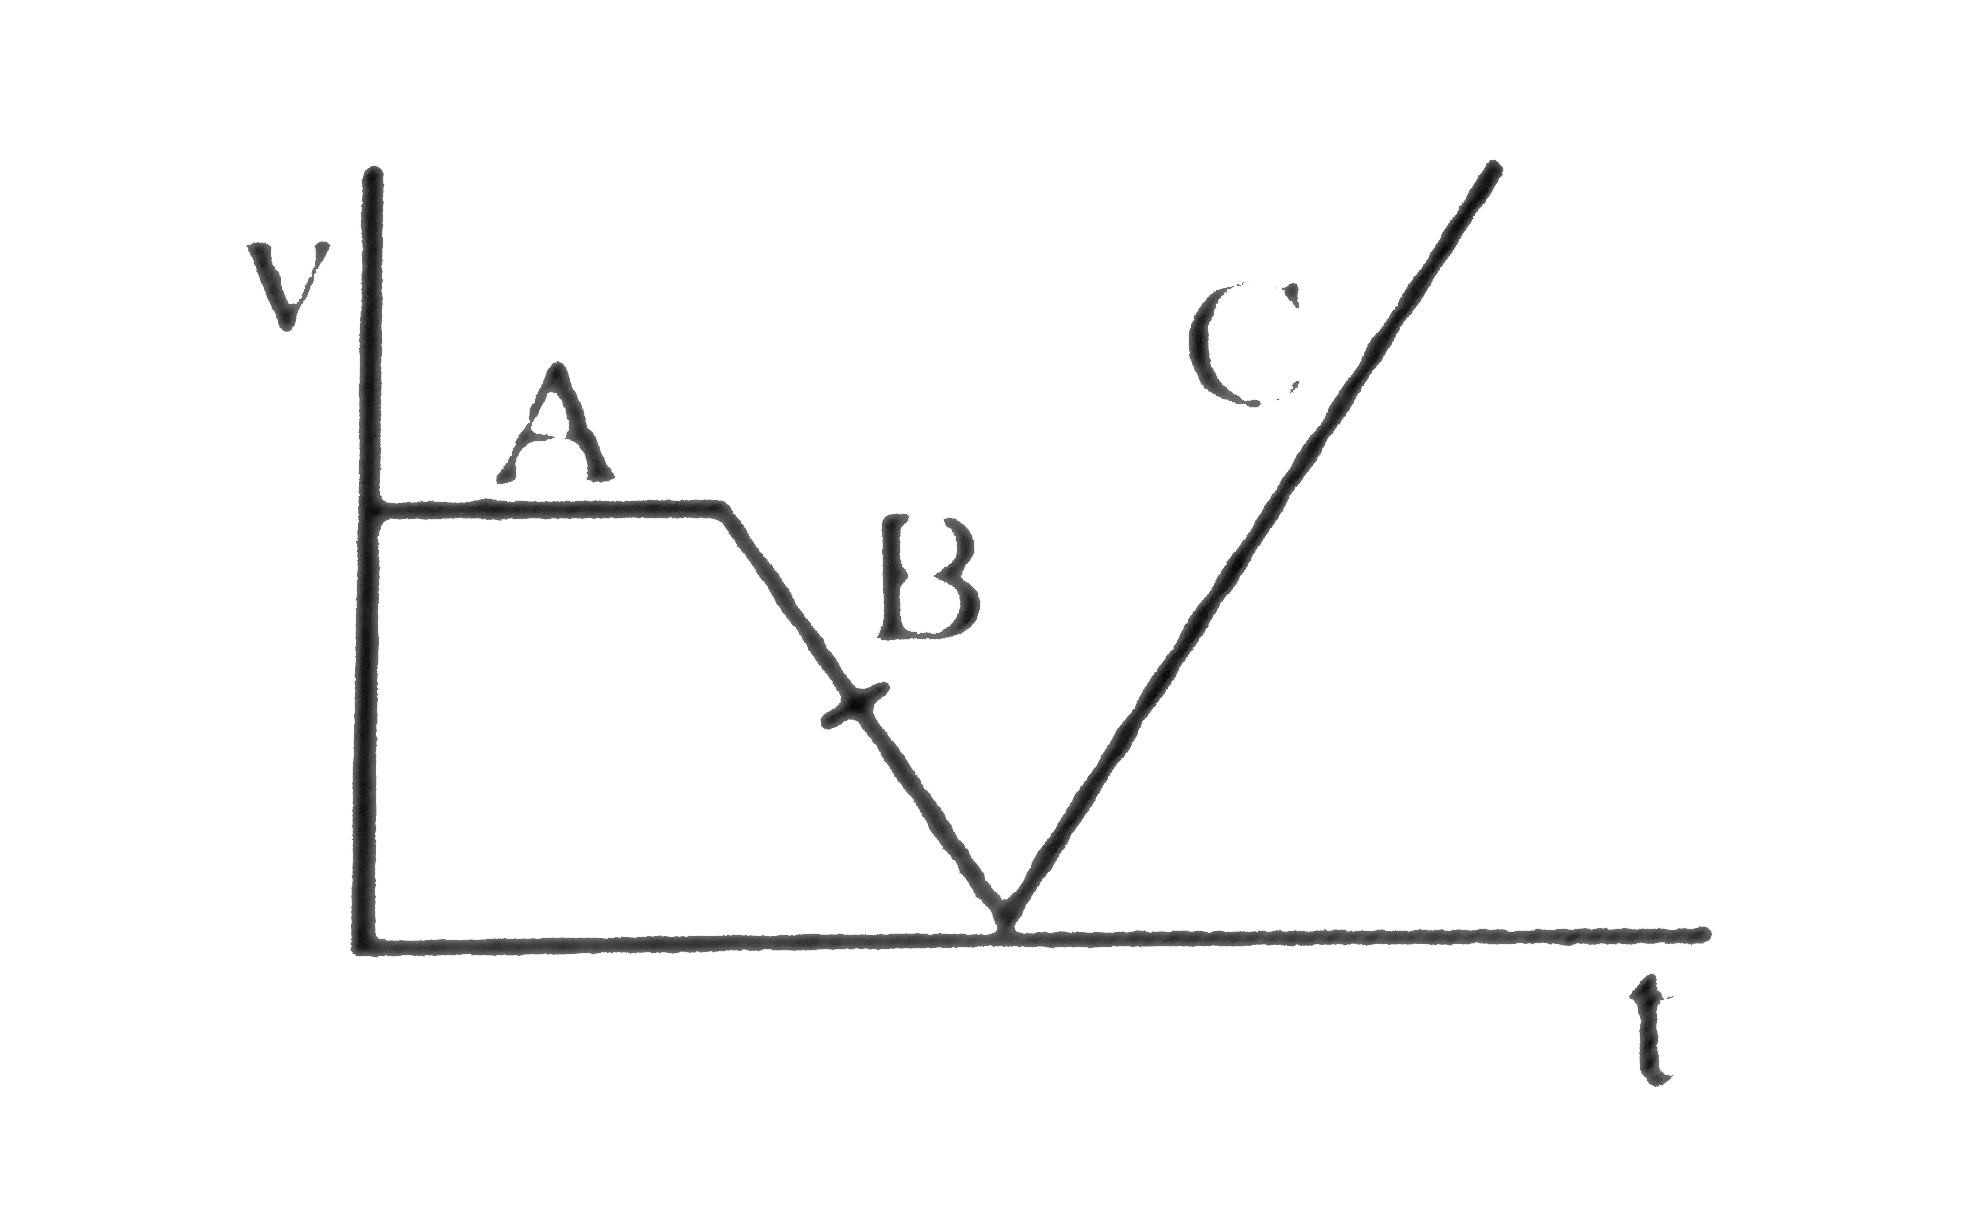
Velocity versus time graph of a body is shown in figure. It explains that
View SolutionA force-time graph for the motion of a body is shown in fig. change in linear momentum between 0 and 8 s is:-
View SolutionThe velocity time graph of a body is shown in fig. it indicates that :
View SolutionThe diagram in Fig. shows the displacement time graph of a vibrating body.
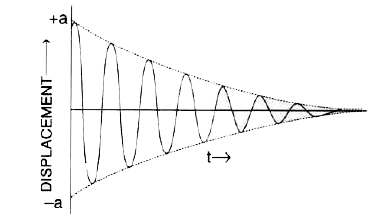
What happens to the vibrations of the body after some time?
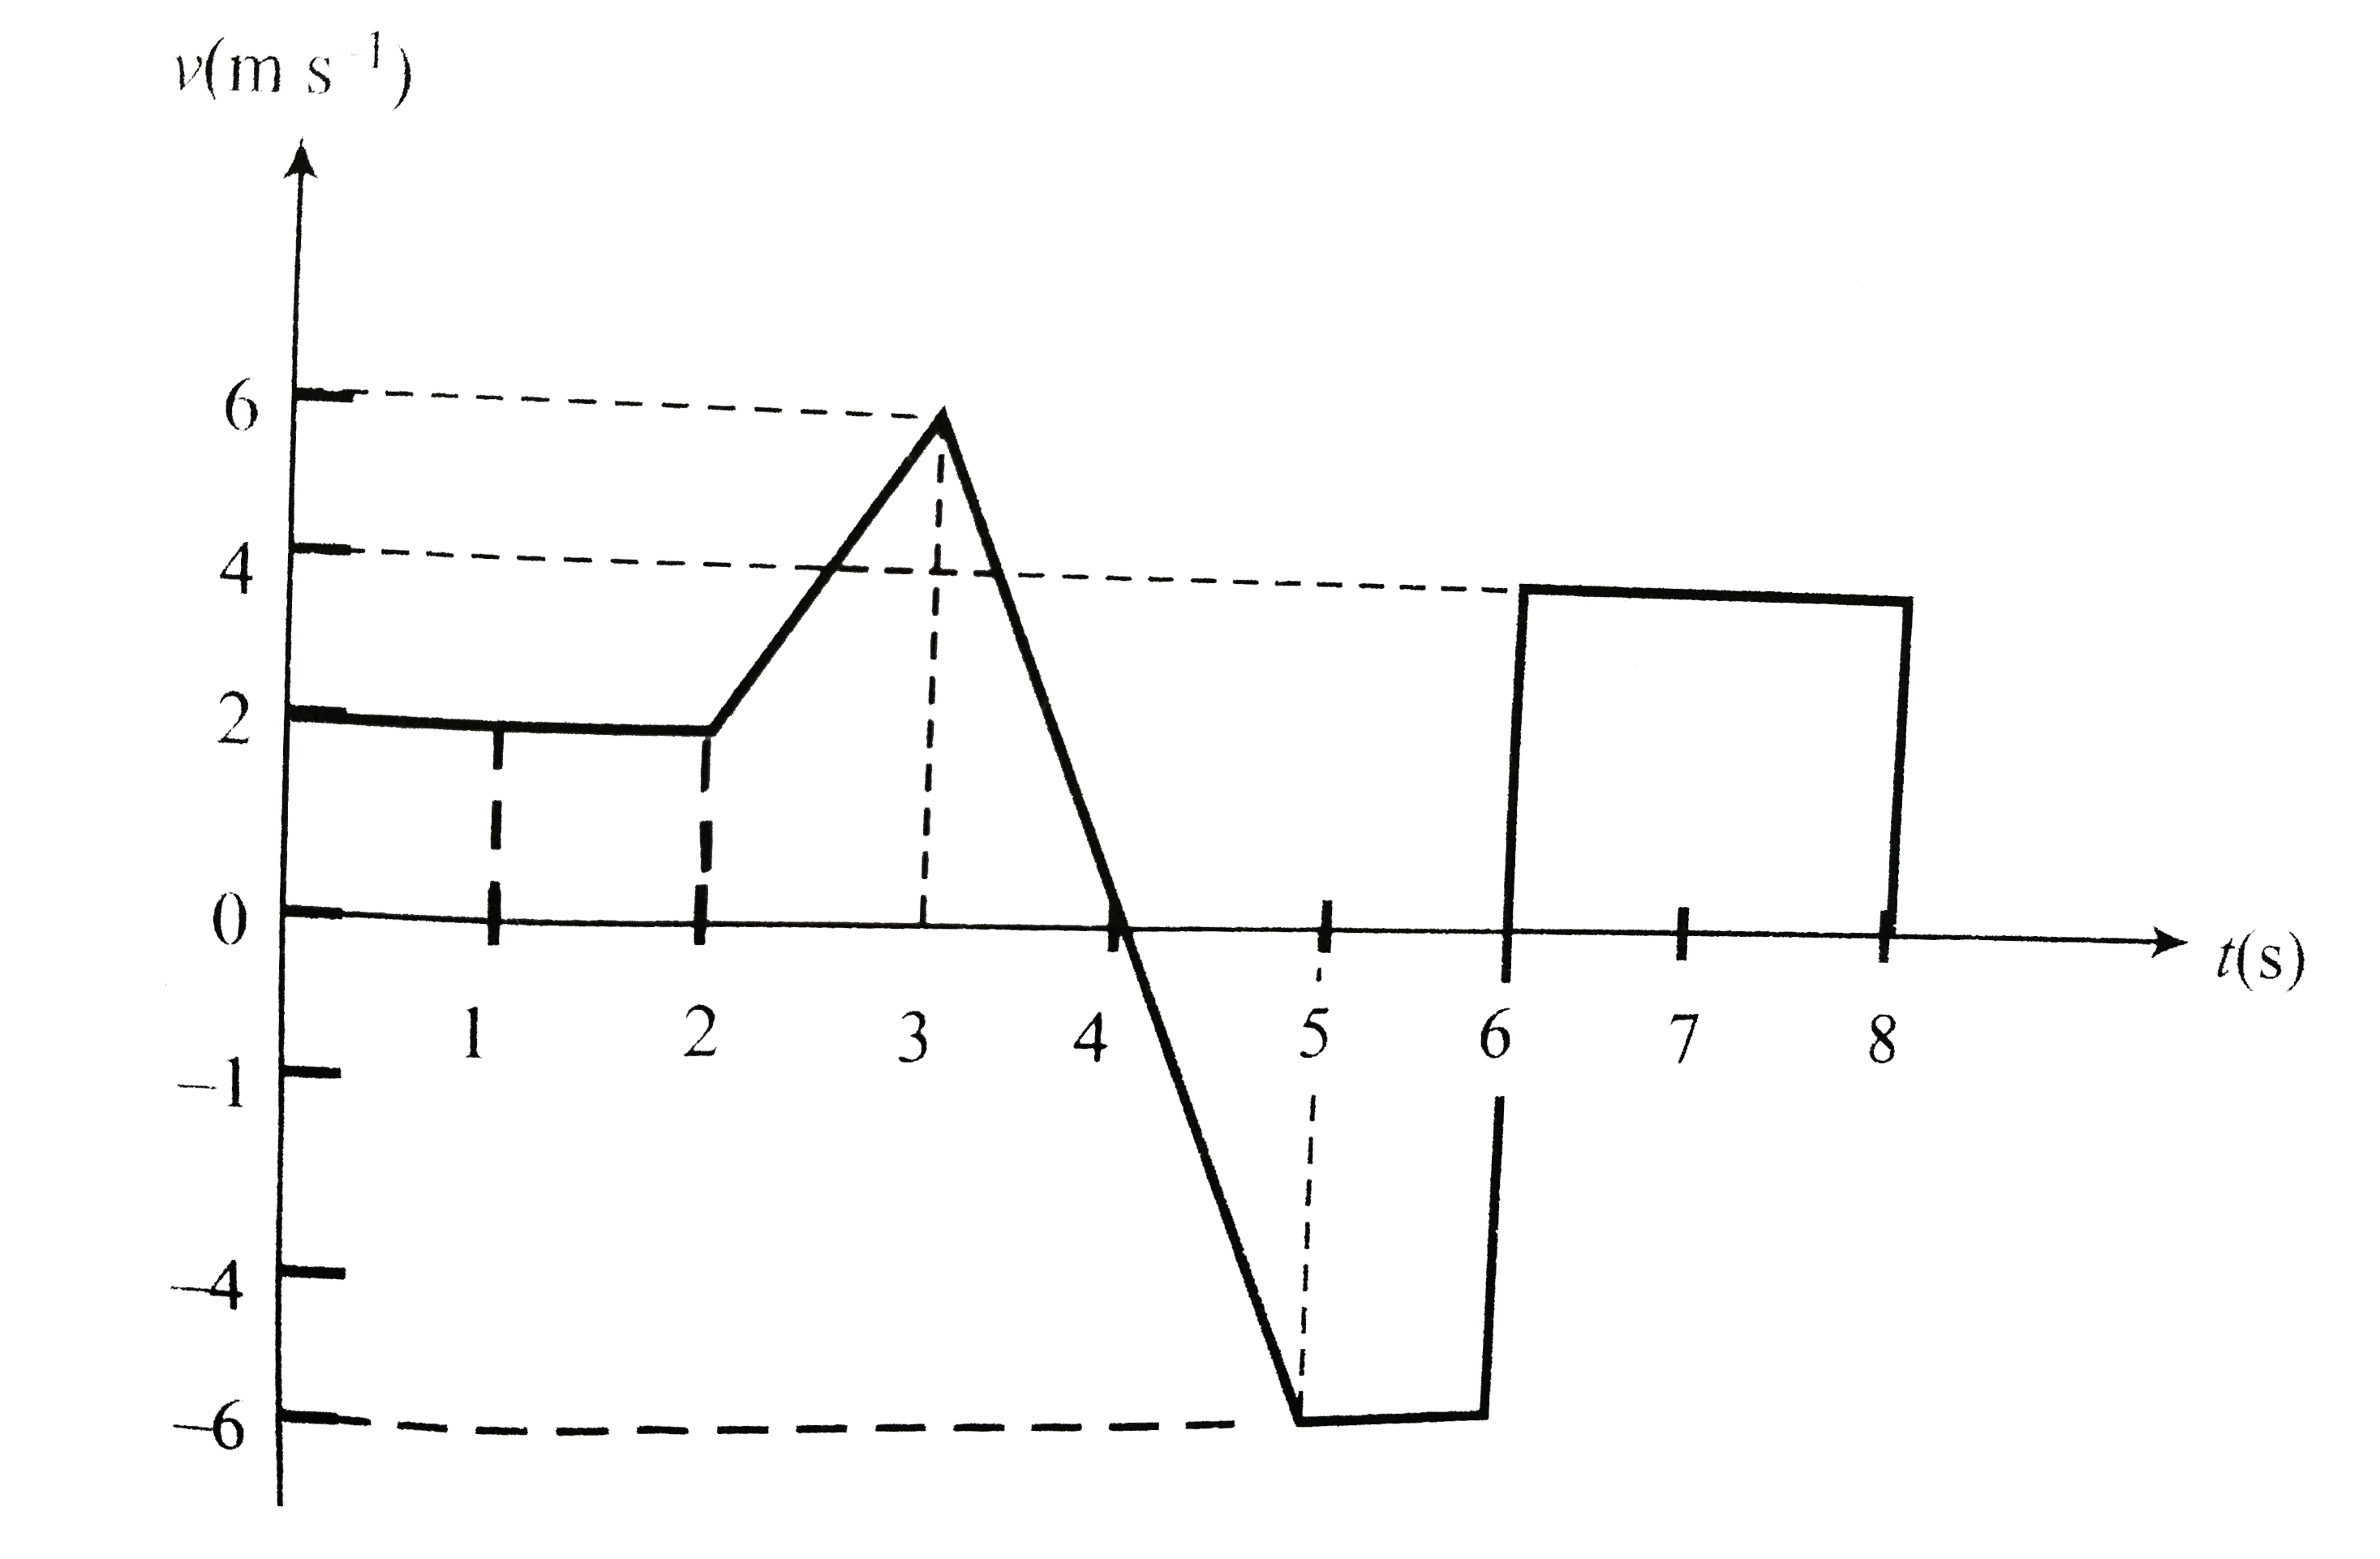
View SolutionThe velocity-time graph of a body is shown in .
The displacement of the body in 8s is.
 .
.
View SolutionVelocity -time graph for a body of mass 10 kg is shown in figure. Work -done on the body in first two seconds of the motion is :
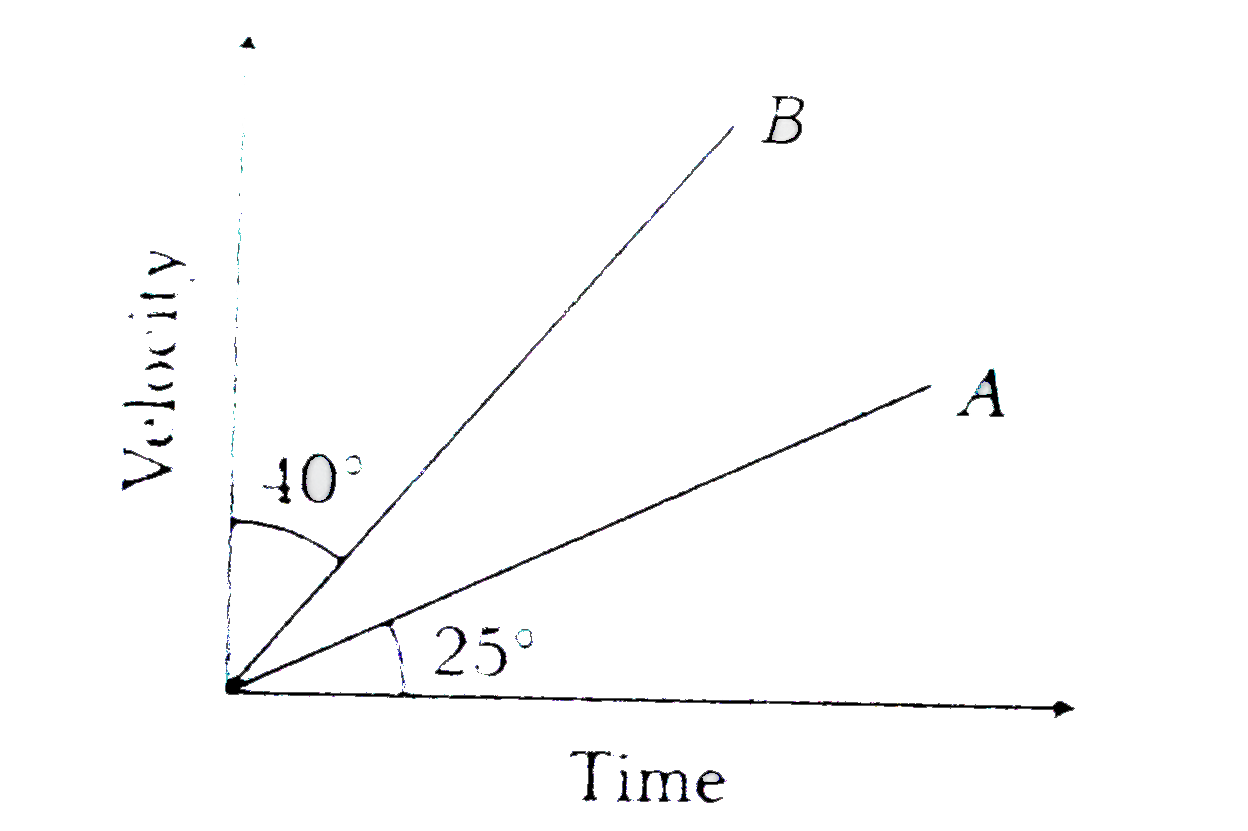
View SolutionThe velocity - time graph for two bodies A and B are shown in figure. Then, the acceleration of A and B are in the ratio
View Solution
