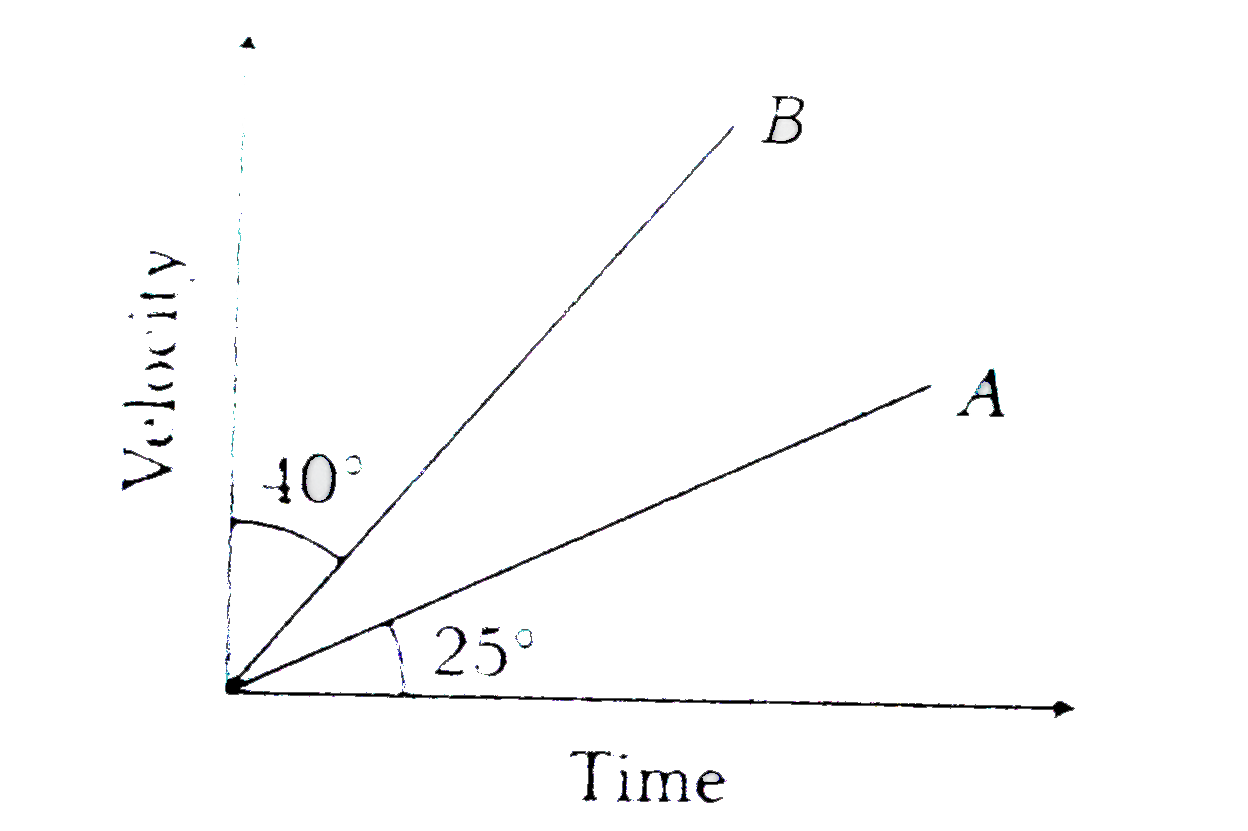
The velocity - time graph for two bodies A and B are shown in figure. Then, the acceleration of A and B are in the ratio
sin25∘ to sin50∘
tan25∘ to tan40∘
cos25∘ to cos50∘
tan25∘ to tan50∘
The correct Answer is:D
The slope of velocity-time graph gives acceleration,
i.e., aAaB=tanθ1tanθ2
⇒aAaB=tan25∘tan50∘
Topper's Solved these Questions
- MOTION IN A PLANEBOOK - DC PANDEY ENGLISHCHAPTER - MOTION IN A PLANEEXERCISE - (B) Meical entrance special format questions (Mathch the columns)
6 Videos
- MOTIONBOOK - DC PANDEY ENGLISHCHAPTER - MOTIONEXERCISE - Medical entrances gallery
19 Videos
- PROJECTILE MOTIONBOOK - DC PANDEY ENGLISHCHAPTER - PROJECTILE MOTIONEXERCISE - Level - 2 Subjective
10 Videos
Similar Questions
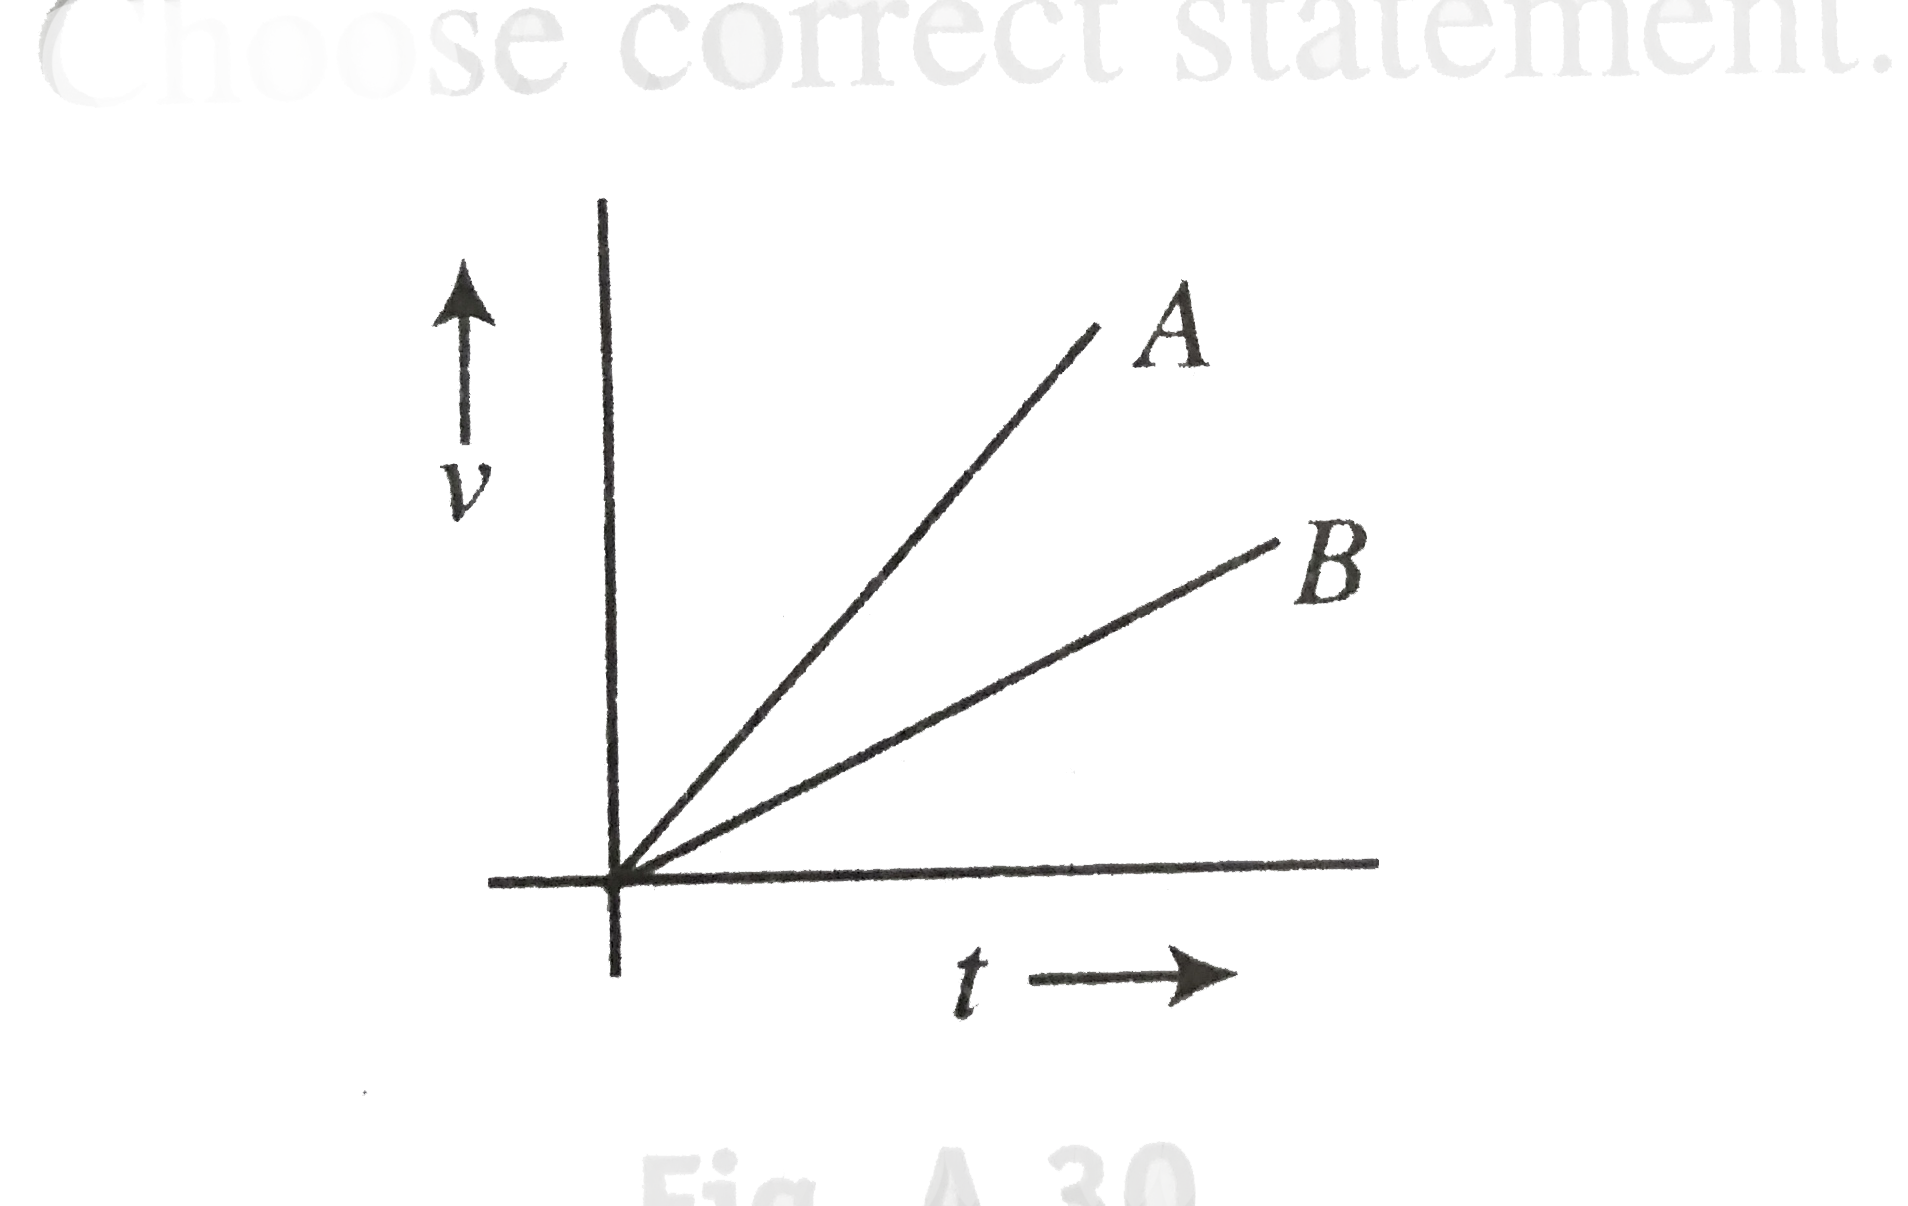
The velocity - time graph of two bodies A and B is shown in figure. Choose correct statement.
View Solution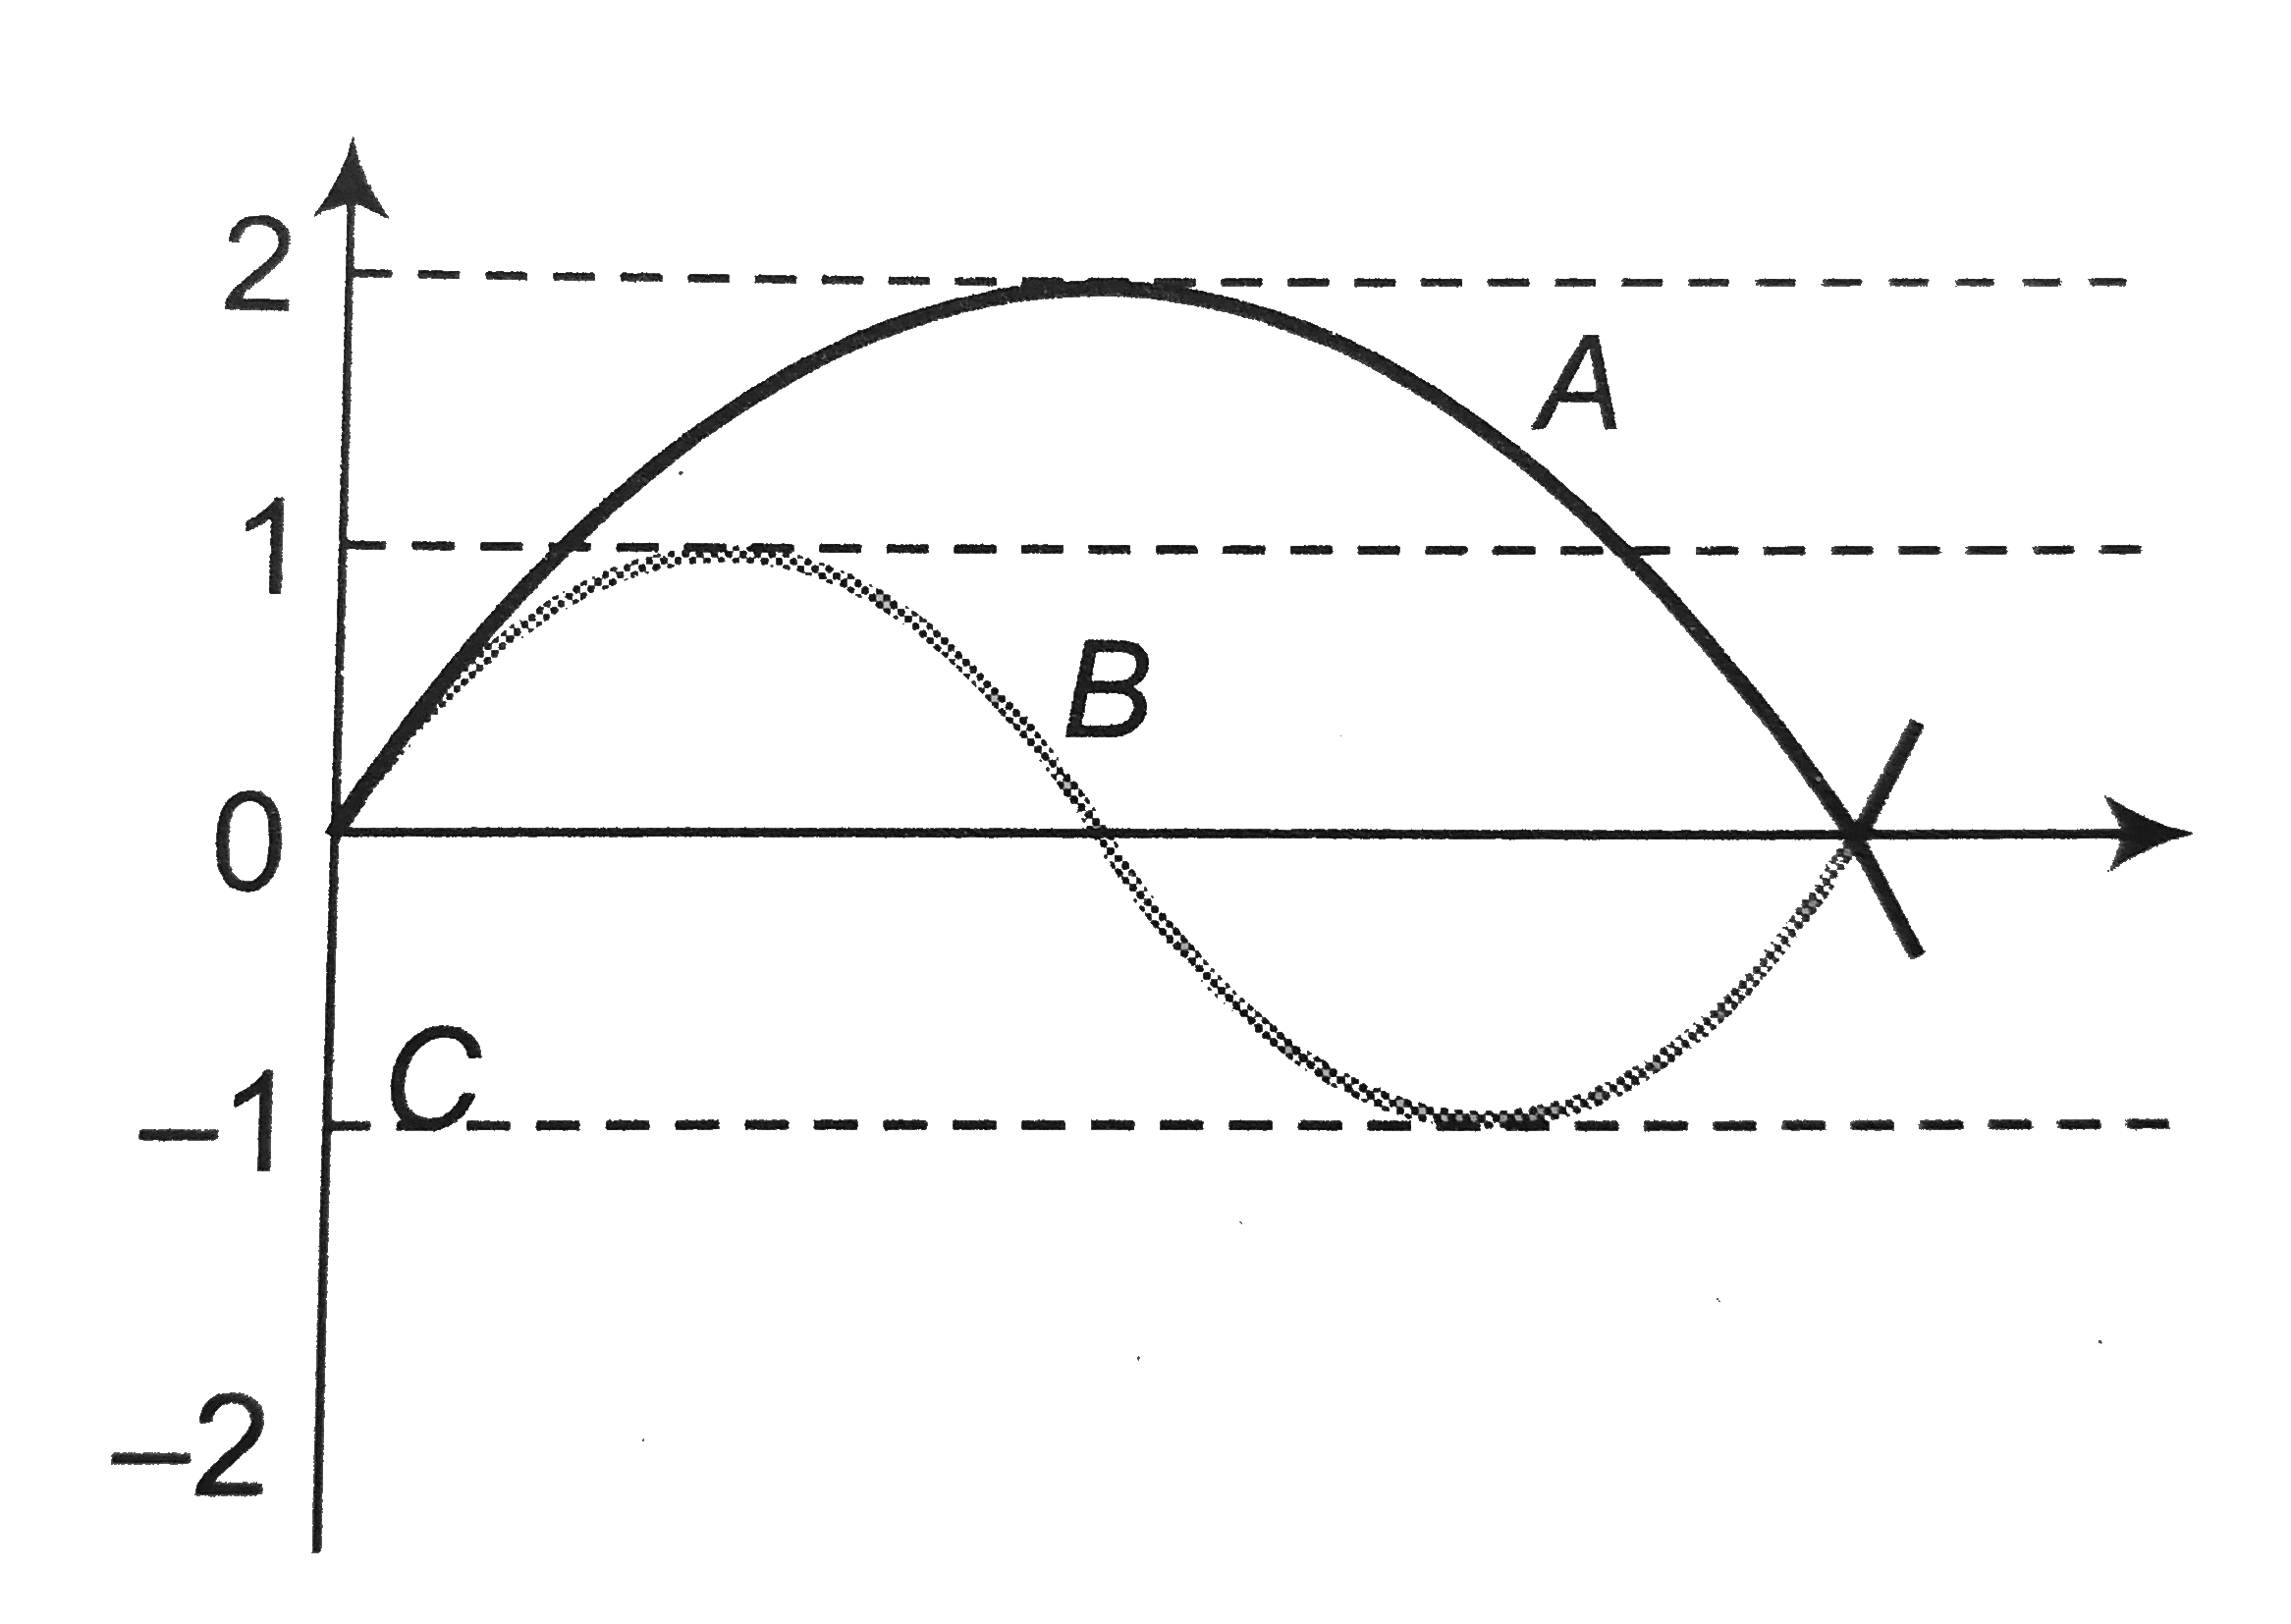
The displacement time graph for two sound waves A and B are shown in the figure. Then the ratio of their intensities IA/IB is equal to
View Solution
The displacement time graph for two sound waves A and B are shown in the figure. Then the ratio of their intensities IA/IB is equal to
View SolutionThe velocity − time graph of a particle is as shown in figure

View SolutionThe displacement time graphs of two bodies A and B are shown in figure. The ratio of velocity of A to velocity of B,vA/vB is:

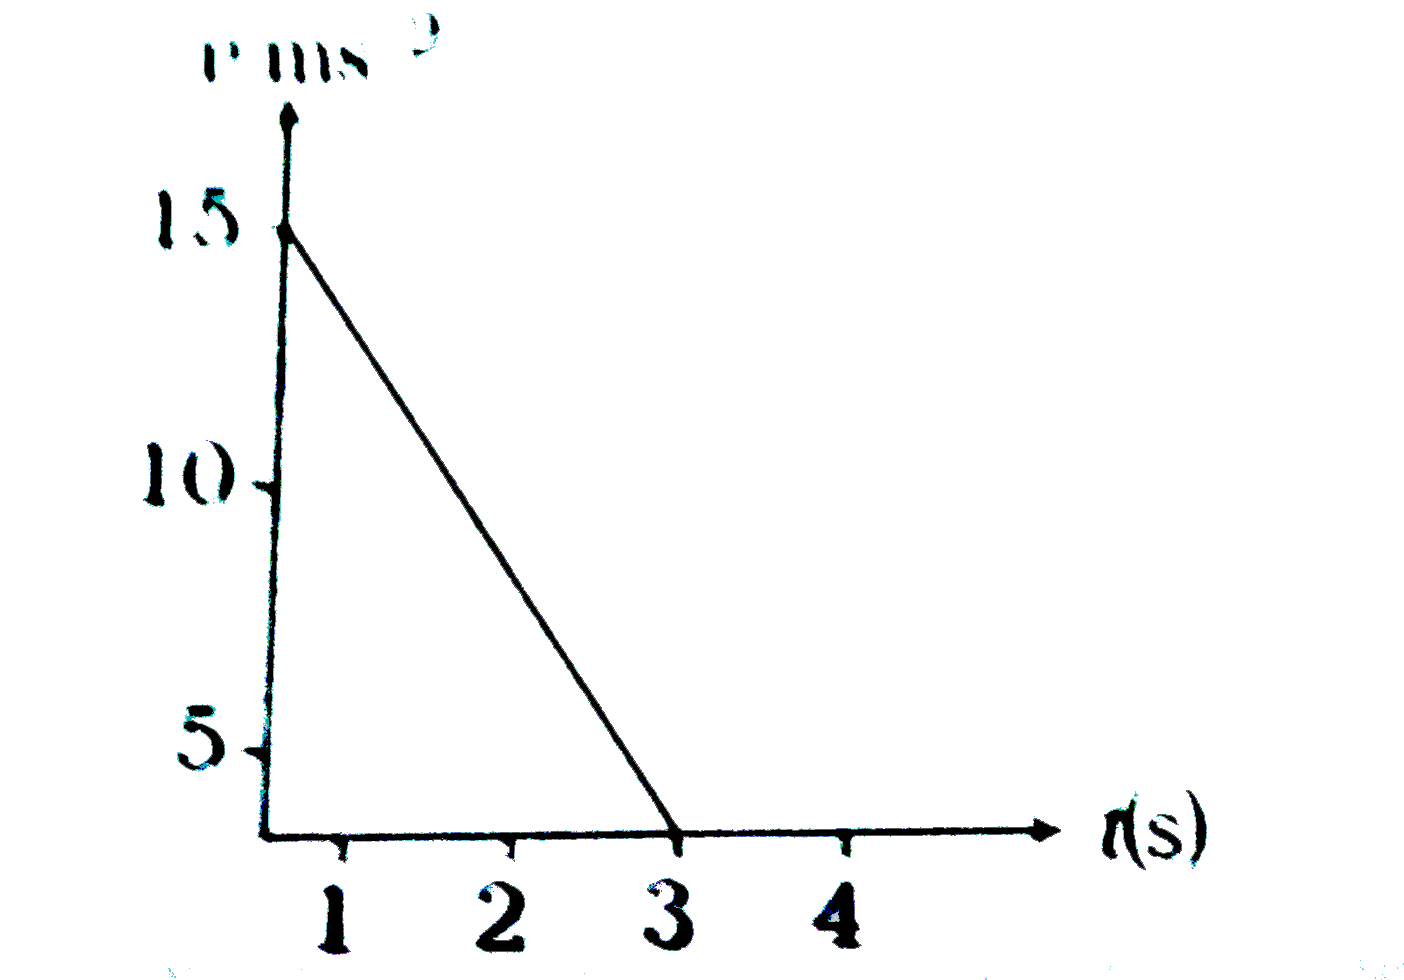
View SolutionThe velocity - time graph is shown in the figure, for a particle. The acceleration of particle is
View SolutionVelocity versus time graph of a body is shown in figure. It explains that
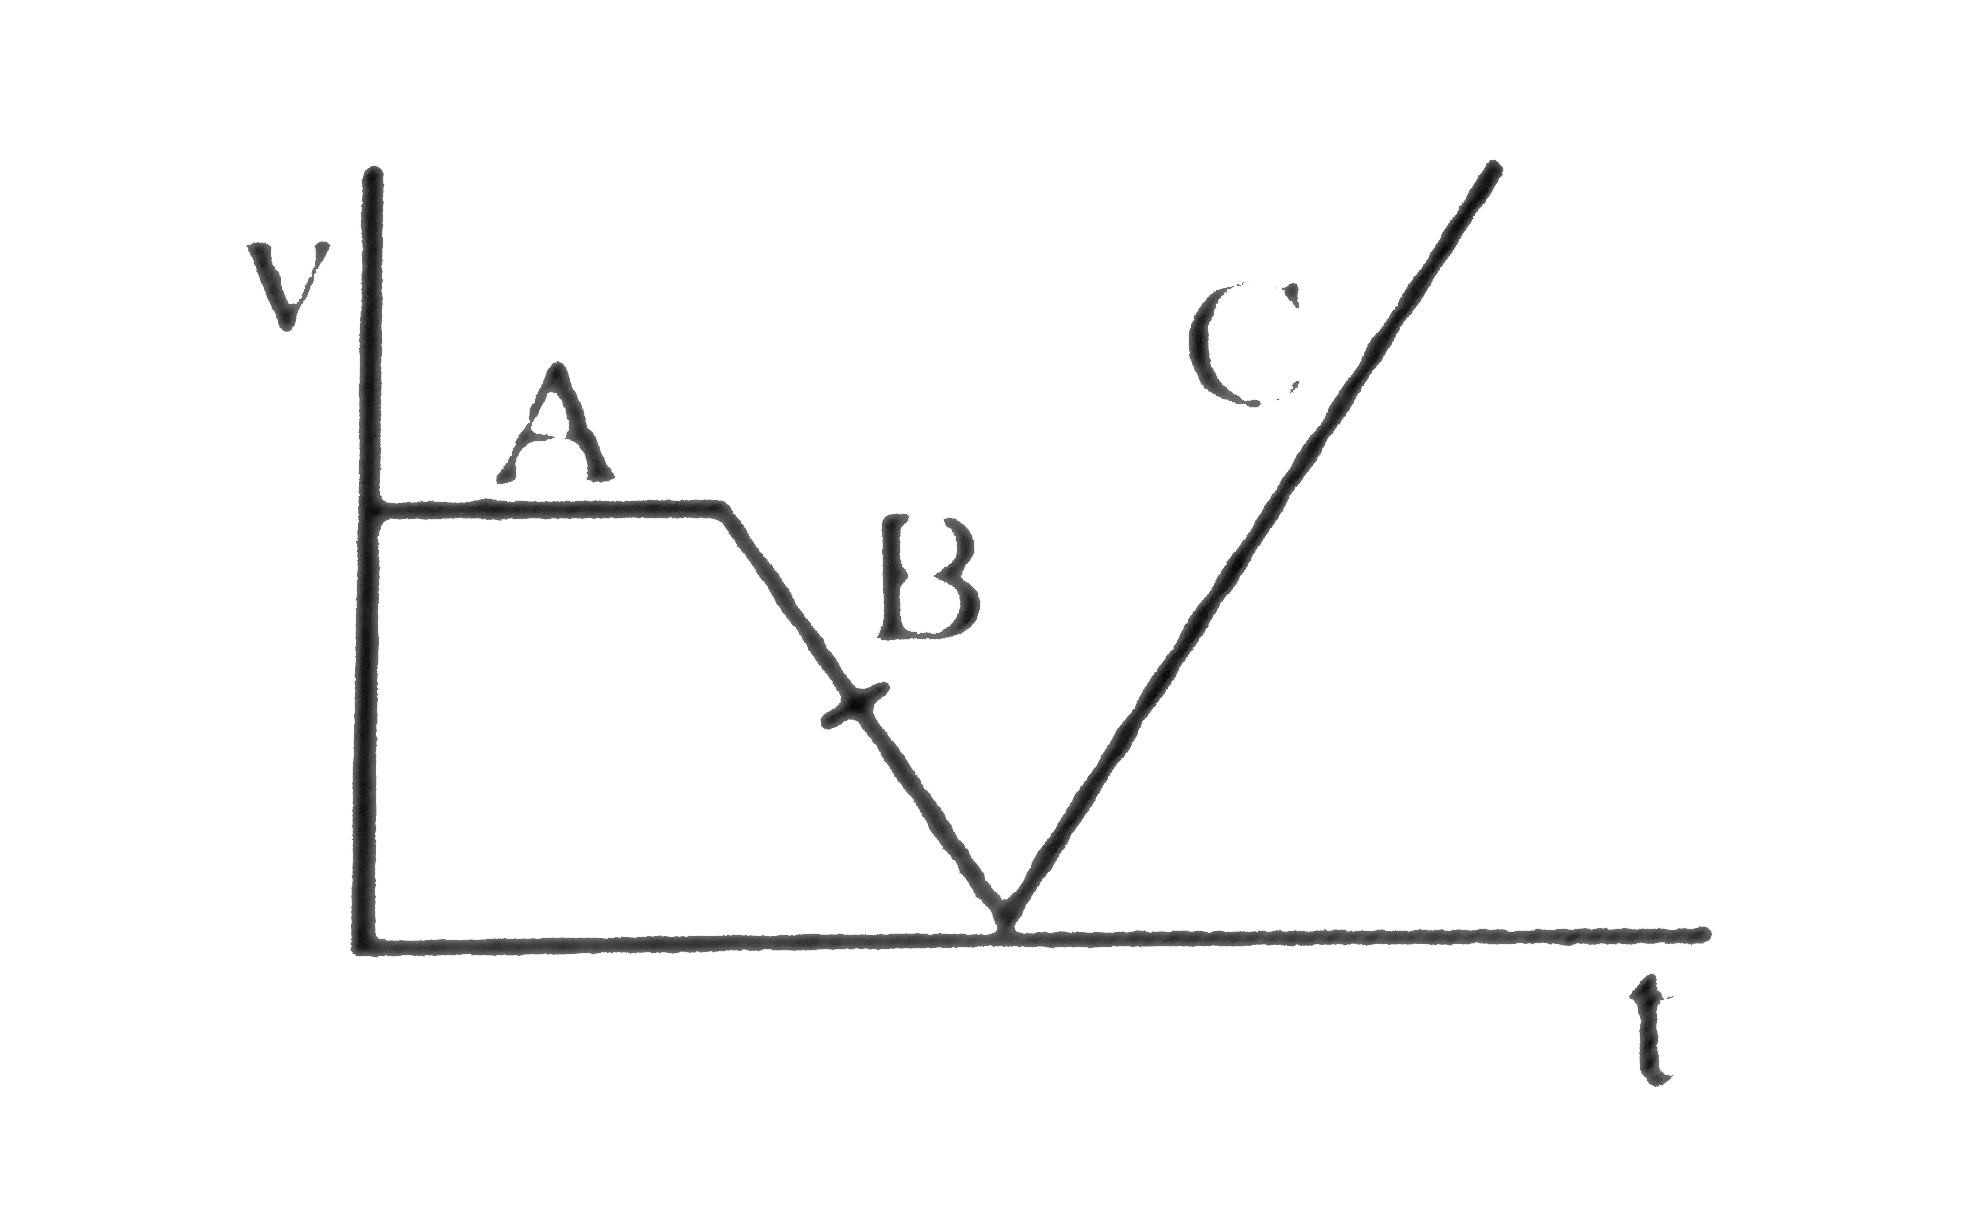
View SolutionThe velocity time graph of a body is shown in fig. it indicates that :
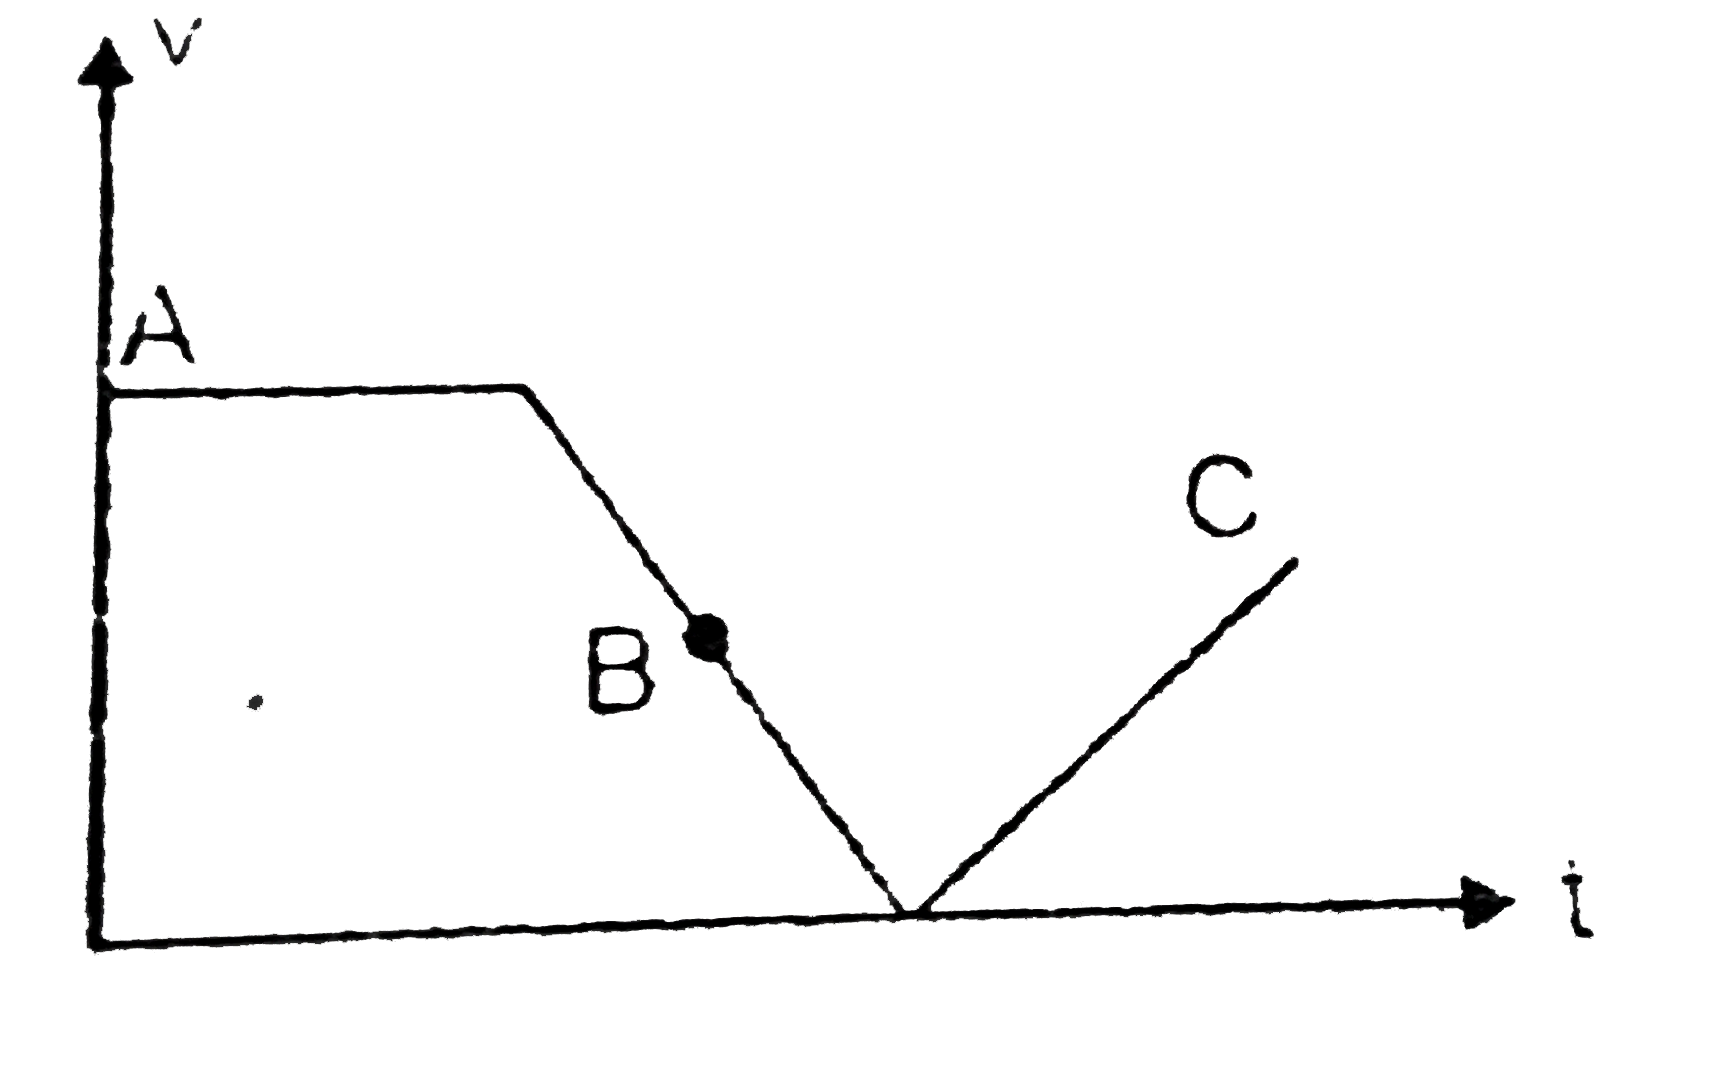
View Solutions-t graph of two particles A and B are shown in fig. Find the ratio of velocity of A to velocity of B.
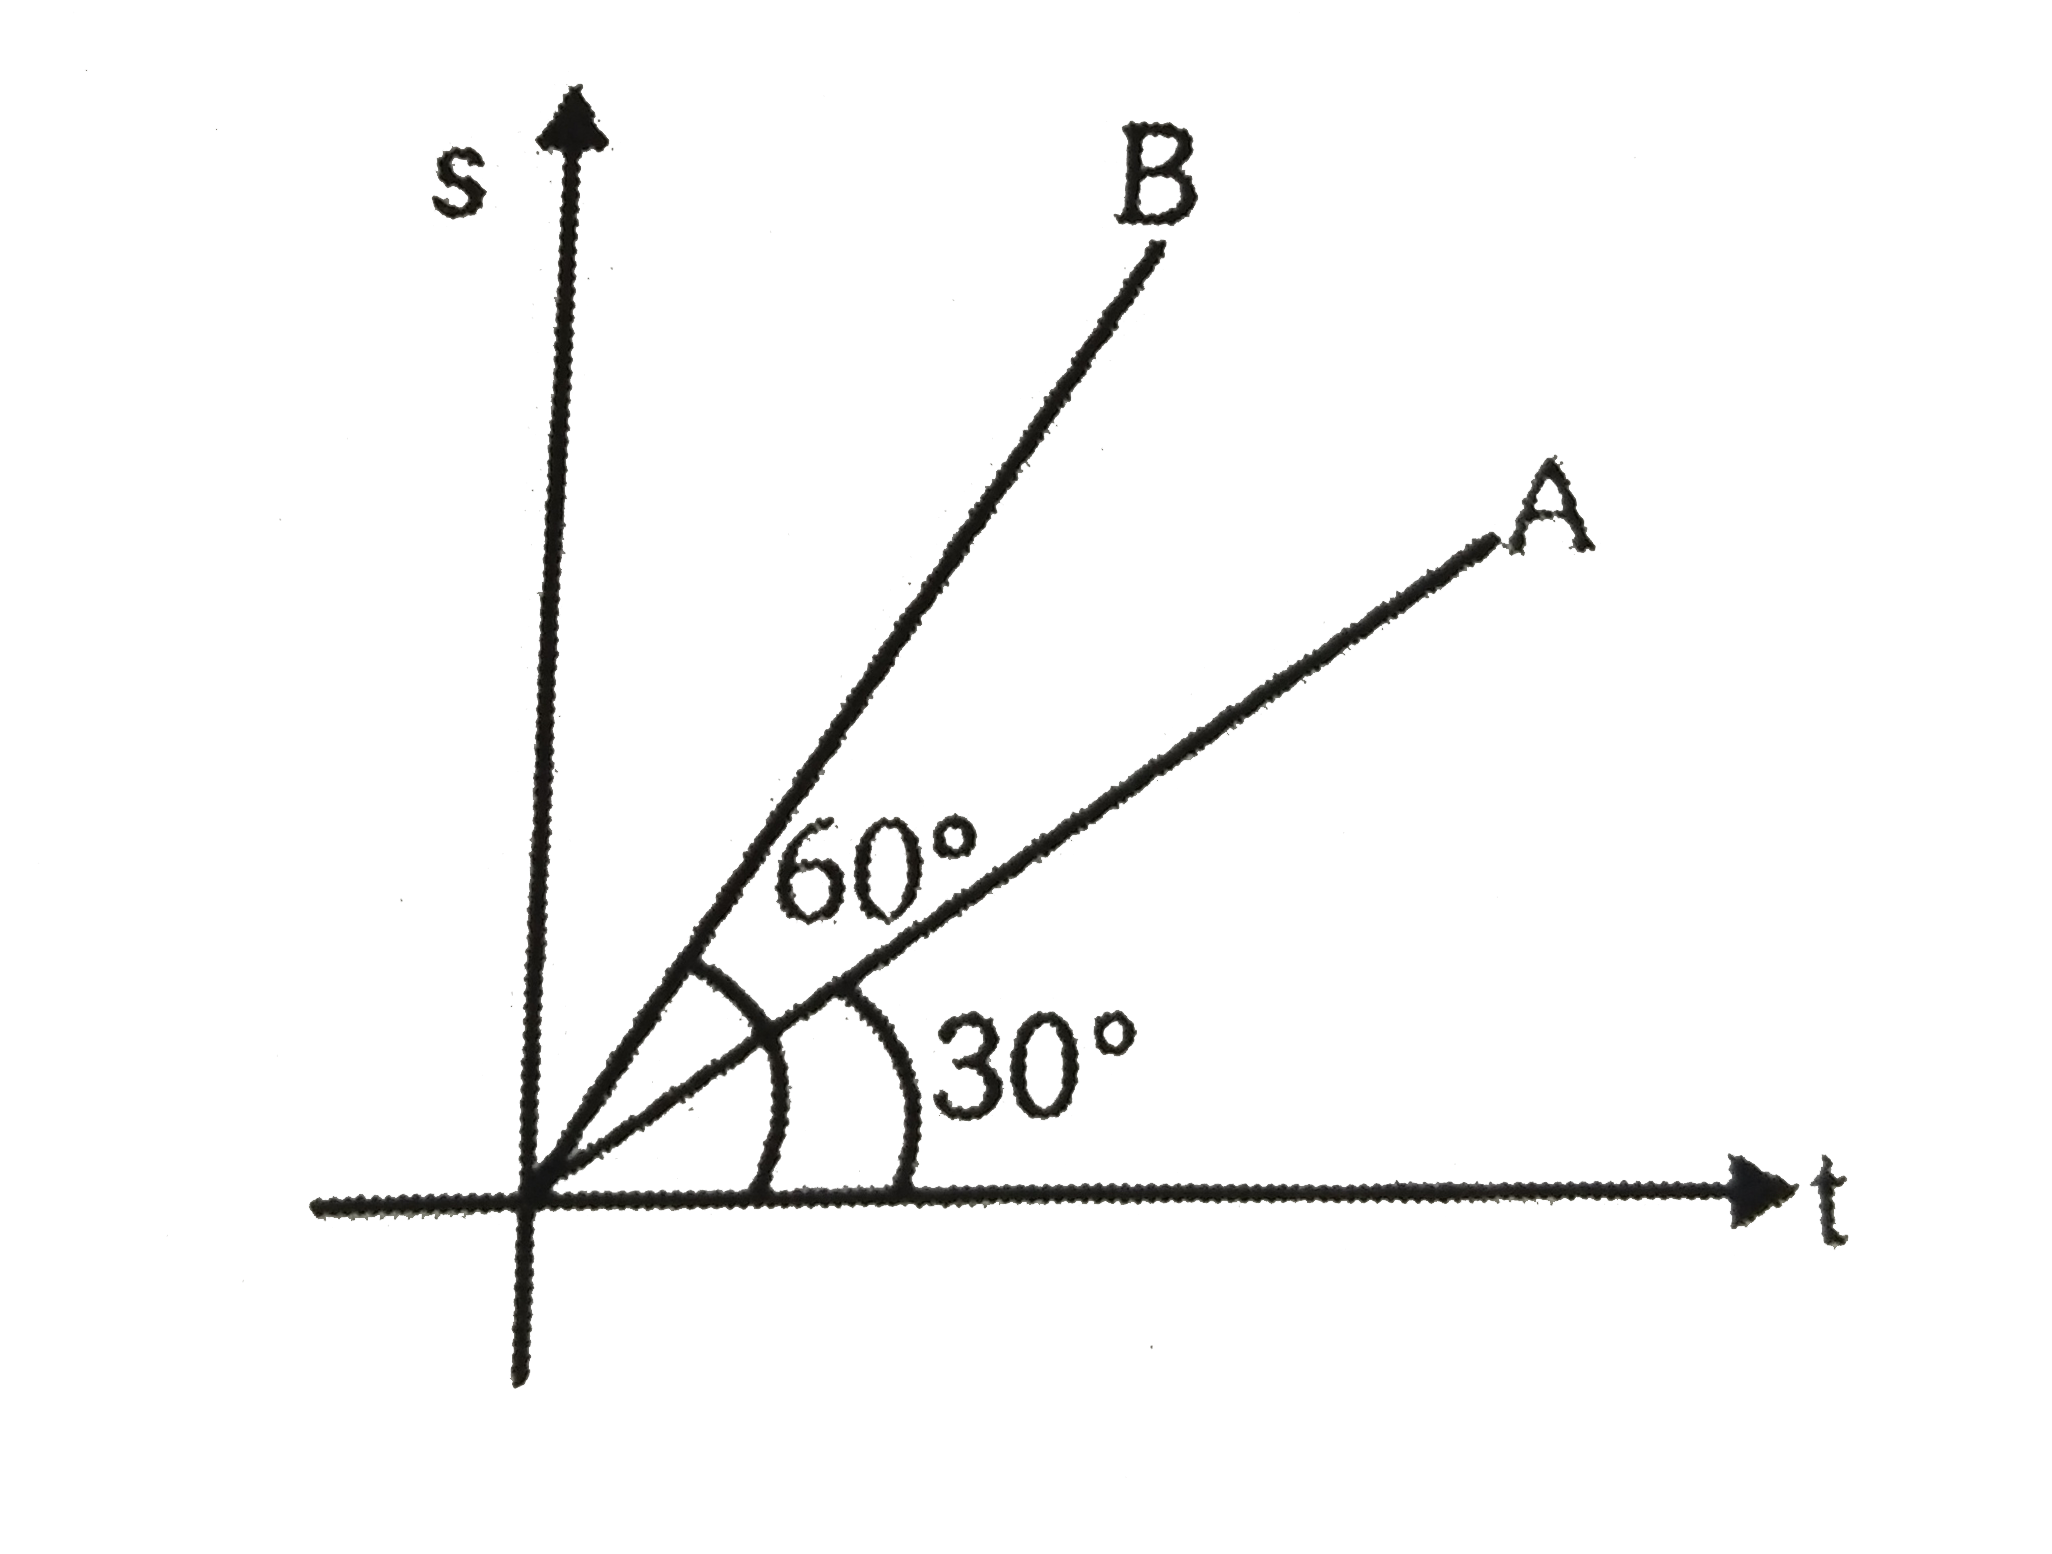
View SolutionThe speed - time graph for a body moving along a straight line is shown in figure. The average acceleration of body may be
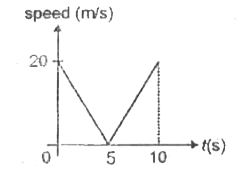
View Solution
