Study the given bar graph carefully and answer the questions based on it.
Production (in lakh tonne) of wheat from 2005-10
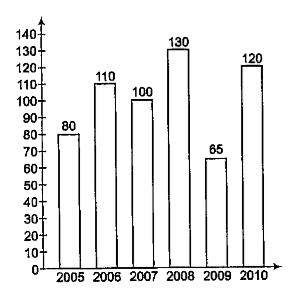
What is the mean production for all the years?
100.83 lakh tonne
110.5 lakh tonne
98.72 lakh tonne
None of the above
The correct Answer is:A
Step by step video, text & image solution for Study the given bar graph carefully and answer the questions based on it. Production (in lakh tonne) of wheat from 2005-10 What is the mean production for all the years? by Maths experts to help you in doubts & scoring excellent marks in Class 14 exams.
Updated on:21/07/2023Topper's Solved these Questions
- DATA HANDLING AND PATTERNSBook:ARIHANT PUBLICATION PUNJABChapter:DATA HANDLING AND PATTERNSExercise:Chapter Exercise
Explore 50 Videos
- DATA HANDLING Book:ARIHANT PUBLICATION PUNJABChapter:DATA HANDLING Exercise:CHAPTER EXERCISE
Explore 50 Videos
- ERROR ANALYSISBook:ARIHANT PUBLICATION PUNJABChapter:ERROR ANALYSISExercise:CHAPTER EXERCISE
Explore 25 Videos
Similar Questions
Read the following table carefully and answer the question given below-Production (in lakh tonnes)

What is the approximate percent of wheat in the total production from the year 2002 to 2006
View SolutionRead the following table carefully and answer the question given below-Production (in lakh tonnes)

What was the approximate percent increase in production of maize in the year 2004 from previous year?
View Solution
Knowledge Check
Study the given bar graph carefully and answer the questions based on it.
Production (in lakh tonne) of wheat from 2005-10
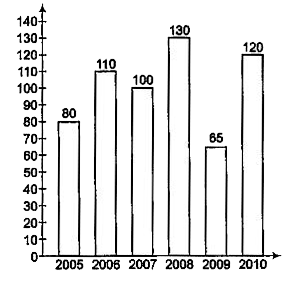
For which of the following year, wheat production is maximum?A2005B2006C2008D2010Study the given bar graph carefully and answer the questions based on it.
Production (in lakh tonne) of wheat from 2005-10
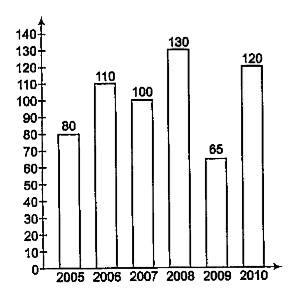
For which of the following year, wheat production is minimum?A2005B2007C2009D2008Study the given bar chart carefully and answer the questions based on it.
Bar chart represents the production (in lakh tonne) of wheat from 2005 to 2010.
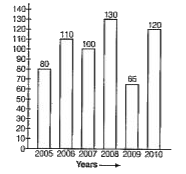
What is the mean production for all the years?A100.83 lakh tonneB110,5 lakh tonneC98.72 lakh tonneDNone of the above
Read the following table carefully and answer the question given below-Production (in lakh tonnes)

What was the percentage decrease in production of rice from the year 2002 to 2006 ?
View SolutionStudy the given bar chart carefully and answer the questions based on it.
Bar chart represents the production (in lakh tonne) of wheat from 2005 to 2010.
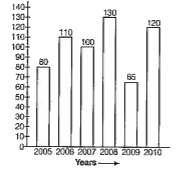
For which of the following year, wheat production is maximum?
View SolutionStudy the given bar chart carefully and answer the questions based on it.
Bar chart represents the production (in lakh tonne) of wheat from 2005 to 2010.
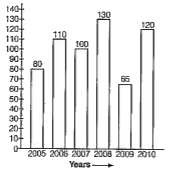
For which of the following year, wheat production is minimum?
View SolutionStudy the following graph carefully and answer the questions that
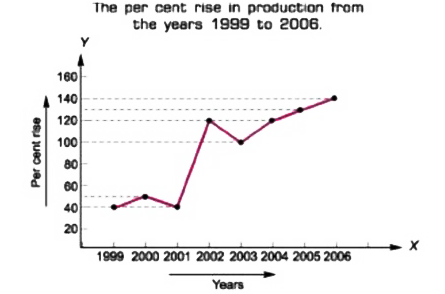
If the production in year 1998 was 1000 units , how much was the production in year 2002 ?
View SolutionStudy the following graph carefully and answer the questions that
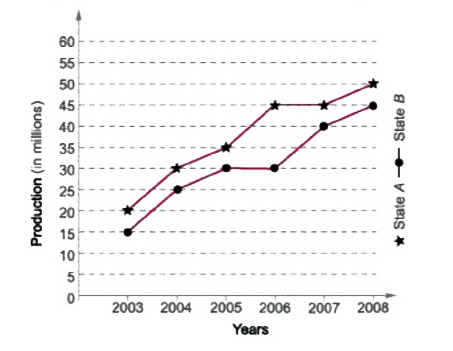
Population of State A in 2005 was what percent of its total population for all the years together ?
View Solution
