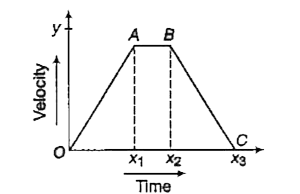
The figure denotes velocity-time graph, displace ment is equal to
y(x1+x2+x3)
y(x3−x1)
y(x3−x2−x1)
y2(x3+x2−x1)
The correct Answer is:D
The area enclosed between velocity-time curve and the time axis gives displacement.
OABC is trapezium. Side OC=X3, side
AB=(x2−x1)
Height = y
∴ Area =12× Height × (Sum of parallel side)
Area =12×y×(x3+x2−x1)
∴ Displacement =y2(x3+x2−x1)
Similar Questions
Acceleration-time graph of a moving object is shown in figure. Draw the velocity- time graph and displacement-time graph corresponding to this type of motion.
 .
.
View SolutionDraw the velocity-time graph for an object in uniform motion. Show that the area under the velocity-time graph gives the displacement of the object in the given time interval.
View Solution
Knowledge Check
Assertion: The displacement of a body is vector sum of the area under velocity-time graph.
Reason: Displacement is a vector quantity.AIf both assertion and reason are true and reason is the correct explanation of assertion.BIf both assertion and reason are true but reason is not the correct explanation of assertion.CIf assertion is true but reason is false.DIf assersion is false but reason is true.The figure shows a velocity-time graph of a particle moving along a straight line
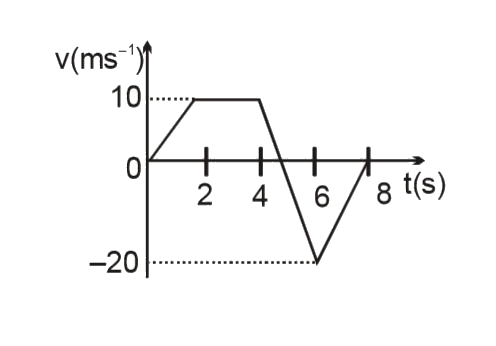
Q. The correct displacement-time graph of the particle is shown asA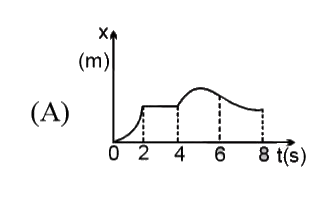 B
B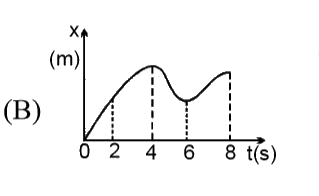 C
C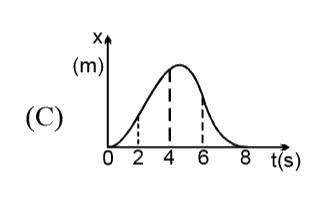 D
D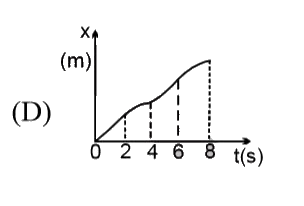
The figure shows a velocity-time graph of a particle moving along a straight line
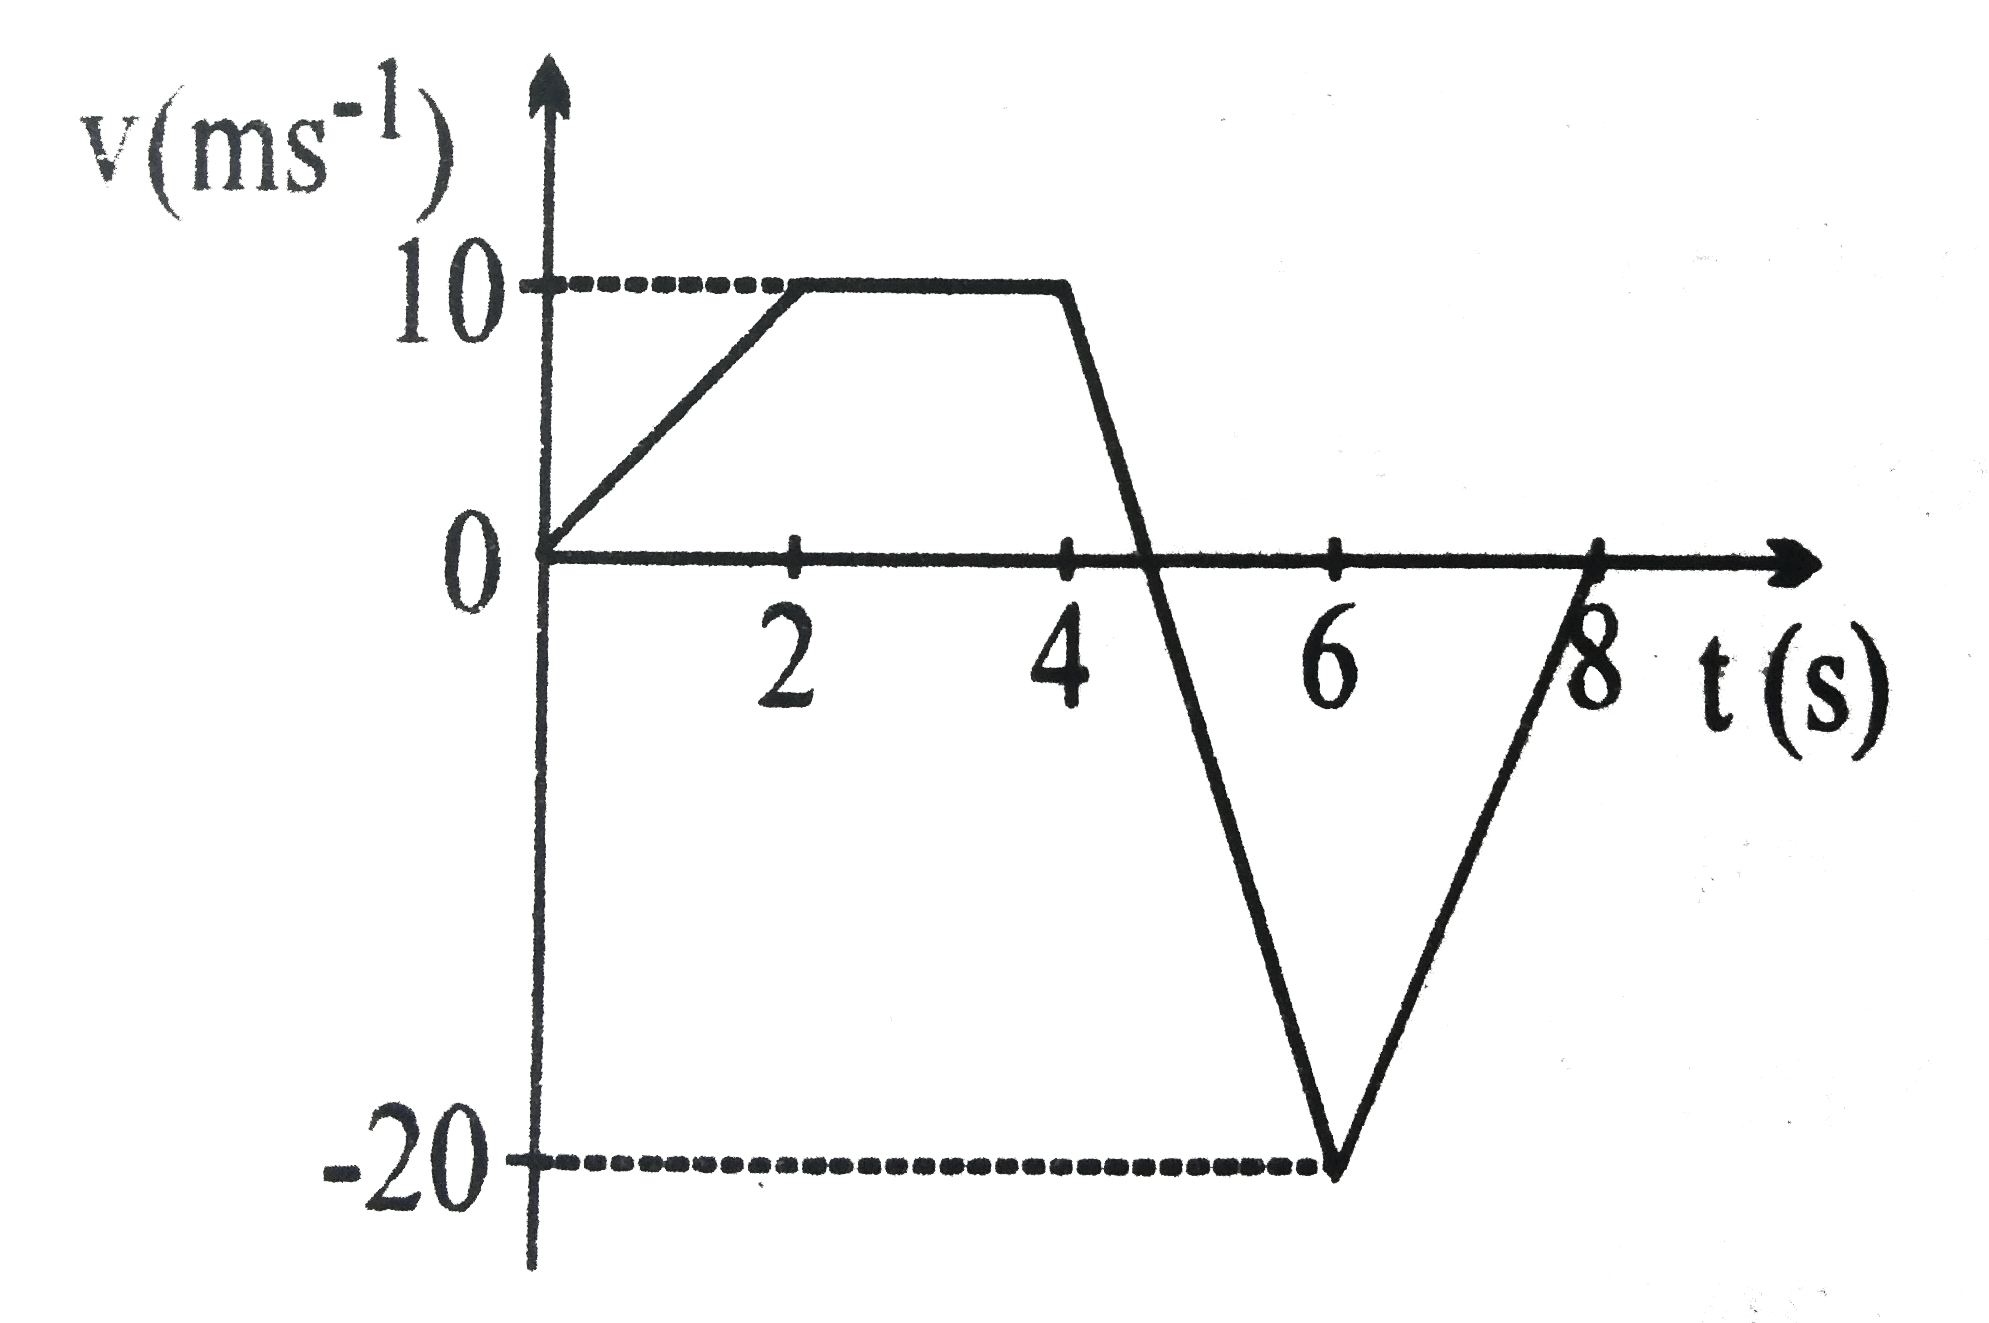
The maximum displacement of the particle isA33.3mB23.3mC18.3mDzero
A displacement -time graph of a body moving with uniform velocity is shown in the figure. Find out its velocity and its displacement at the end of 5 seconds
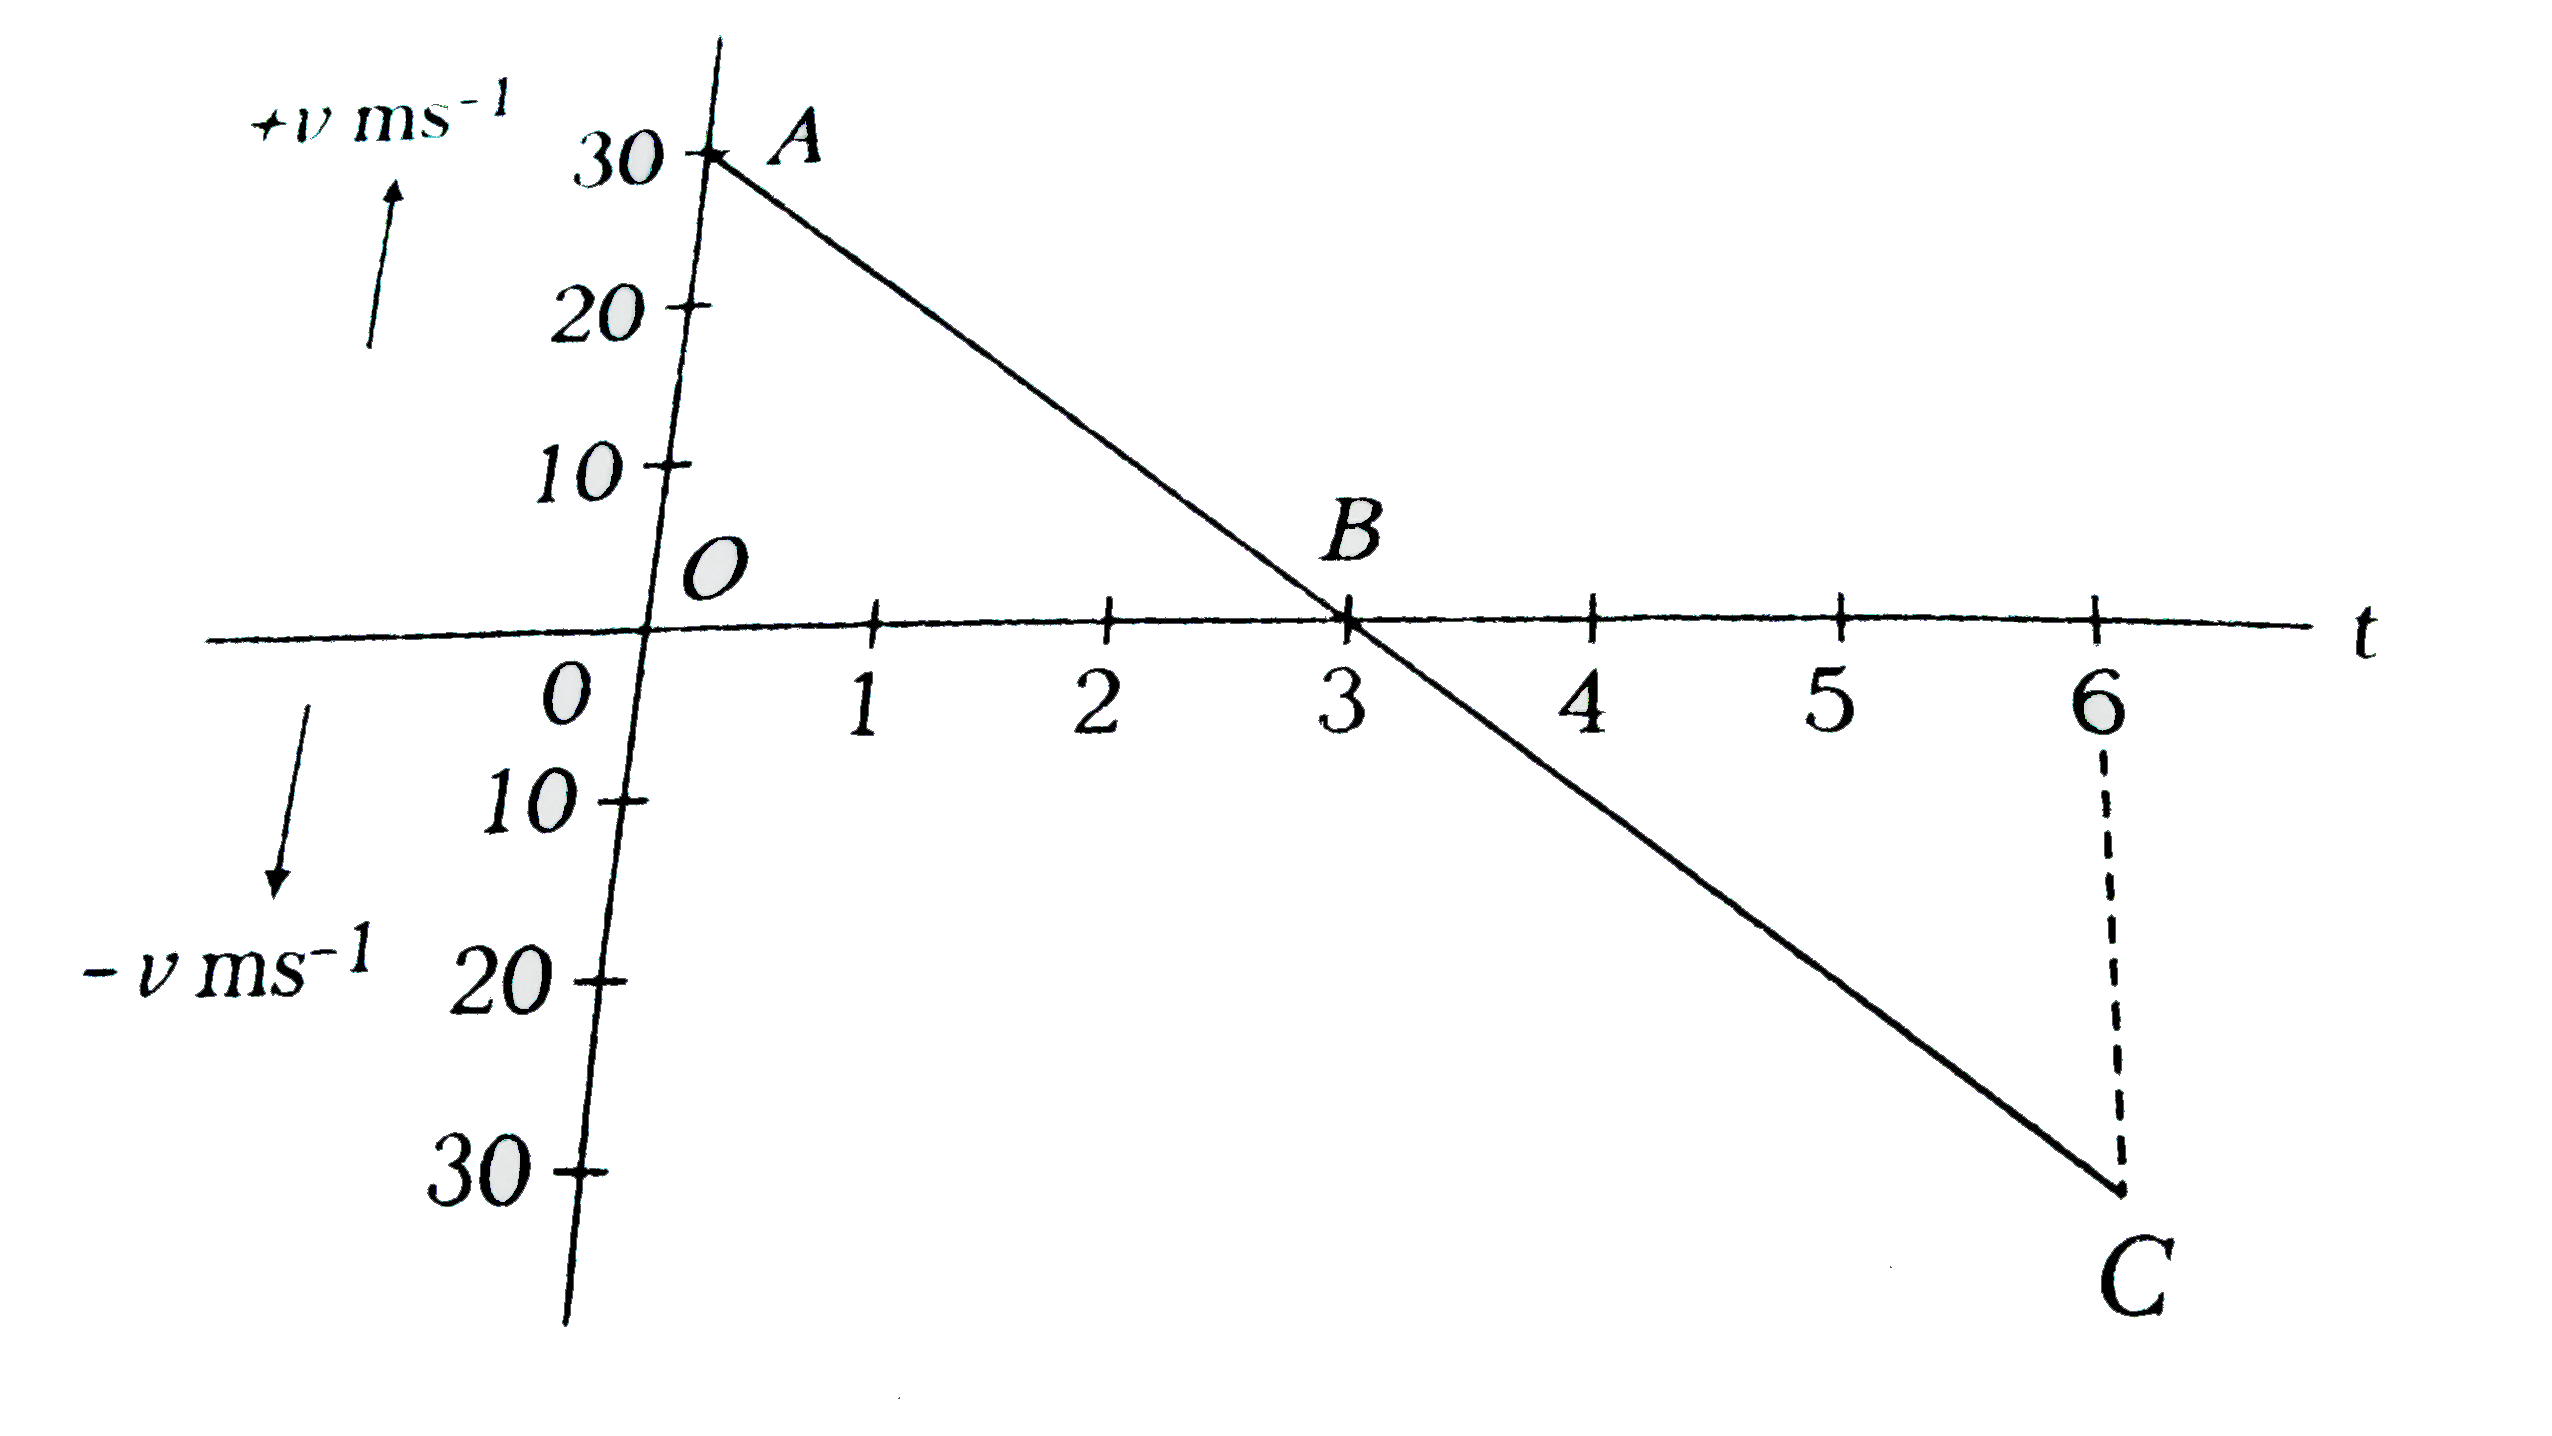
View SolutionWith the help of the given velocity - time graph, find the
(i) displacement in first three seconds and
(ii) acceleration for the graph.
View SolutionThe figure shows a velocity-time graph of a particle moving along a straight line
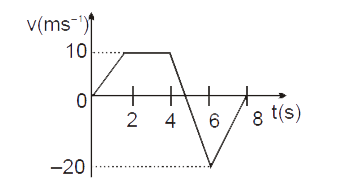
The maximum of displacement of the particle is
View SolutionThe figure shows a velocity-time graph of a particle moving along a straight line
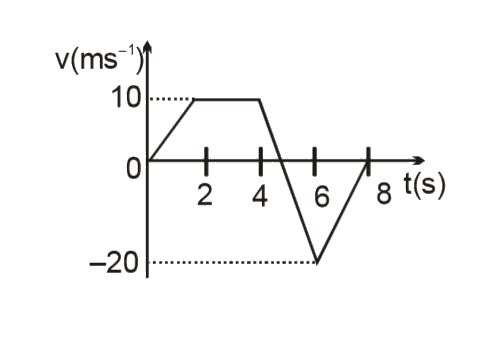
Q. The maximum of displacement of the particle is
View SolutionAssertion: Area under velocity-time graph give displacement.
Reason: Area under acceleration-time graph give velocity.
View Solution
