In which year the percentage increases in the number of total students in schools A and B taken together is the highest in comparison to its previous years
2011
2009
2012
2010
The correct Answer is:B
Step by step video, text & image solution for In which year the percentage increases in the number of total students in schools A and B taken together is the highest in comparison to its previous years by Maths experts to help you in doubts & scoring excellent marks in Class 14 exams.
Updated on:21/07/2023Similar Questions
The given Bar Graph presents the number of students of two schools for six years.
दिया गया दंड आरेख छः वर्ष की अवधि में दो विद्यालयों में छात्रों की संख्या को दर्शाता है |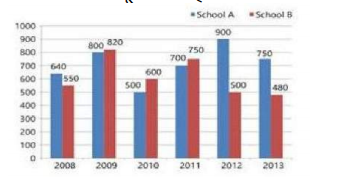
In which year the percentage increase in the number of total students in schools A and B taken together is the highest in comparison to its previous year?
किस वर्ष विद्यालय A और B को मिलाकर कुल छात्रों की संख्या में प्रतिशत वृद्धि पिछले वर्ष की तुलना में सर्वाधिक है ?
View SolutionThe given Bar Graph presents the number of students of two schools for six years.
दिया गया दंड आरेख छः वर्ष की अवधि में दो विद्यालयों में छात्रों की संख्या को दर्शाता है |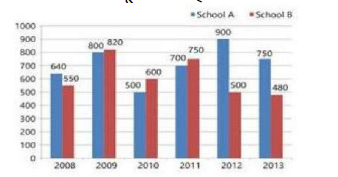 In which year, the percentage increase in students in school B is the highest in comparison to its
previous year?
किस वर्ष में, विद्यालय B में छात्रों की संख्या में प्रतिशत वृद्धि इसके पिछले वर्ष की तुलना में सबसे अधिक रही है?
View Solution
Knowledge Check
In which year the percentage increase of students in school A is the highest in comparison to its previous years?
A2010B2012C2011D2009The given bar graph presents the Imports and Exports of an item manufactured by a company for the five financial years, 2013-2014 to 2017-2018.
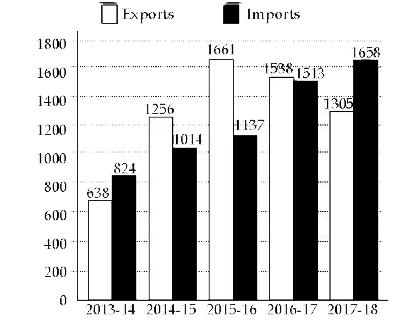
In which financial year the percentage increase in total of Exports and Imports is the highest in comparison to its previous financial year?A2016-2017B2014-2015C2017-2018D2015-2016The given bar graph presents the results in terms of number of students in a school for the five academic year 2013-2014 to 2017-2018.
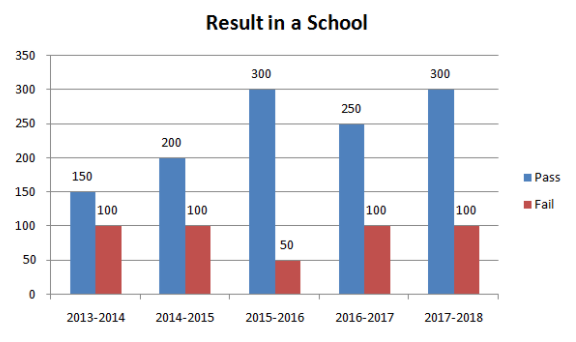
In which year the percentage increase in the total number of students is the highest in a comparison to the previous academic year?A2017-2018B2015-2016C2016-2017D2014-2015
The given Bar Graph presents the number of students of two schools for six years.
दिया गया दंड आरेख (बार ग्राफ) छह वर्षो के दौरान दो स्कूलों में विद्यार्थियों की संख्या को दर्शाता है| In which year, the percentage increase in students in school B is the highest in comparison to its previous year?
किस वर्ष में, स्कूल B के विद्यार्थियों की संख्या में प्रतिशत वृद्धि इसके पिछले वर्ष की तुलना में सबसे अधिक है?
View SolutionThe given Bar Graph presents the number of students of two schools for six years.
दिया गया दंड आरेख छः वर्ष की अवधि में दो विद्यालयों में छात्रों की संख्या को दर्शाता है |
In which year, the percentage increase of students in school A is the highest in comparison to its previous year?
किस वर्ष, विद्यालय A में छात्रों की संख्या में प्रतिशत वृद्धि पिछले वर्ष की तुलना में सर्वाधिक है ?
View SolutionIn which year, the percentage increase in students in school B is the highest in comparison to its previous year
View SolutionThe given bar graph presents the Imports and Exports of an item manufactured by a company for the five financial years, 2013-2014 to 2017-2018.

In which financial year the percentage increase in imports and Exports taken together is the lowest in comparison to its previous financial year?
View SolutionThe given Bar Graph presents the results in terms of the number of students in a school for the five academic years, 2013-2014 to 2017-2018.
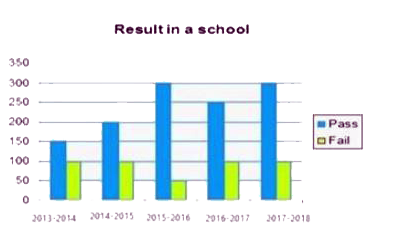
In which year the percentage increase in total number of students is the lowest in comparison to its previous academic year
View Solution
