The percentag increases in the total number of students of a school over that in the previous year.
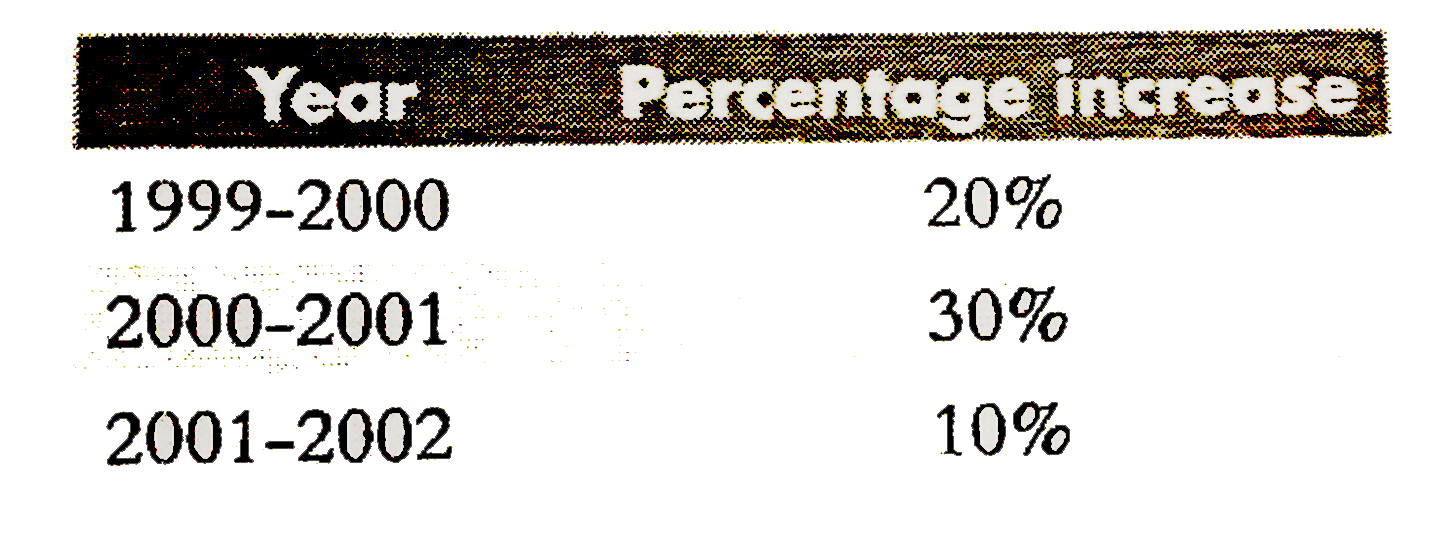
Find the effective percentage increase in the number of students from 1998-1999 to 2000-2001.
0.316
0.72
0.62
0.82
The correct Answer is:B
Step by step video, text & image solution for The percentag increases in the total number of students of a school over that in the previous year. Find the effective percentage increase in the number of students from 1998-1999 to 2000-2001. by Maths experts to help you in doubts & scoring excellent marks in Class 8 exams.
Updated on:21/07/2023Topper's Solved these Questions
- PERCENTAGESBOOK - PEARSON IIT JEE FOUNDATIONCHAPTER - PERCENTAGESEXERCISE - Concept Application (LEVEL 3)
7 Videos
- PERCENTAGESBOOK - PEARSON IIT JEE FOUNDATIONCHAPTER - PERCENTAGESEXERCISE - Concept Application (LEVEL 1)
28 Videos
- MOCK TEST PAPERBOOK - PEARSON IIT JEE FOUNDATIONCHAPTER - MOCK TEST PAPEREXERCISE - Questions
5 Videos
- POLYNOMIALS, LCM AND HCF OF POLYNOMIALS BOOK - PEARSON IIT JEE FOUNDATIONCHAPTER - POLYNOMIALS, LCM AND HCF OF POLYNOMIALS EXERCISE - CONCEPT APPLICATION (LEVEL 3)
6 Videos
Similar Questions
Knowledge Check
The percentag increases in the total number of students of a school over that in the previous year.

Find the effective percentage increase in the number of students from 1998-1999 to 2000-2001.A0.316B0.72C0.62D0.82The given bar graph presents the results in terms of number of students in a school for the five academic year 2013-2014 to 2017-2018.
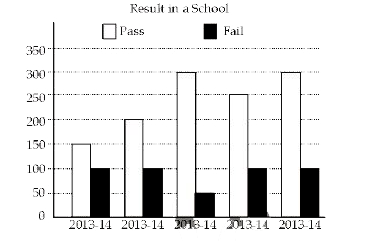
In which year the percentage increase in the total number of students is the highest in a comparison to the previous academic year?A2016-2017B2017-2018C2015-2016D2014-2015The given bar graph presents the results in terms of number of students in a school for the five academic year 2013-2014 to 2017-2018.
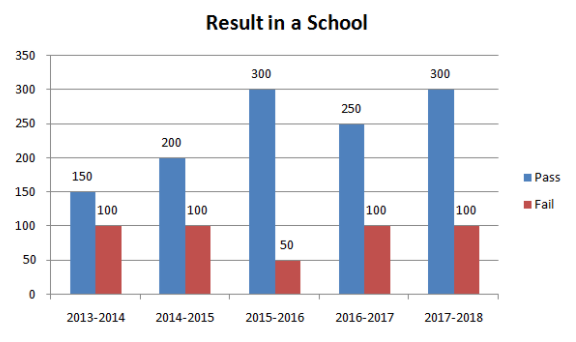
In which year the percentage increase in the total number of students is the highest in a comparison to the previous academic year?A2017-2018B2015-2016C2016-2017D2014-2015
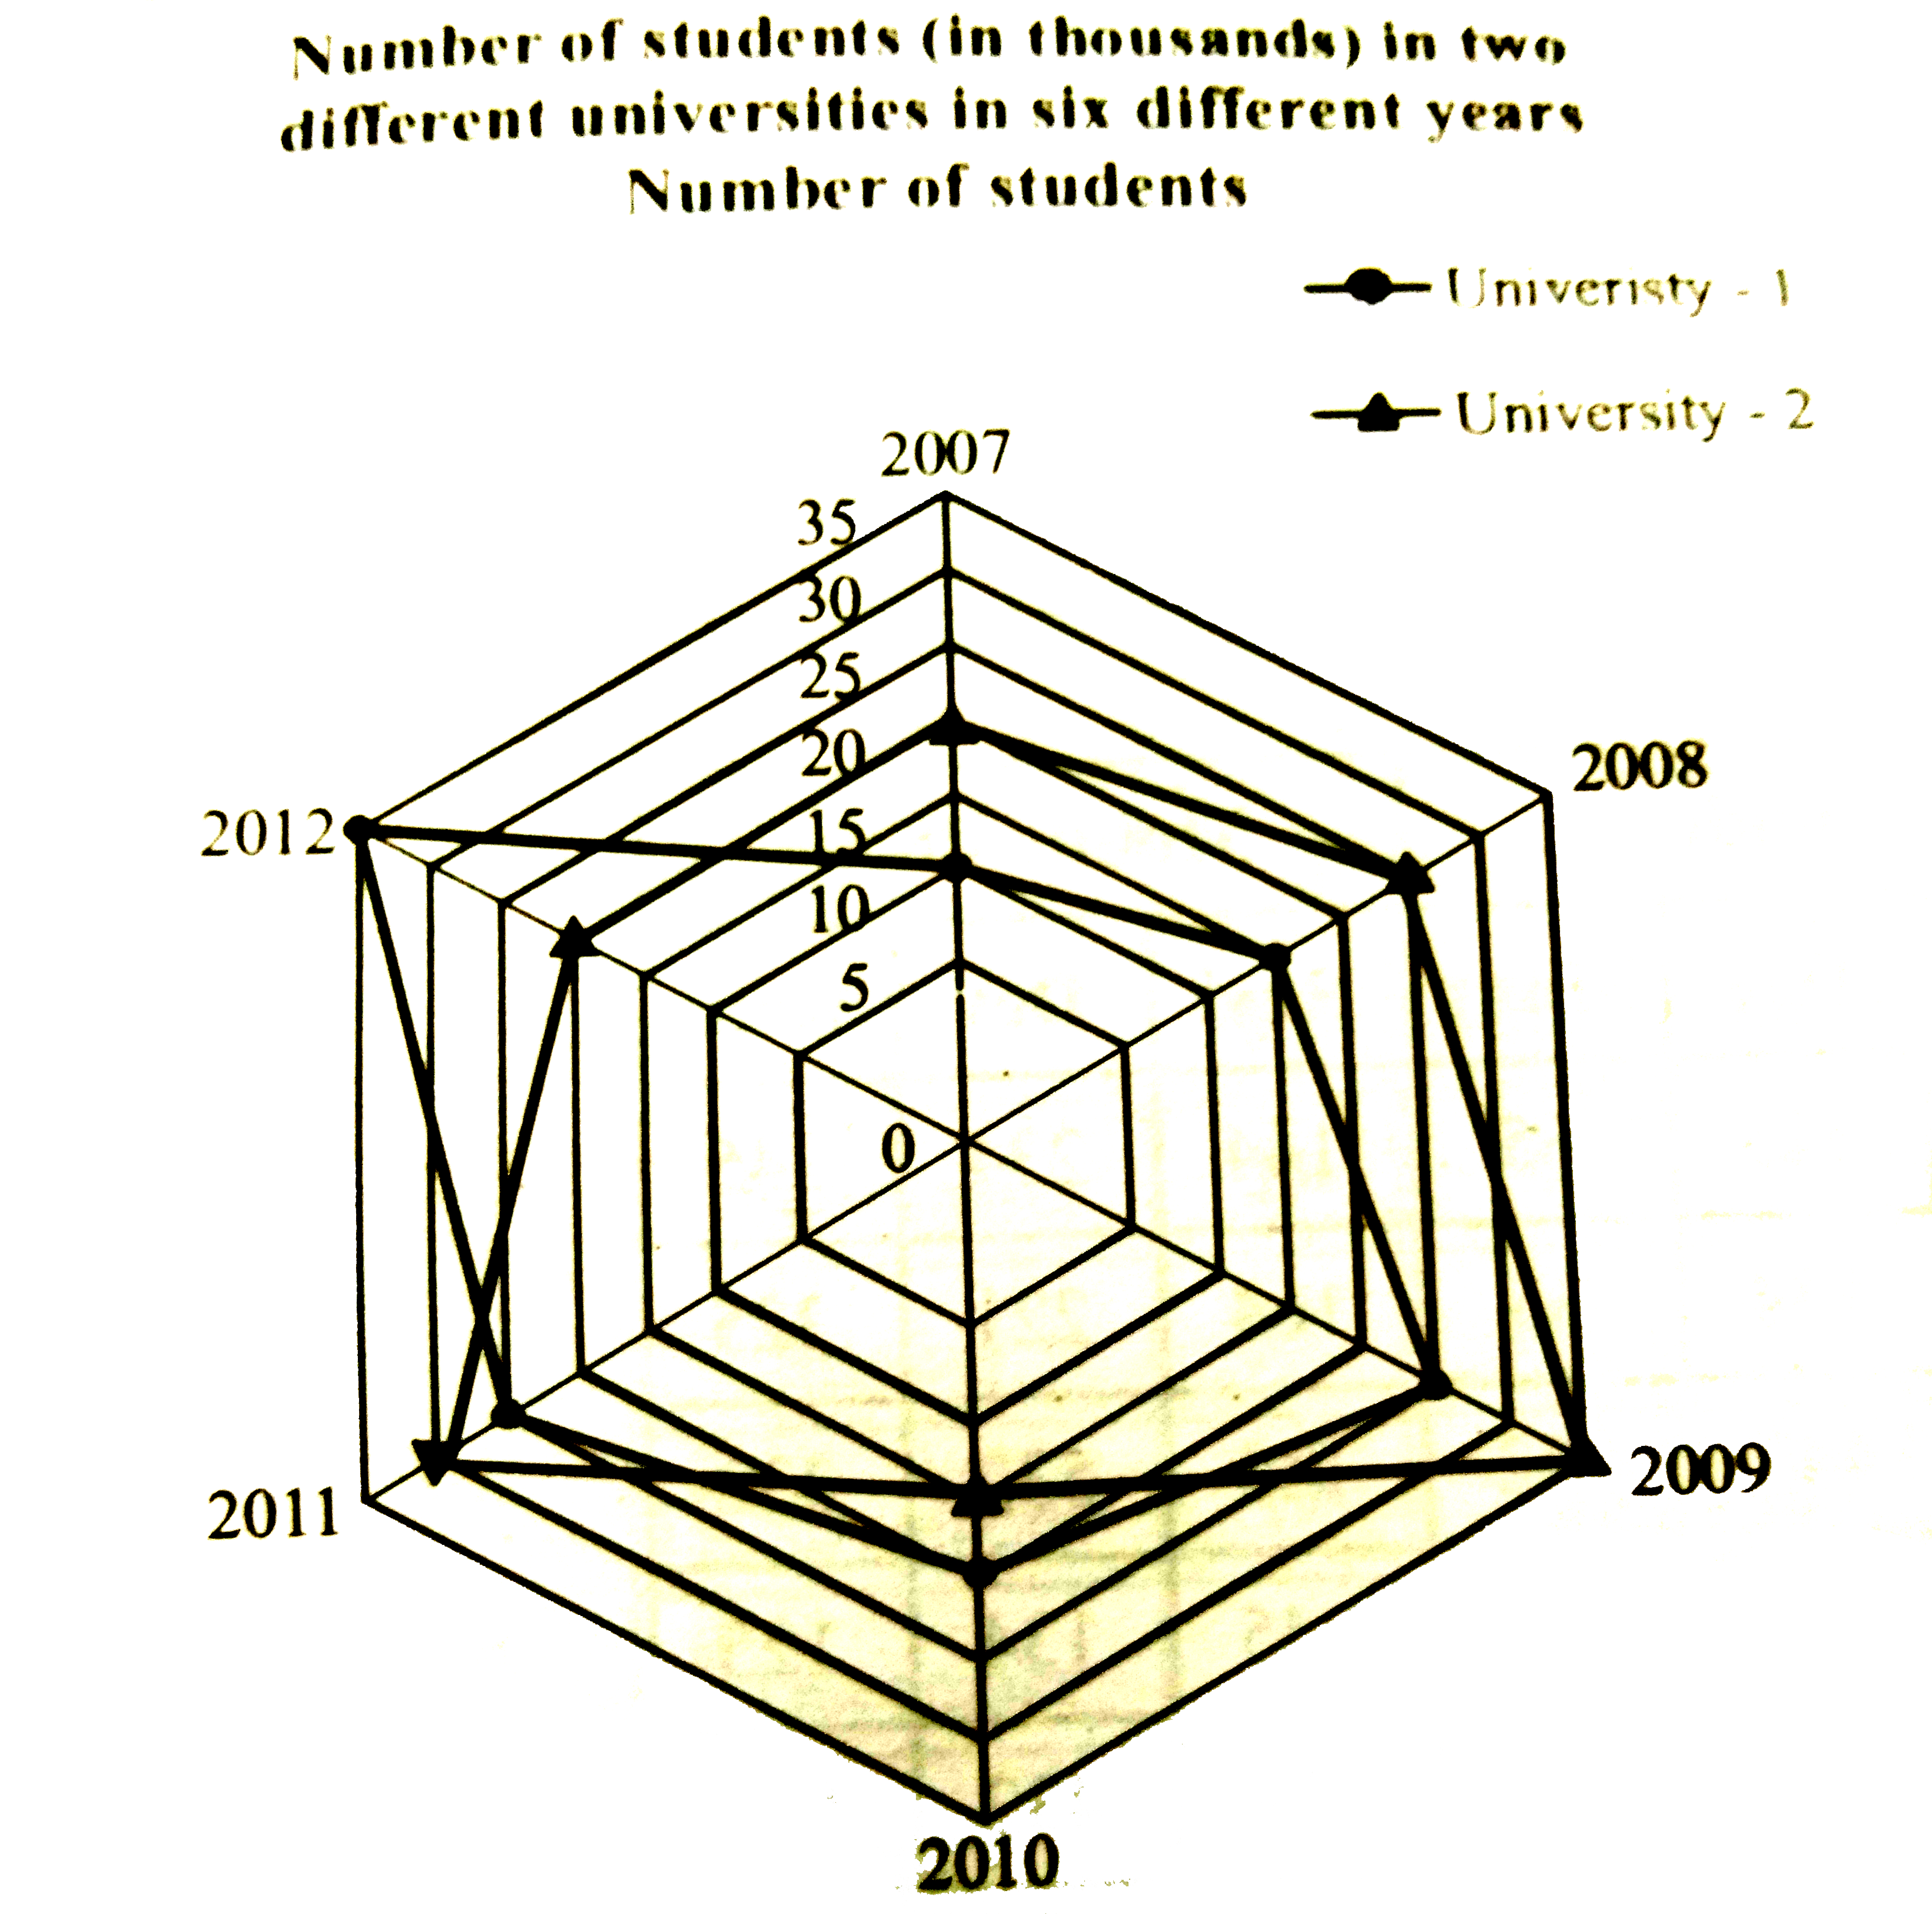
What was the present increase in the number of students in University -I in the year 2011 as compared to the previous year ?
View SolutionStudy the given graph the question that follows
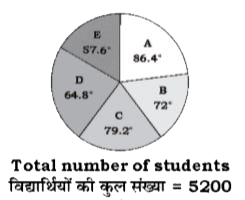
The number of students is school C is what percentage more than the number of students in school B?
View SolutionThe given Bar Graph presents the results in terms of the number of students in a school for the five academic years, 2013-2014 to 2017-2018.
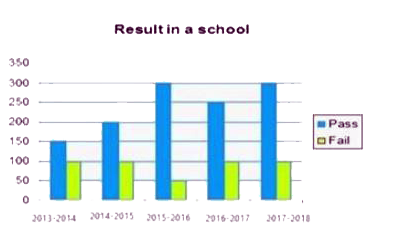
In which year the percentage increase in total number of students is the lowest in comparison to its previous academic year
View SolutionIn which year the percentage increases in the number of total students in schools A and B taken together is the highest in comparison to its previous years
View SolutionIn which year, the percentage increase in students in school B is the highest in comparison to its previous year
View Solution
