Total number of students of a school in different years is shown in the following table
A)
a) 6
b)5 complete symbols and 1 incomplete symbols
B) B is more informative.
Topper's Solved these Questions
- DATA HANDLINGBOOK - NCERTCHAPTER - DATA HANDLINGEXERCISE - SOLVED EXAMPLES
9 Videos
- DATA HANDLINGBOOK - NCERTCHAPTER - DATA HANDLINGEXERCISE - EXERCISE 9.3
3 Videos
- BASIC GEOMETRICAL IDEASBOOK - NCERTCHAPTER - BASIC GEOMETRICAL IDEASEXERCISE - EXERCISE 4.6
4 Videos
- DECIMALSBOOK - NCERTCHAPTER - DECIMALSEXERCISE - EXERCISE 8.1
10 Videos
Similar Questions
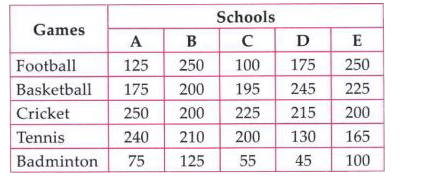
Number of students from various school playing various games is given in following table

What is the difference between the average number of students playing cricket from all school and the average number of students playing tennis from all schools ?
View SolutionThe following table shows the interest of students of a school in different games :

Represent the data by using a simple bar diagram.
View Solution
Knowledge Check
The number of students enrolled in different streams in a college is shown in the following table.

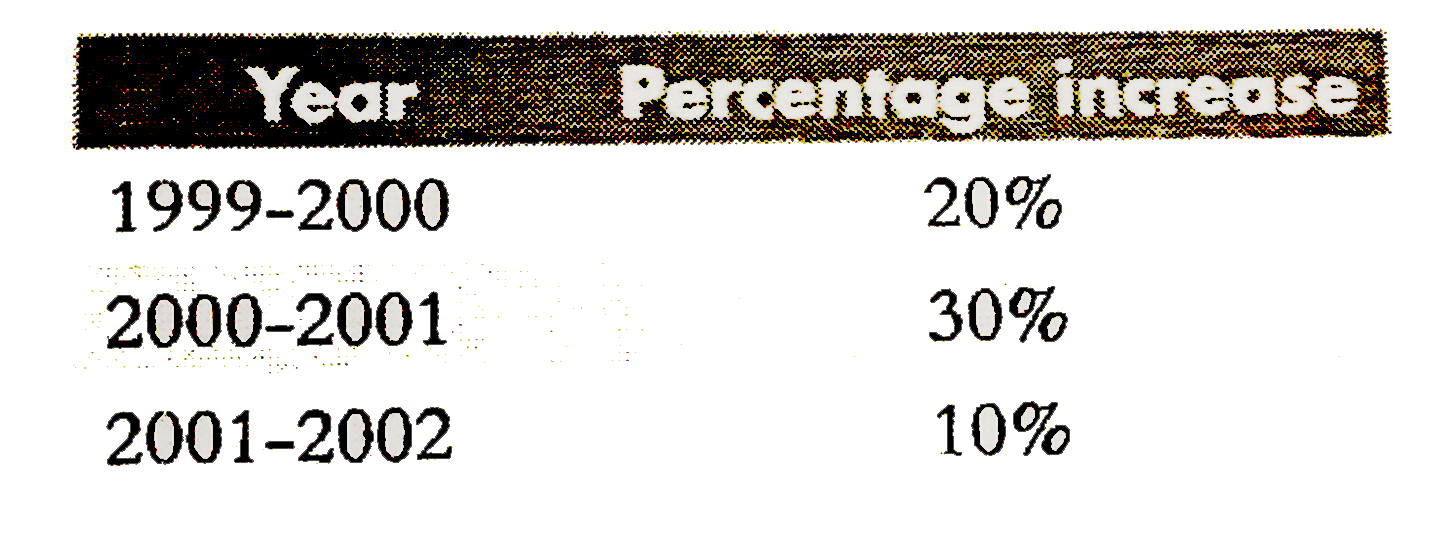
The ratio of the total number of boys to that of girls in the college is:A1:1B23:27C13:12D27:23The percentag increases in the total number of students of a school over that in the previous year.

Find the effective percentage increase in the number of students from 1998-1999 to 2000-2001.A0.316B0.72C0.62D0.82The percentag increases in the total number of students of a school over that in the previous year.

Find the effective percentage increase in the number of students from 1998-1999 to 2000-2001.A31.6%B71.6%C62.6%D81.6%
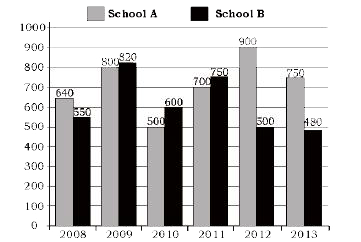
In given bar graph presents the number of students of two schools for six years.

What is the average of total students in schools A and B taken together during the six year period?
View SolutionThe table shows the number of students from different schools playing different games. Study the table carefully and answer the questions.
Games Schools A B C DCricket 125 250 150 175Football 175 200 250 125Hockey 75 125 200 150
What is the ratio of the total students who play cricket in schools A and B together to the total students who play hockey in schools D and B together ?
View SolutionThe table shows the number of students from different schools playing different games. Study the table carefully and answer the questions.
Games Schools A B C DCricket 125 250 150 175Football 175 200 250 125Hockey 75 125 200 150
If the data about the number of students who play hockey from different school is represented by a pir-chart, what is the central angle of the sector representing students who play hockey from school C to the nearest whole number ?
View SolutionThe total number of students in a school is 2140. If the number of girls in the school is 1200, then what is the ratio of the total number of boys to the total number of girls in the school ?
View SolutionThe total number of students in a school is 8670. If the number of boys in the school is 4545, then what will be the ratio of the number of boys to the total number of girls in the school ?
View Solution
