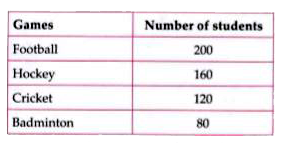
The following table shows the interest of students of a school in different games :

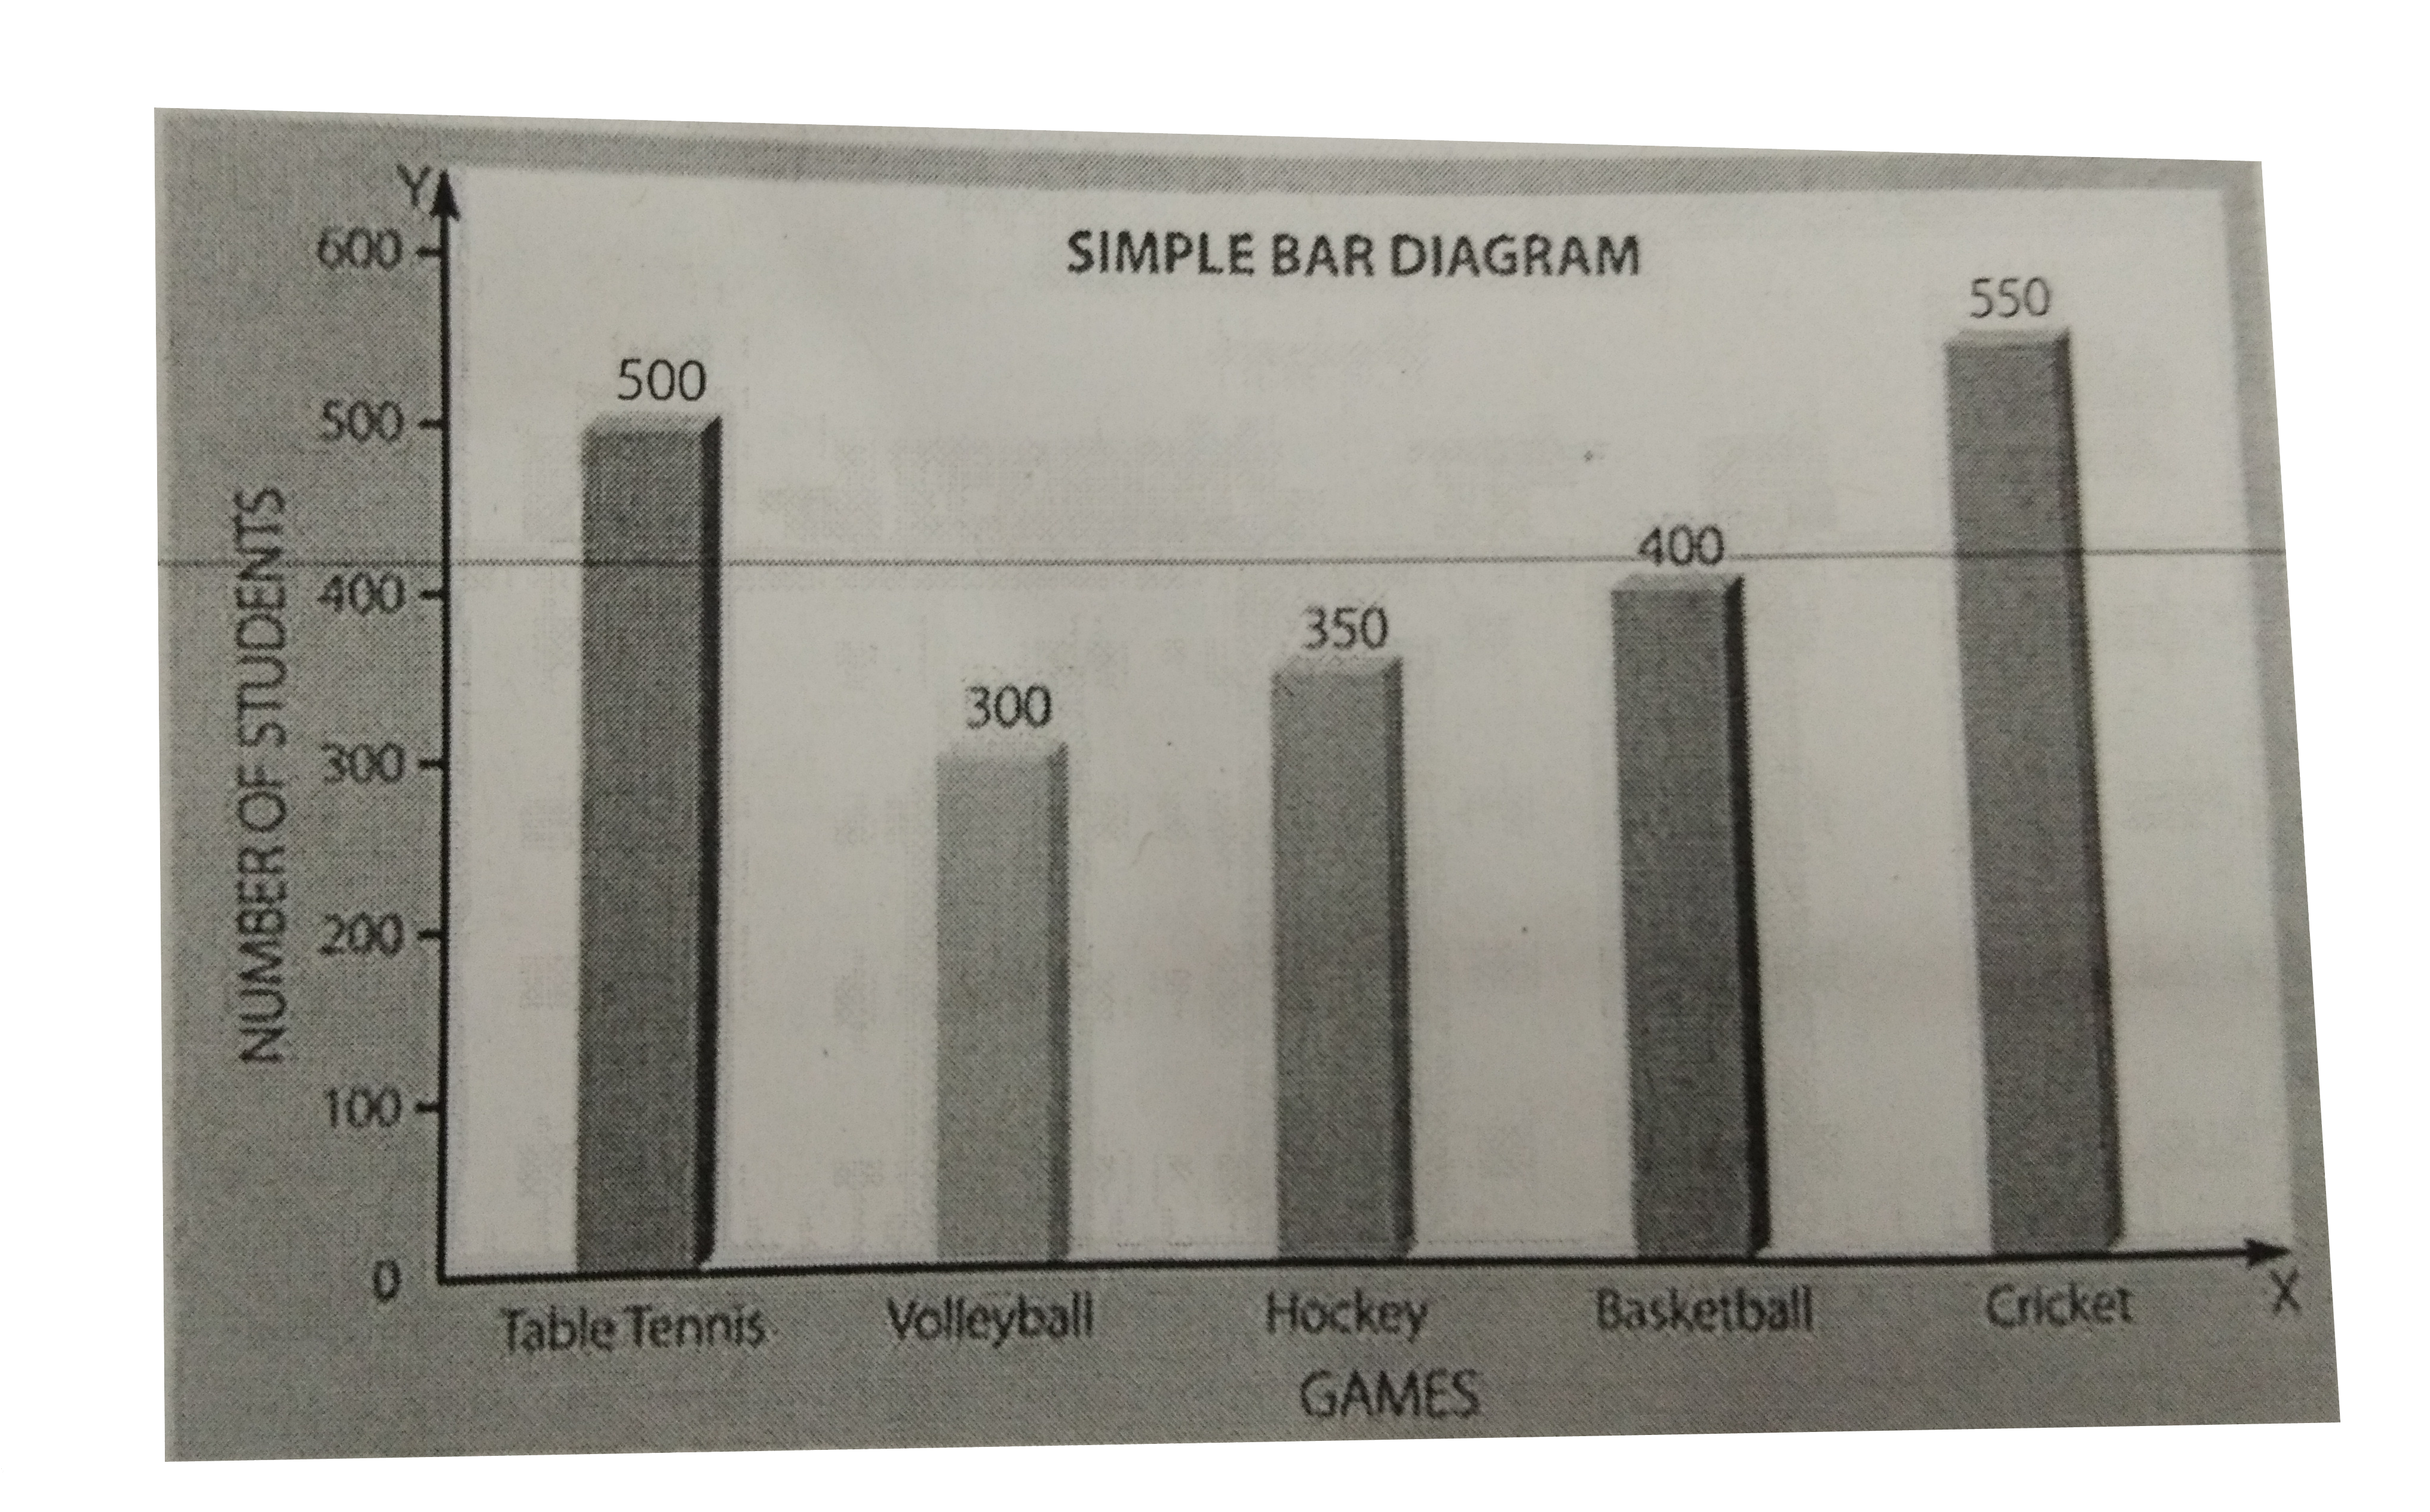
Represent the data by using a simple bar diagram.
Similar Questions
Represent the following data, using a percentage bar diagram :

View SolutionThe following table shows the monthly expenditure of different families on different items :

Represent the data in the form of a sub-divided bar diagram.
View SolutionThe following table shows the percentage of buyers of four different brands of bathing soaps.

Represent the above data by a pie chart.
View SolutionTotal number of students of a school in different years is shown in the following table
View SolutionThe following table gives the data on the marks obtained by two students 'A and B' in five subjects :

Represent the data by a multiple bar diagram.
View SolutionThe following table shows the number of students in different classes of a high school. Draw a histogram to represent the given data.
ClassesVIVIIVIIIIXXNumber of students3742355048
View SolutionThe table shows the number of students playing four different games.

Present this information as a pictograph.
View SolutionThe following data shows the number of students who attended the school on weekdays. Draw a bar graph to represent information by using appropriate scale.

View SolutionFollowing tables shows estimates of cost of production of certain commodities. Present the data in the form of sub divided bar diagram:

View SolutionThe following table shows the number of fruits in a fruit shop. Represent the above data by a bar graph
View Solution

