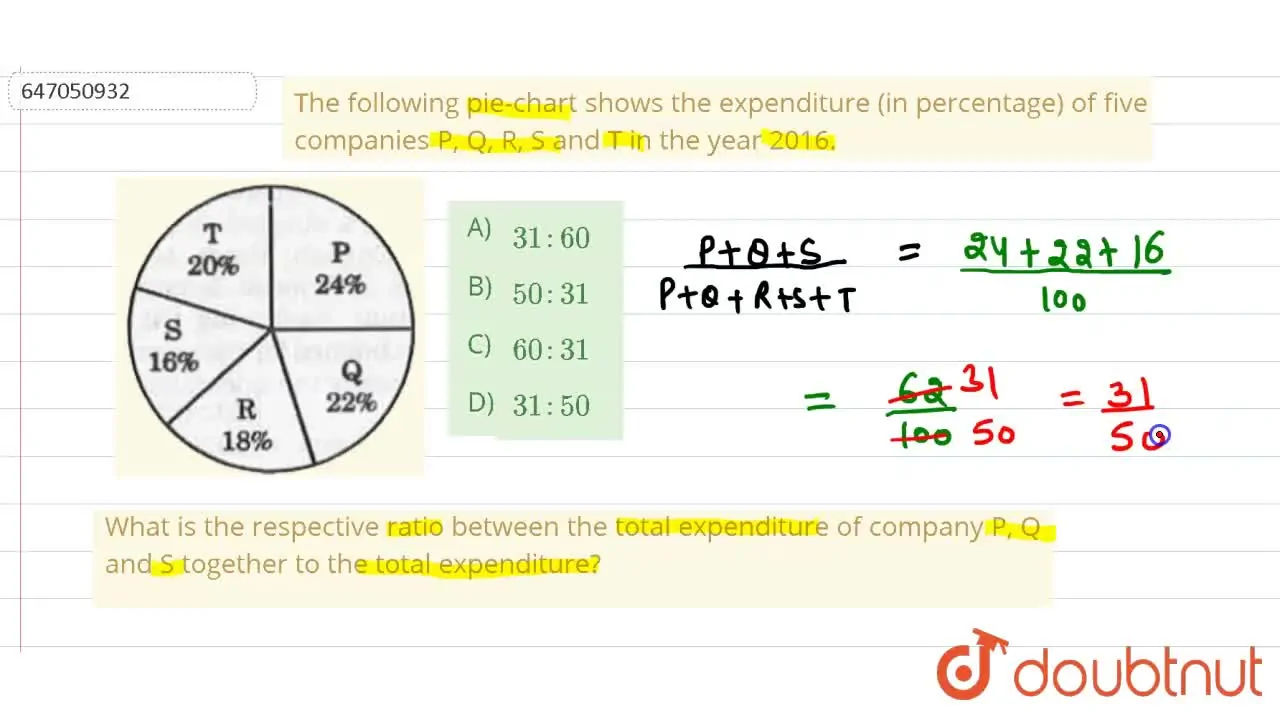
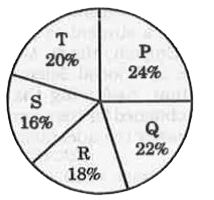
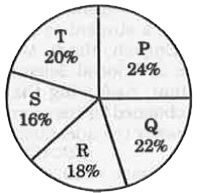
The following pie-chart shows the expenditure (in percentage) of five companies P, Q, R, S and T in the year 2016.
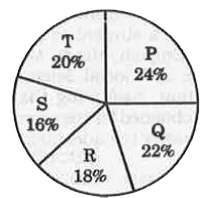
What is the respective ratio between the total expenditure of company P, Q and S together to the total expenditure?
31:60
50:31
60:31
31:50
The correct Answer is:D
Step by step video, text & image solution for The following pie-chart shows the expenditure (in percentage) of five companies P, Q, R, S and T in the year 2016. What is the respective ratio between the total expenditure of company P, Q and S together to the total expenditure? by Maths experts to help you in doubts & scoring excellent marks in Class 14 exams.
Related Playlists
- BOOK - KIRAN PUBLICATIONCHAPTER - STATISTICS AND DATA INTERPRETATIONEXERCISE - TYPE-VIII8videos
STATISTICS AND DATA INTERPRETATION
- BOOK - KIRAN PUBLICATIONCHAPTER - STATISTICS AND DATA INTERPRETATIONEXERCISE - TYPE-VI86videos
STATISTICS AND DATA INTERPRETATION
- BOOK - KIRAN PUBLICATIONCHAPTER - SIMPLIFICATIONEXERCISE - TEST YOURSELF25videos
SIMPLIFICATION
- BOOK - KIRAN PUBLICATIONCHAPTER - TIME AND DISTANCEEXERCISE - Type -XI74videos
TIME AND DISTANCE
Similar Questions
The following pie-chart shows the expenditure (in percentage) of five companies P, Q, R, S and T in the year 2016.
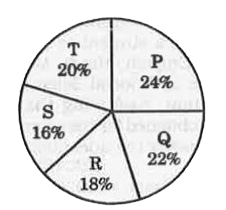
What was the total expenditure (in Rs. crores) of the company Q, R and T together?View SolutionThe following pie-chart shows the expenditure (in percentage) of five companies P, Q, R, S and T in the year 2016.
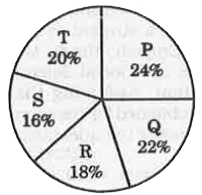
By how much per cent expenditure of company Q and R together is greater than that of company P?View SolutionThe following pie-chart shows the expenditure (in percentage) of five companies P, Q, R, S and T in the year 2016.
Total amount spent by company S is what percent of total amount spent by companies T and R?View SolutionThe following pie-chart shows the expenditure (in percentage) of five companies P, Q, R, S and T in the year 2016.
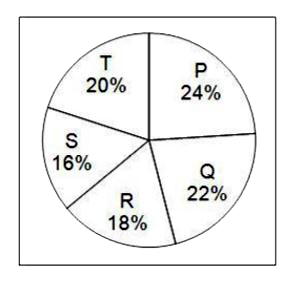
The profit earned by company R is equal to the 14th of the expenditure of company Q. What is the profit (in Rs. crores) of company R?View SolutionThe following pie chart shows the expenditure (in percentage) of the five companies P,Q,R,S and T in the year 2016 .
Total Expenditure = Rs. 48 crores
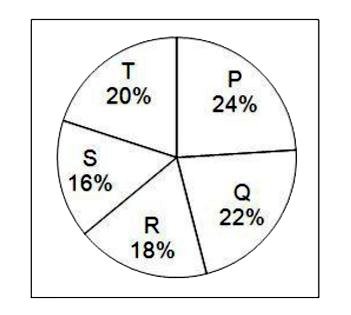
What was the total expenditure (in Rs crores) of the company Q, R and P together?View SolutionThe following pie chart shows the expenditure (in percentage) of the five companies P,Q,R,S and T in the year 2016 .
Total Expenditure = Rs. 48 crores
By how much percent expenditure of company Q and R together greater than that of company P?View SolutionIn the given pie chart what is the total expenditure on rent
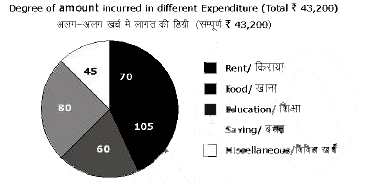 View Solution
Study the following graph carefully to answer the questions given below. Expenditure in lakhs) of three different Companies in Five Different Years
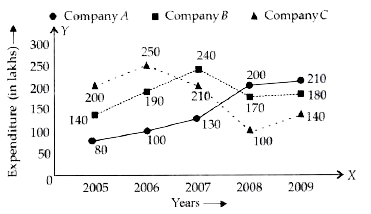
What was the difference between the total expenditure of Company B in the year 2006 and 2008 together and the total expenditure of Company C in the year 2007 and 2009 together?View SolutionStudy the following graph carefully to answer the questions given below. Expenditure in lakhs) of three different Companies in Five Different Years
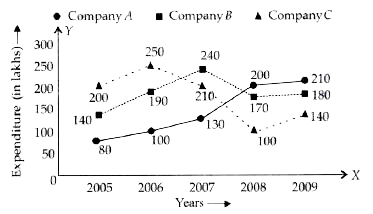
What was the ratio of the expenditure of Company A in the year 2009 to the expenditure of Company B in the year 2005?View SolutionThe given Bar Graph presents the Revenue and Expenditure (in crores of Rupees ) of a company during the five year period, 2014-2018.
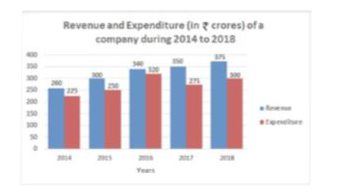
What is the ratio of the total revenue of the company in 2015 and 2018 to that of its expenditure in 2014 and 2018 ?View Solution

