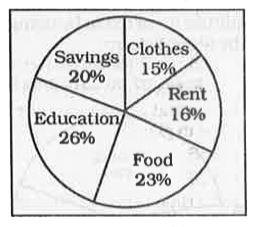
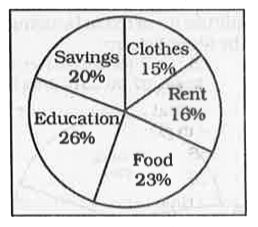
The given pie-chart shows the breakup (in percentage) of monthly expenditure of a person.
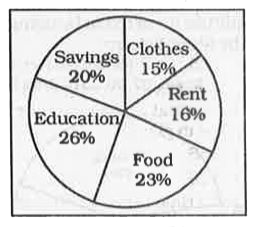
The expenditure on food is how much per cent more than the expenditure on savings?
12.21
15
13.04
11
The correct Answer is:B
Step by step video, text & image solution for The given pie-chart shows the breakup (in percentage) of monthly expenditure of a person. The expenditure on food is how much per cent more than the expenditure on savings? by Maths experts to help you in doubts & scoring excellent marks in Class 14 exams.
Updated on:21/07/2023Topper's Solved these Questions
- STATISTICS AND DATA INTERPRETATIONBOOK - KIRAN PUBLICATIONCHAPTER - STATISTICS AND DATA INTERPRETATIONEXERCISE - TYPE-VIII
8 Videos
- STATISTICS AND DATA INTERPRETATIONBOOK - KIRAN PUBLICATIONCHAPTER - STATISTICS AND DATA INTERPRETATIONEXERCISE - TYPE-VI
86 Videos
- SIMPLIFICATIONBOOK - KIRAN PUBLICATIONCHAPTER - SIMPLIFICATIONEXERCISE - TEST YOURSELF
25 Videos
- TIME AND DISTANCEBOOK - KIRAN PUBLICATIONCHAPTER - TIME AND DISTANCEEXERCISE - Type -XI
74 Videos
Similar Questions
In the given pie chart the expenditure on steel is what percent of the expenditure on cement
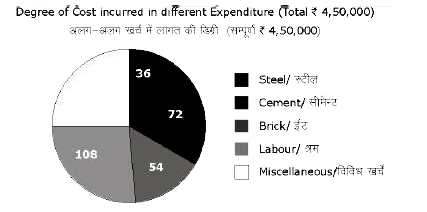
View SolutionThe pie-chart shows the breakup in percent age of the various expenses of a Company. Study the diagram and answer the following questions.
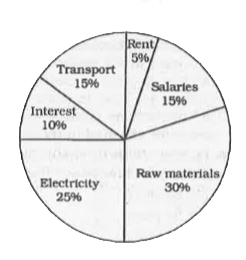
The company's expenditure on interest is greater than expenditure on rent by:
View Solution
Knowledge Check
The given pie-chart shows the breakup (in percentage) of monthly expenditure of a person.
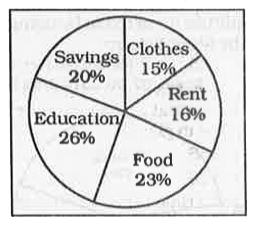
If the expenditure incurred on Clothes is Rs. 3000, what is the expenditure (in Rs.) incurred on Education?A4300B5050C5200D5600The given pie-chart shows the breakup (in percentage) of monthly expenditure of a person.
What is the central angle (in degree) made by the sector of expenditure on Education?A93.6B88.2C84.3D95.2The given pie-chart shows the breakup (in percentage) of monthly expenditure of a person.
The central angle made by the sector of expenditure on fuel is how much more (in degrees) than the central angle made by the sector of clothes, if the ratio of the expenditure on fuel and clothes is 4:3 repsectively?A18B32C36D45
The given pie chart shows expenditure on different type of sport in a particular year . Study the pie chart and answer the question below
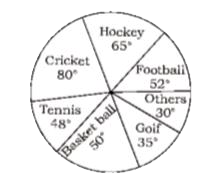
IF in a year the expenditure on sport was 18000000 then expenditure on tennis was how much more than expenditure on golf.
View SolutionThe given pie-chart shows the expenditure incurred in making a book.
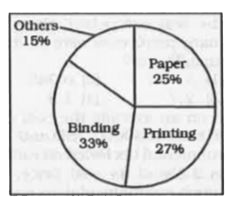
The expenditure on Binding is how much per cent more than the expenditure on Paper?
View SolutionThe given pie-chart shows the breakup (in percentage) of monthly expenditure of a person.
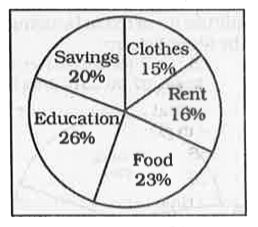
If the total salary of the person is Rs. 50000, what will be the expenditure (in Rs.) on Rent?
View SolutionThe following pie-chart shows the expenditure (in percentage) of five companies P, Q, R, S and T in the year 2016.
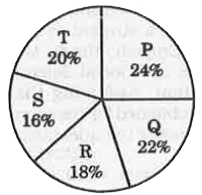
By how much per cent expenditure of company Q and R together is greater than that of company P?
View SolutionThe given pie chart shows the distribution of expenditure of a company (in percentage) . The total expenditure of the company is Rs. 136000.
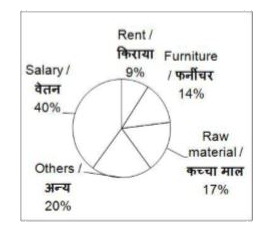
A new expenditure of transportion is added and to meet this expenditure, all others expenditures are reduced. If the central angle formed by the expenditure incurred on Transportation is 72∘, then how much amount (in Rs) all other expenses are reduced?
View Solution
