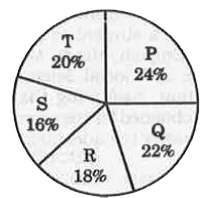
The following pie-chart shows the expenditure (in percentage) of five companies P, Q, R, S and T in the year 2016.
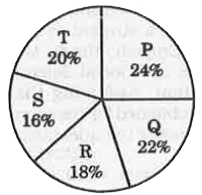
By how much per cent expenditure of company Q and R together is greater than that of company P?
33.33%
60%
66.67%
75%
The correct Answer is:C
Step by step video, text & image solution for The following pie-chart shows the expenditure (in percentage) of five companies P, Q, R, S and T in the year 2016. By how much per cent expenditure of company Q and R together is greater than that of company P? by Maths experts to help you in doubts & scoring excellent marks in Class 14 exams.
Updated on:21/07/2023Topper's Solved these Questions
- STATISTICS AND DATA INTERPRETATIONBOOK - KIRAN PUBLICATIONCHAPTER - STATISTICS AND DATA INTERPRETATIONEXERCISE - TYPE-VIII
8 Videos
- STATISTICS AND DATA INTERPRETATIONBOOK - KIRAN PUBLICATIONCHAPTER - STATISTICS AND DATA INTERPRETATIONEXERCISE - TYPE-VI
86 Videos
- SIMPLIFICATIONBOOK - KIRAN PUBLICATIONCHAPTER - SIMPLIFICATIONEXERCISE - TEST YOURSELF
25 Videos
- TIME AND DISTANCEBOOK - KIRAN PUBLICATIONCHAPTER - TIME AND DISTANCEEXERCISE - Type -XI
74 Videos
Similar Questions
The following pie chart shows the expenditure (in percentage) of the five companies P,Q,R,S and T in the year 2016 .
Total Expenditure = Rs. 48 crores
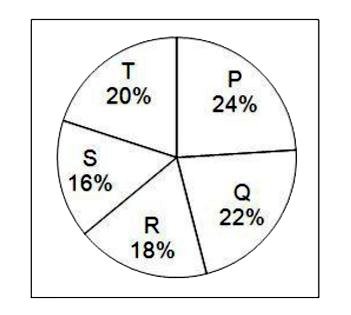
By how much percent expenditure of company Q and R together greater than that of company P?
View SolutionThe following pie chart shows the expenditure (in percentage) of the five companies P,Q,R,S and T in the year 2016 .
Total Expenditure = Rs. 48 crores
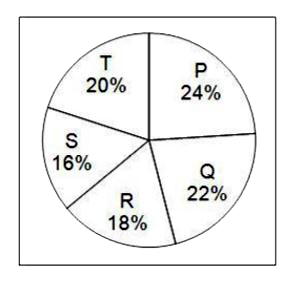
What was the total expenditure (in Rs crores) of the company Q, R and P together?
View Solution
Knowledge Check
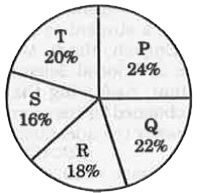
The following pie-chart shows the expenditure (in percentage) of five companies P, Q, R, S and T in the year 2016.
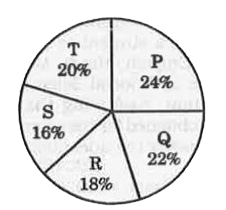
What was the total expenditure (in Rs. crores) of the company Q, R and T together?A19.2B28.8C24.3D31.4The following pie-chart shows the expenditure (in percentage) of five companies P, Q, R, S and T in the year 2016.
What is the respective ratio between the total expenditure of company P, Q and S together to the total expenditure?A31:60B50:31C60:31D31:50The following pie-chart shows the expenditure (in percentage) of five companies P, Q, R, S and T in the year 2016.
The profit earned by company R is equal to the 14th of the expenditure of company Q. What is the profit (in Rs. crores) of company R?A3.24B4.84C2.64D5.66
The pie-chart shows the breakup in percent age of the various expenses of a Company. Study the diagram and answer the following questions.
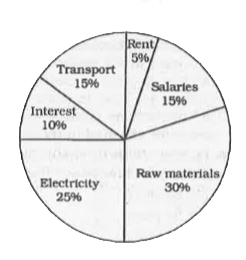
The company's expenditure on interest is greater than expenditure on rent by:
View SolutionThe following pie-chart shows the expenditure (in percentage) of five companies P, Q, R, S and T in the year 2016.
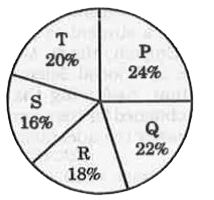
Total amount spent by company S is what percent of total amount spent by companies T and R?
View SolutionThe given pie-chart shows the expenditure incurred in making a book.
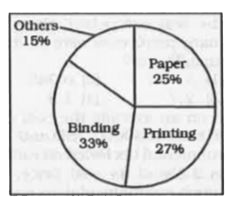
The expenditure on Binding is how much per cent more than the expenditure on Paper?
View SolutionThe given pie-chart shows the breakup (in percentage) of monthly expenditure of a person.
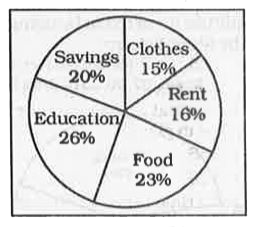
The expenditure on food is how much per cent more than the expenditure on savings?
View SolutionThe bar chart given below shows the sales (in crores) of 2 companies A and B from years 2010 to 2015.
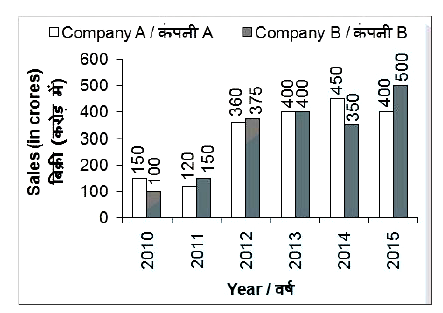
For how many years was the sale of company A greater than that of company B?
View Solution
