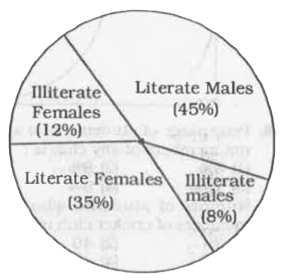
The pie-chart shows the percentage of literate and illiterate males and females in a state. Study the diagram and answer the following questions.
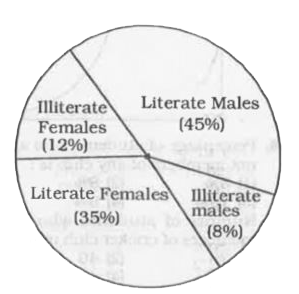
If the difference between the two categories of people are represented by 36∘ in the diagram, then the categories are
literate males and literate females
literate males and literate males
illiterate males and literate females
illiterate males and illiterate females
The correct Answer is:A
Step by step video, text & image solution for The pie-chart shows the percentage of literate and illiterate males and females in a state. Study the diagram and answer the following questions. If the difference between the two categories of people are represented by 36^(@) in the diagram, then the categories are by Maths experts to help you in doubts & scoring excellent marks in Class 14 exams.
Updated on:21/07/2023Topper's Solved these Questions
- STATISTICS AND DATA INTERPRETATIONBOOK - KIRAN PUBLICATIONCHAPTER - STATISTICS AND DATA INTERPRETATIONEXERCISE - TYPE-VIII
8 Videos
- STATISTICS AND DATA INTERPRETATIONBOOK - KIRAN PUBLICATIONCHAPTER - STATISTICS AND DATA INTERPRETATIONEXERCISE - TYPE-VI
86 Videos
- SIMPLIFICATIONBOOK - KIRAN PUBLICATIONCHAPTER - SIMPLIFICATIONEXERCISE - TEST YOURSELF
25 Videos
- TIME AND DISTANCEBOOK - KIRAN PUBLICATIONCHAPTER - TIME AND DISTANCEEXERCISE - Type -XI
74 Videos
Similar Questions
Study the diagram and answer the following questions
What does the diagram represent?
View SolutionThe pie-chart shows the breakup in percent age of the various expenses of a Company. Study the diagram and answer the following questions.
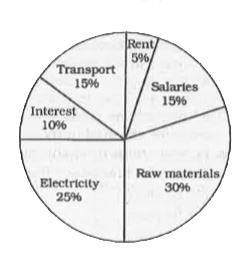
Which is the second biggest expense of the company?
View Solution
Knowledge Check
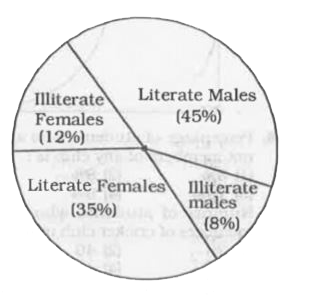
The pie-chart shoews the percentage of literate and illiterate males and females in a state. Study the diagram and answer the following questions.
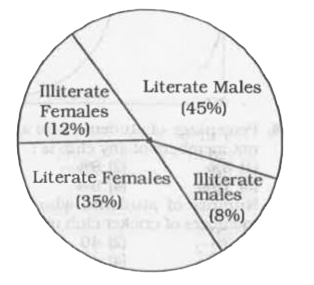
If two categories together have a central angle of 169.2∘, then these categories areAliterate females and illiterate femalesBliterate males and illiterate femalesCilliterate males and illiterate femalesDilliterate males and literate femalesThe pie-chart shows the percentage of literate and illiterate males and females in a state. Study the diagram and answer the following questions.
If the total number is 35000, then the difference between the number of literate males and that of literate females isA3500B3700C400D4500The pie-chart shoews the percentage of literate and illiterate males and females in a state. Study the diagram and answer the following questions.
The difference of central angles corresponding to illiterate male and illiterate female isA12.2∘B13.4∘C11.2∘D14.4∘
The following pie diagram show the expenditure incurred on the preparation of a book by a publisher under various heads - (A)paper 20 percent (B) printing 35% (C) binding canvassing designing etc. 30% (D)miscellaneous 10% (E)royalty 15%
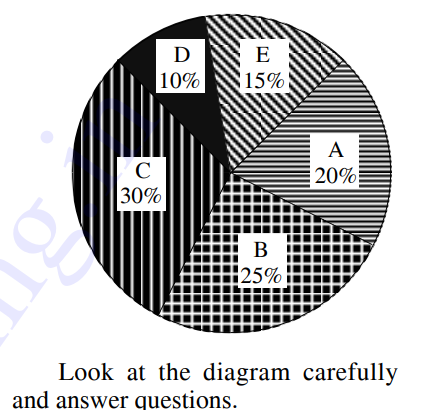
If the difference between two expenditures be represented by 18∘ in the pie-diagram these expenditures are ----
View SolutionThe pie chart shows the breakup of expenditure of a college for the year 2017. Study the diagram and answer the following questions.
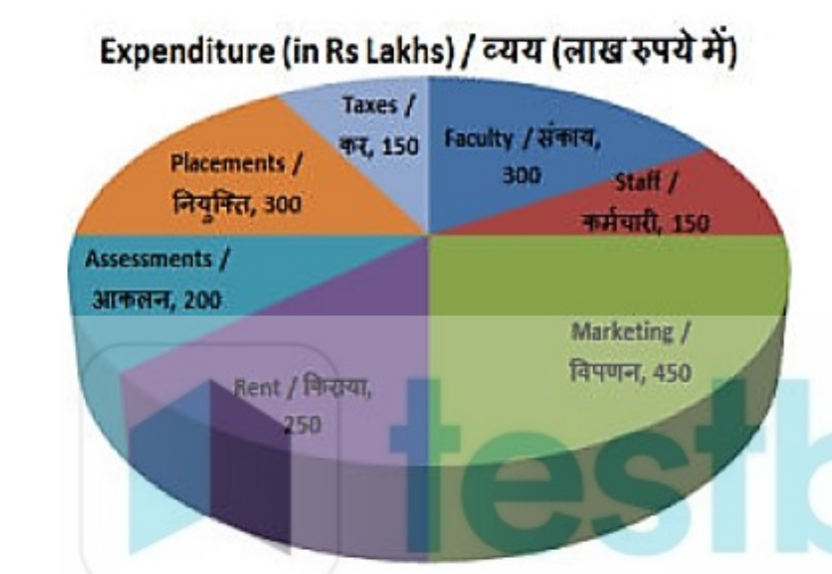
What is the total expenditure (in Rs lakhs)?
View SolutionThe pie chart shows the result of an online survey which asked people about their favourite game. Study the diagram and answer the following questions.
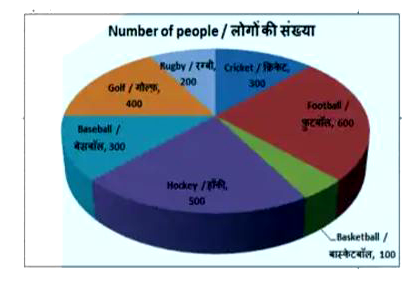
Which game is the favourite of most people surveyed?
View SolutionThe pie chart shows the results of an online survey which asked people about their favourite author. Study the diagram and answer he following questions.
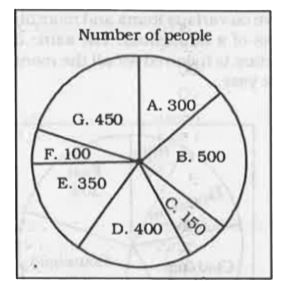
Which author is the favourite of most people surveyed?
View SolutionThe pie chart shows the results of an online survey which asked people about their favourite game. Study the diagram and answer the following questions.
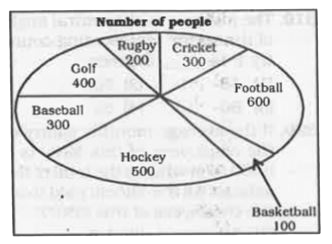
Which game is the favourite of most people surveyed?
View Solution
