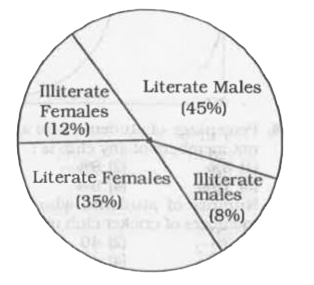
The pie-chart shoews the percentage of literate and illiterate males and females in a state. Study the diagram and answer the following questions.
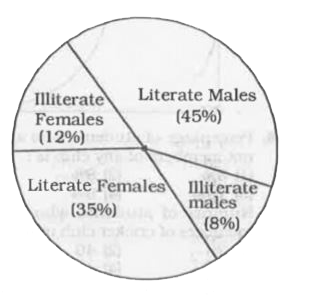
The difference of central angles corresponding to illiterate male and illiterate female is
The correct Answer is:D
Step by step video, text & image solution for The pie-chart shoews the percentage of literate and illiterate males and females in a state. Study the diagram and answer the following questions. The difference of central angles corresponding to illiterate male and illiterate female is by Maths experts to help you in doubts & scoring excellent marks in Class 14 exams.
Updated on:21/07/2023Topper's Solved these Questions
- STATISTICS AND DATA INTERPRETATIONBOOK - KIRAN PUBLICATIONCHAPTER - STATISTICS AND DATA INTERPRETATIONEXERCISE - TYPE-VIII
8 Videos
- STATISTICS AND DATA INTERPRETATIONBOOK - KIRAN PUBLICATIONCHAPTER - STATISTICS AND DATA INTERPRETATIONEXERCISE - TYPE-VI
86 Videos
- SIMPLIFICATIONBOOK - KIRAN PUBLICATIONCHAPTER - SIMPLIFICATIONEXERCISE - TEST YOURSELF
25 Videos
- TIME AND DISTANCEBOOK - KIRAN PUBLICATIONCHAPTER - TIME AND DISTANCEEXERCISE - Type -XI
74 Videos
Similar Questions
Knowledge Check
The pie-chart shows the percentage of literate and illiterate males and females in a state. Study the diagram and answer the following questions.
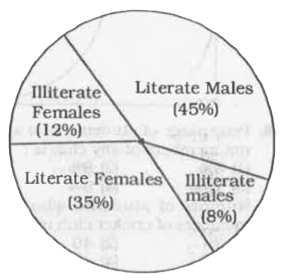
If the total number is 35000, then the difference between the number of literate males and that of literate females isA3500B3700C400D4500The pie-chart shoews the percentage of literate and illiterate males and females in a state. Study the diagram and answer the following questions.
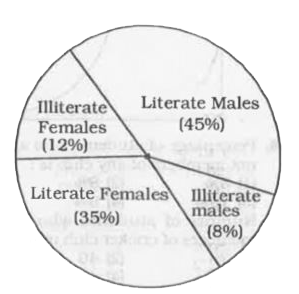
If two categories together have a central angle of 169.2∘, then these categories areAliterate females and illiterate femalesBliterate males and illiterate femalesCilliterate males and illiterate femalesDilliterate males and literate femalesThe pie-chart shows the percentage of literate and illiterate males and females in a state. Study the diagram and answer the following questions.
If the difference between the two categories of people are represented by 36∘ in the diagram, then the categories areAliterate males and literate femalesBliterate males and literate malesCilliterate males and literate femalesDilliterate males and illiterate females
The pie chart shows the breakup of expenditure of a college for the year 2017. Study the diagram and answer the following questions.
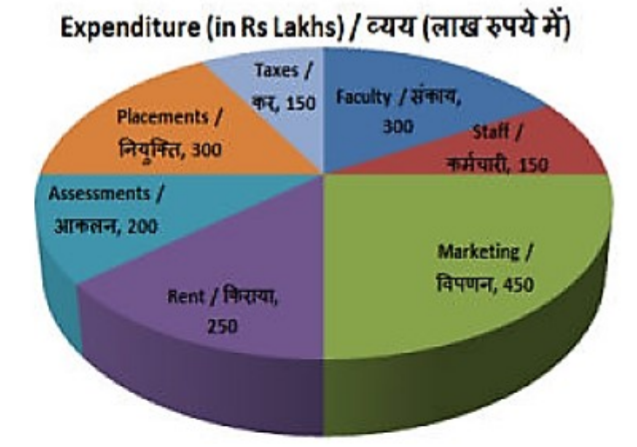
The measure of the central angle of the sector representing Faculty is ________ degrees.
View SolutionThe HR department of a company prepared a report. The pie chart represents all the employees of the company and to which state they belong to. Study the diagram and answer the following questions.
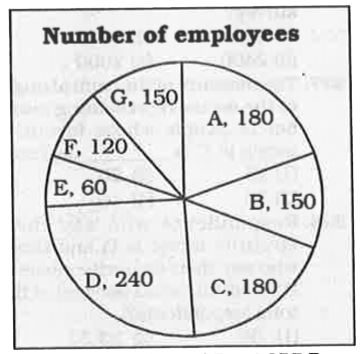
The measure of the central angle of the sector representing state B is ____ degrees.
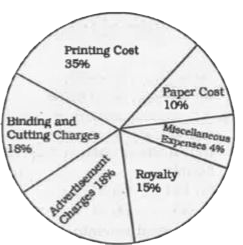
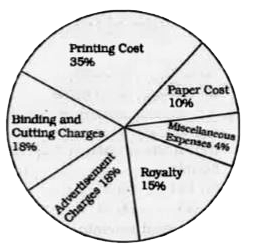
View SolutionThe following pie-chart shows the percentage distribution of the expenditure incurred in publishing a book. Study the pie-chart and answer the questions based on it.
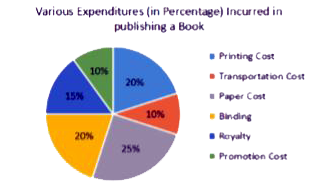
What is the central angle of the sector corresponding to the expenditure incurred on binding?
View SolutionThe following pie-chart shows the percentage distribution of the expenditure incurred in publishing a book. Read the pie-chart and answer the questions.
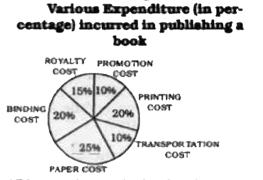
The central angle of the sector corresponding to the expenditure incurred on Royality is :
View SolutionIn the given pie-chart, the comaprative study of the production or Rice, Wheat, Sugar and Tea of a country is given. Study the pie-chart and answer the following questions.
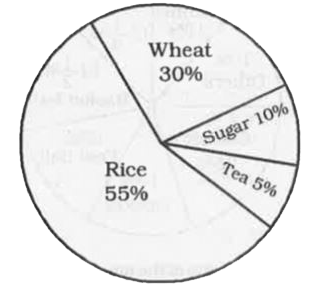
The central angle of percentage of wheat is
View Solution

