Study the following graph carefully and answer the given questions.

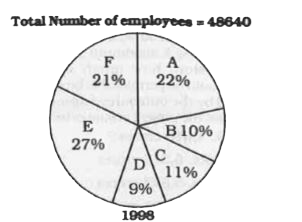
From 1997 to 1998 in the case of which of the following types of employees the change was maximum ?
B
A
C
D
The correct Answer is:A
Step by step video, text & image solution for Study the following graph carefully and answer the given questions. From 1997 to 1998 in the case of which of the following types of employees the change was maximum ? by Maths experts to help you in doubts & scoring excellent marks in Class 14 exams.
Updated on:21/07/2023Topper's Solved these Questions
- STATISTICS AND DATA INTERPRETATIONBOOK - KIRAN PUBLICATIONCHAPTER - STATISTICS AND DATA INTERPRETATIONEXERCISE - TYPE-VIII
8 Videos
- STATISTICS AND DATA INTERPRETATIONBOOK - KIRAN PUBLICATIONCHAPTER - STATISTICS AND DATA INTERPRETATIONEXERCISE - TYPE-VI
86 Videos
- SIMPLIFICATIONBOOK - KIRAN PUBLICATIONCHAPTER - SIMPLIFICATIONEXERCISE - TEST YOURSELF
25 Videos
- TIME AND DISTANCEBOOK - KIRAN PUBLICATIONCHAPTER - TIME AND DISTANCEEXERCISE - Type -XI
74 Videos
Similar Questions
Study the following graph carefully and answer the given questions.
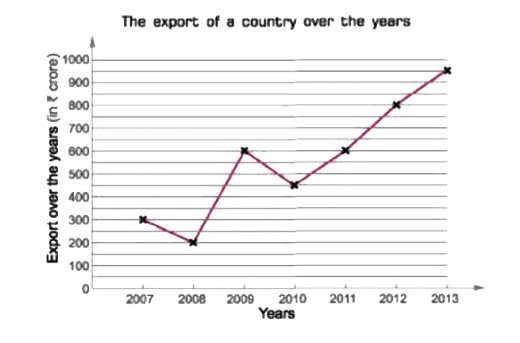
What is the total exports ( in ? Crore) for the given years ?
View SolutionStudy the following graph carefully and answer the given questions.
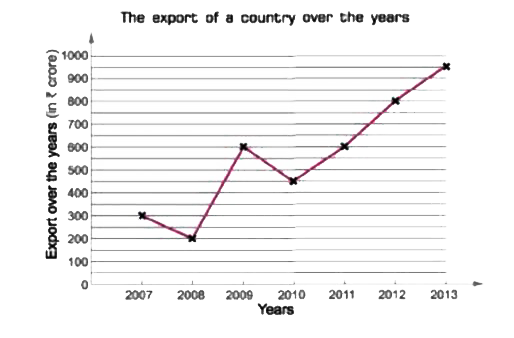
What is the percentage increase in exports from the lowest to the highest for the given years ?
View Solution
Knowledge Check
Study the following graph carefully and answer the given questions.
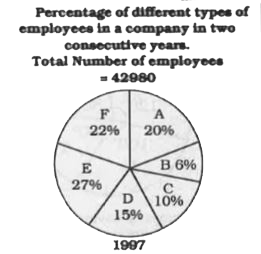
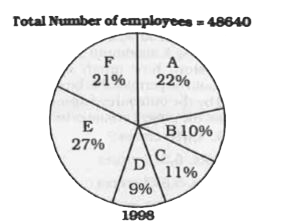
In 1997 the total number of which of the following types of pairs of employees was approximately equal to A type of employees in 1998 ?AC and DBD and ECB and CDA and CStudy the following bar graph and answer the question that follows.
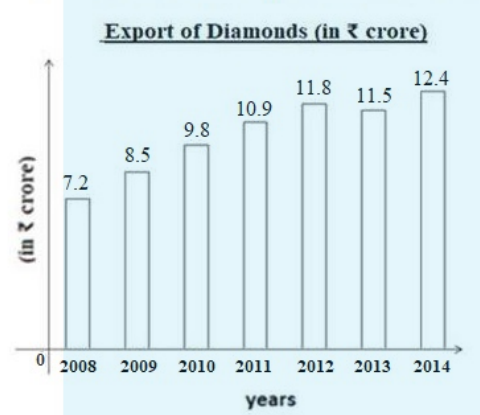
In which year was the maximin percentage increase in diamonds exports compared to the previous year?A2014B2009C2010D2012Study the following graph carefully and answer the given questions.

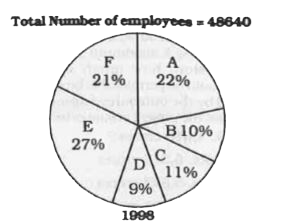
What was the approximate difference in the number of B type of employees during 1997 and 1998 ?A2285B2325C2620D2085
Study the following graph carefully and answer the given questions.
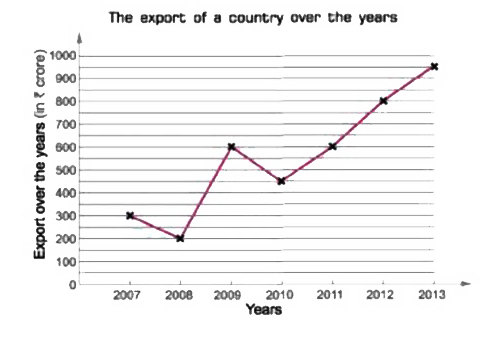
Exports in 2009 is approximately what per cent of that of year 2010 ?
View SolutionStudy the following graph carefully and answer the given questions.
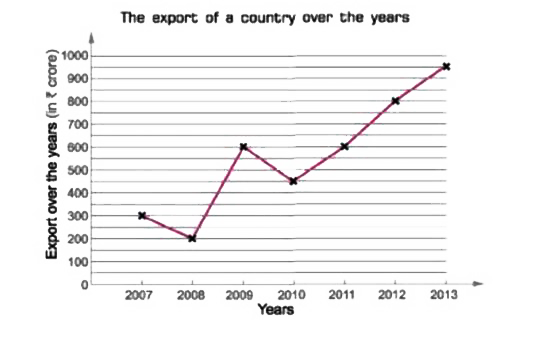
What is the difference in exports in the years 2009 and 2010 ?
View SolutionStudy the following graphs carefully and answer the questions that follow :
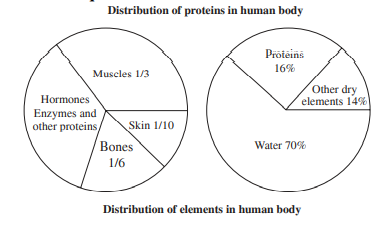
In the human body what is made of neither bones nor skin ?
View SolutionStudy the following graph carefully and answer the questions that follow
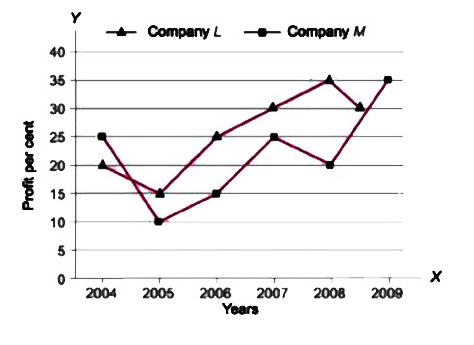
Which of the following statements is true with respect to the above graph ?
View SolutionExamine the following graph carefully and answer the questions given below it :
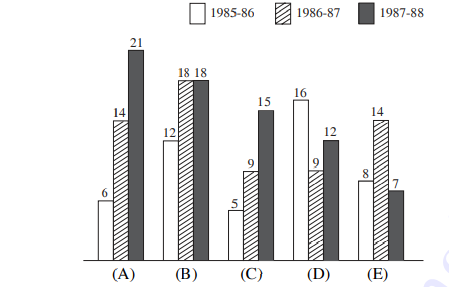
Which of the following statements is false ?
View Solution
